The declining ophthalmology workforce paired with the increasing demand for this service has left certain geographic areas struggling to meet the medical needs of their population. A Google Trends analysis recently identified the US states with the highest imbalances of supply vs. demand for ophthalmologists, including South Dakota, Delaware, Michigan and Arizona. Patient attitudes and differences in internet search volume are also likely to play a role, the findings suggest.
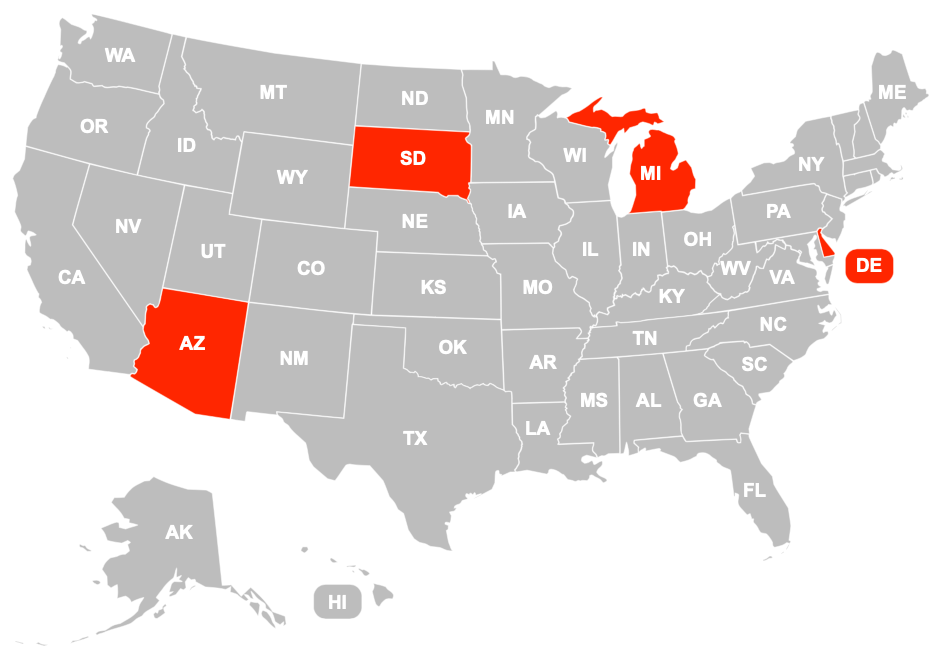 |
| This study found that South Dakota, Delaware, Michigan and Arizona were among the states with the greatest imbalance of ophthalmology supply vs. demand (appearing on the map in red), while Washington DC, Hawaii, Oregon and Montana had the least imbalance. Map created with fla-shop.com. Click image to enlarge. |
To measure ophthalmology demand across the country, the researchers gathered Google trends data for search terms “ophthalmology” and “ophthalmologist” between 2004 and 2019 in each US state, which was used to calculate relative search volumes (RSV). Ophthalmologist density was determined by dividing the number of practicing ophthalmologists in each state by the State Census Bureau population estimates. Lastly, relative demand index (RDI) was calculated by dividing RSV by ophthalmologist density. To put the significance of this value into context, a higher RDI in a state translates to a higher risk of unmet medical needs.
The researchers found that the distribution of ophthalmologists and residency programs ranged widely from state to state. Those with the highest concentration of ophthalmologists per 10,000 people were Washington DC (1.42), Maryland (0.94), Massachusetts (0.87) and New York (0.86), while the lowest were Wyoming (0.19), Idaho (0.36), New Mexico (0.38) and Nevada (0.39). RSVs ranged from 36 (Alaska and North Dakota) to 100 (Michigan).
The highest RDI—signifying an inadequate local ophthalmology workforce—was found in South Dakota (100), Delaware (84), Michigan (66) and Arizona (56). Conversely, areas with the lowest RDI included Washington DC (0), Hawaii (7), Oregon (8) and Montana (14). Regarding residency programs alone, the highest numbers were found in New York (18), Texas (9), and California (9), while 12 states lacked residency programs altogether.
The study authors also analyzed the urban vs. rural distribution of ophthalmologists and noted a positive correlation between urbanization and ophthalmologist concentration per 10,000 people. “This positive correlation suggests that more urbanized areas may not only have higher numbers of ophthalmologists due to the larger populations, but even a higher concentration per capita, suggesting a synergistic effect of urbanization drawing physicians to these areas,” the researchers reasoned in their paper for Ophthalmic Epidemiology.
They also point out that the states with the highest RDI are not clustered together on the map. South Dakota, for example, had the highest RDI (100) of all US states, while its neighbor, North Dakota, had an RDI of only 22. “This divergence is despite the sister states South Dakota and North Dakota having similar physician densities (0.418 and 0.420 physician per 10,000 people, respectively) and similar percentages of the population living in urban areas (55.3% and 57.3%, respectively), suggesting that a difference in search volume is the driving factor in the divergence in RDI between these two states,” the researchers explained in their study, also noting that a similar trend was observed among the other high RDI states. In their opinion, “this finding highlights a difference in patient attitudes in these states, whereby patients are particularly more engaged online, which may be due to a number of cultural and healthcare systems factors which require further study to elucidate.”
The researchers bring attention to several limitations of their study, such as that only the search terms “ophthalmologist” and “ophthalmology” were included in the trends analysis, while alternative keywords (i.e., “eye doctor,” “cataract surgeon”) were excluded but may also be used by patients searching for providers online. Additionally, the study also did not capture “offline” ophthalmologist demand, such as referrals by optometrists or PCPs.
In conclusion, the study authors wrote, “We identified a large degree of heterogeneity in the geographic distribution of physicians as well as residency programs in the nation. Additionally, the calculated RDI served to highlight states with the highest potential for either an oversupply or undersupply of physicians due to relative mismatches between supply and demand.”
Akosman O, Tran E, Rosenberg S, et al. Patient demand for ophthalmologists in the united states: a Google Trends analysis. Ophthalmic Epidemiology. October 26, 2023. [Epub ahead of print]. |