Differentiating between high myopia and glaucoma is a clinical conundrum many of us face daily in our clinical practice. The clinical correlation between myopia and glaucoma has been demonstrated in previous studies and continues to be researched; still, many challenges and limitations exist in current testing protocols that may threaten your ability to confidently differentiate between the two diseases.
In this article, we will dive into the pathophysiology of myopia as a risk factor for glaucoma and share techniques and clinical pearls to help you overcome some of these difficulties and accurately diagnose and manage patients.
 |
|
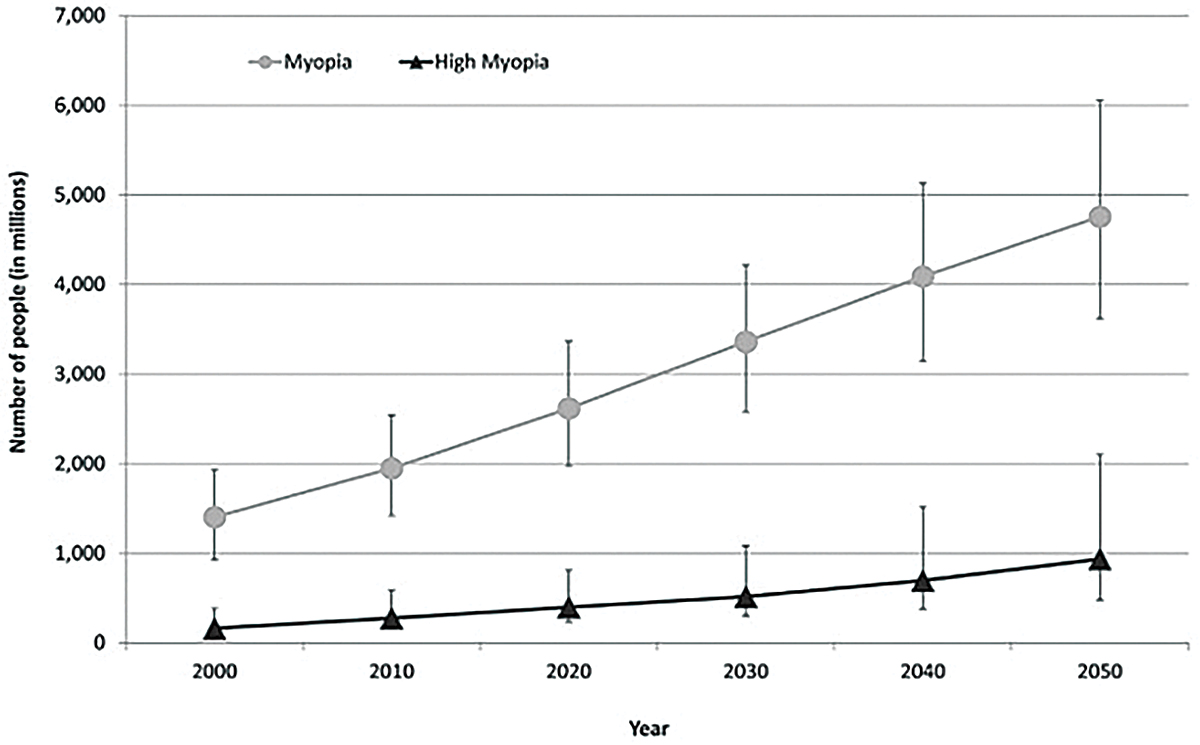
Fig. 1. This graph shows the current prevalence of myopia and estimates of significant increases anticipated by 2050.1 Click image to enlarge. |
Connecting the Dots
Myopia is the most common ocular disorder worldwide, a statistic unlikely to change in the foreseeable future. In 2000, it was estimated that 1.4 billion people worldwide were myopic (22.9%); of those, 163 million had high myopia (2.7%). Current estimations predict the worldwide prevalence of myopia and high myopia in 2050 to be 49.8% and 9.8%, respectively.1 A recent study also showed an increase in myopia in school-aged children due to the COVID-19 pandemic.2
Previous epidemiological studies across multiple ethnic groups have shown an increased prevalence of glaucoma in myopic patients, including the Blue Mountain Eye study, Barbados Eye Study, Beaver Dam Eye Study, Singapore Malay Eye Study, Beijing Eye Study and Latino Eye Study. Another recent meta-analysis by determined that for each 1.0D increase of myopia, glaucoma risk increased by 20%, shown to accelerate around -6.0D of myopia and further at -8.0D, demonstrating a correlation between degenerative myopia and increased glaucoma risk.3
It is currently unknown how myopia increases the risk of glaucoma, but there are several hypotheses. One is that the tilting of the optic nerve often seen in myopia may lead to a direct insult or a shearing effect to the ganglion cell axons. Another hypothesis is that the effects of intraocular pressure (IOP) can be more pronounced in myopes due to thinning of the retinal nerve fiber layer (RNFL), lamina cribrosa and sclera.4
In glaucoma, the primary site for axonal injury is the lamina cribrosa. As mentioned previously, the tilting of the optic nerve can have a direct effect on the retinal ganglion cell axons. This may be due to the increased stretching of the lamina cribrosa, particularly on the temporal side, and increased scleral bend due to the tilting of the optic nerve commonly seen in myopia.
The increase in axial length (AL) in myopia also causes a stretching and thinning of the lamina cribrosa. The thinning not only makes the retinal ganglion cell axons more susceptible to increased IOP, but it also alters the translaminar pressure gradient. The translaminar pressure gradient is the difference between the outward pressure on the optic nerve by IOP and inward pressure from the cerebrospinal fluid. In some studies, the translaminar pressure gradient has a better correlation with the degree of glaucomatous optic neuropathy.5 The lamina cribrosa is composed of a collagen matrix similar to that of the cornea.
 |
|
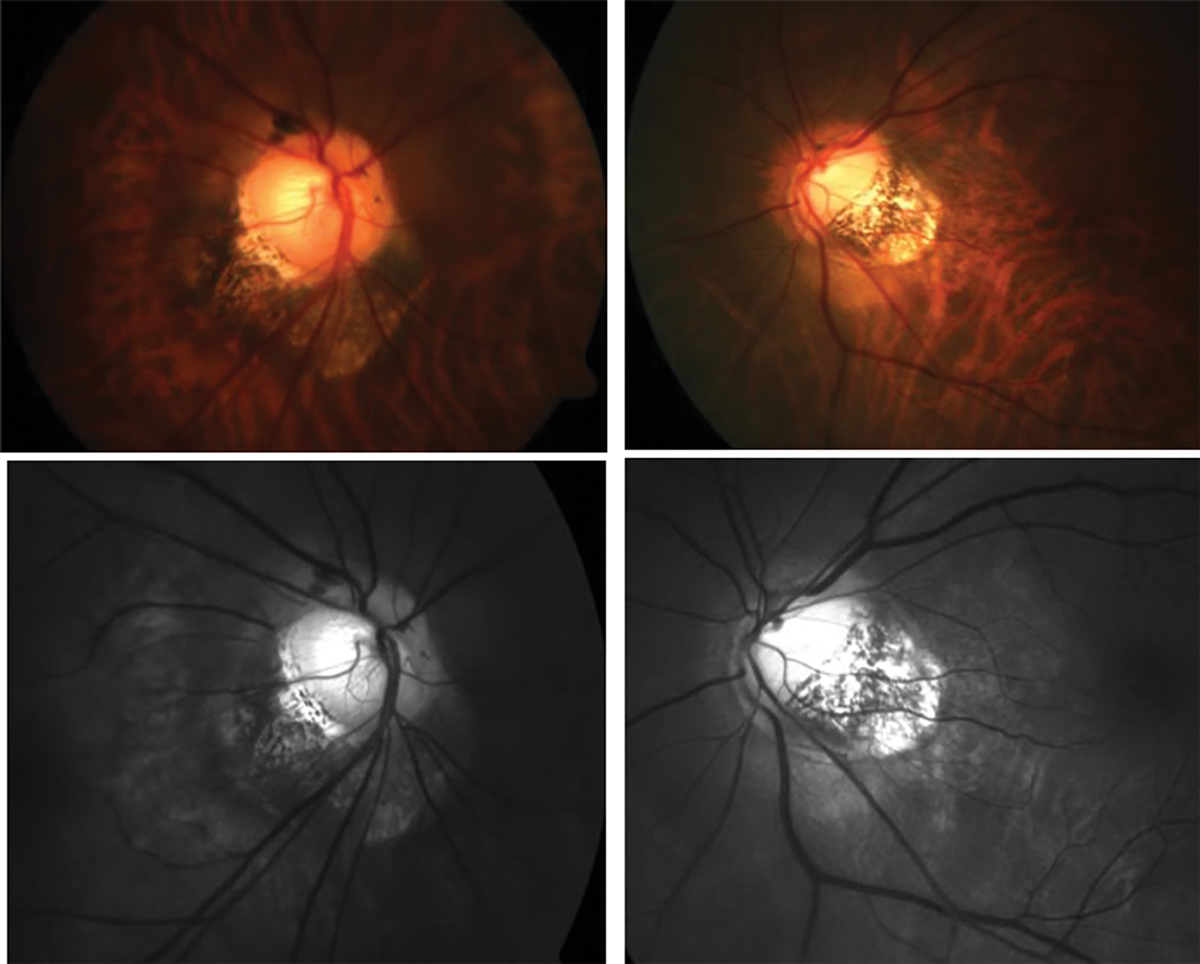
Fig. 2. Traditional fundus photography shows anomalous optic nerve insertion, tilting and torsion and posterior staphyloma in a highly myopic patient (top). Below is the same image of the optic nerves using red-free fundus photography to visualize the extent of thinning more easily (bottom). Click image to enlarge. |
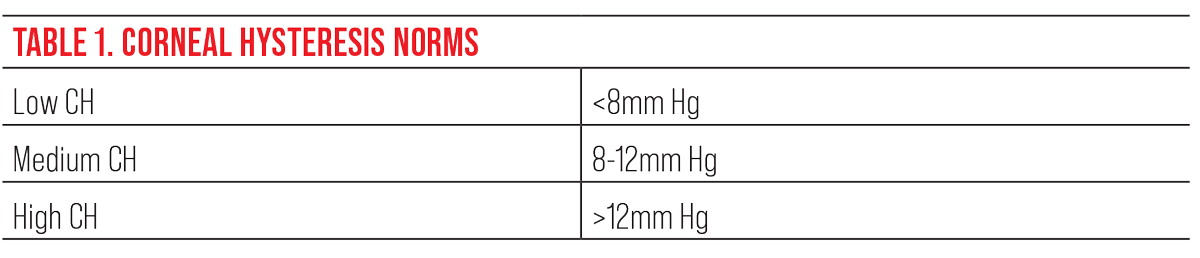
The Ocular Response Analyzer (ORA) is a relatively new device that measures the biomechanical properties of the cornea. It uses a bidirectional applanation process to assess the viscoelastic properties of the cornea. Although it’s not fully understood, some studies link the viscoelastic properties of the cornea to those of the lamina cribrosa.6 Corneal hysteresis (CH) is a measurement of the cornea’s ability to dampen the effects of eye pressure and has been shown to be an independent risk factor for glaucoma progression.7 Several studies have shown that myopic eyes tend to have a lower CH, suggesting that those eyes are more prone to stretching and axonal injury in comparison to emmetropic and hyperopic eyes.8 Using CH can help you determine the risk of glaucoma or progression. A patient with a lower CH (<8mm Hg) is more at risk than a patient with higher CH (>12mm Hg).9
Another useful measurement of the ORA is the corneal-compensated IOP (IOPcc). IOP obtained by the traditional Goldmann applanation technique can be inaccurate since corneal properties tend to differ in myopic patients either via the natural differences in collagen composition and/or arrangement in the corneal stroma. This measure compensates for the corneal properties and may offer a more accurate measure of the IOP. Although research is still active, using the ORA to obtain corneal hysteresis values and IOPcc may be a useful tool to determine IOP and gauge the ability of the eye to resist its increase.
Traditional methods of diagnosing glaucoma include direct observation of the optic nerve to determine rim thinning, measuring IOP with Goldmann tonometry, using optical coherence tomography (OCT) to measure the thickness of the RNFL and performing a visual field test to determine any functional vision loss as a result of glaucoma. However, these traditional measures may be difficult to use due to anatomical changes in highly myopic eyes that make it challenging to determine if a glaucomatous process is occurring.
 |
|
This table shows the normative values for corneal hysteresis. To assess risk in glaucoma, the lower the CH, the greater the risk for glaucoma or glaucoma progression.9 Click image to enlarge. |
Optic Nerve
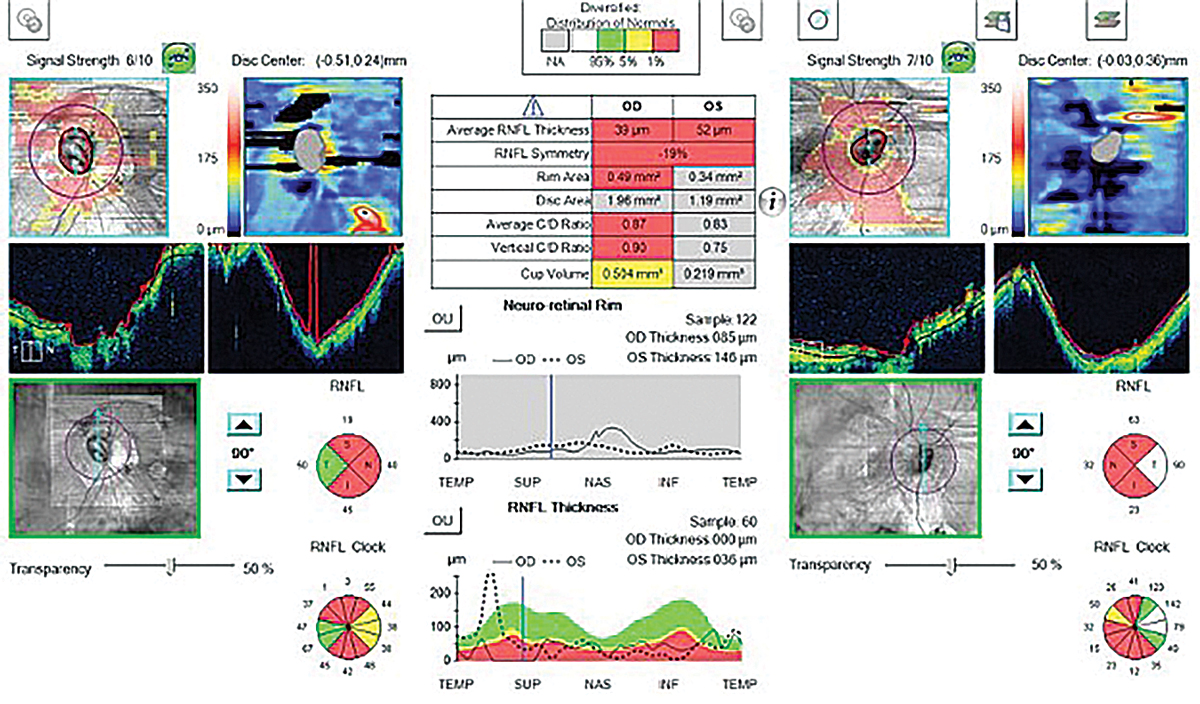
To diagnose glaucoma, clinicians assess the optic nerve with a fundus exam to determine if there is neuro-retinal rim thinning, particularly in the superior-temporal and inferior-temporal quadrants that are most vulnerable to glaucomatous damage.10 In degenerative myopia, tilting of the optic nerve and posterior staphylomas make this assessment challenging and, in some cases, impossible.
How would you describe the optic nerve head appearance in Figure 2? This is a difficult question to answer, and many optometrists may describe or document this patient’s optic nerve in different ways. To help determine the extent of rim thinning, red-free fundus photos should be captured which facilitate the visualization and delineation of the neuroretinal rim and optic cup. Other technologies such as OCT can be used to quantify the thickness of the RNFL.
 |
|
Fig. 3. Above are the RNFL thickness maps (left panel) and RNFL thickness deviation maps (right panel) of two myopic eyes with AL of (top) 27.26mm (spherical error: -6.75D) and (bottom) 26.61mm (spherical error: -2.00D). The RNFL distribution angles were 103.38 (top) and 137.58 (bottom) showing the increased temporalization of the RNFL bundles.11 Click image to enlarge. |
OCT
Since entering optometric practice in the late 1990s, this imaging modality has become a versatile tool used to examine the clinical manifestations of a variety of diseases—glaucoma included. When spectral-domain OCT became commercially available in 2007, it revolutionized the ability to diagnose glaucoma.
OCT takes structural measurements of the RNFL thickness and can detect change over time. Depending on the device, the OCT will take a 4.5x4.5mm circular scan around the optic nerve. It then measures where the Bruch’s membrane opening is to determine the edge of the optic nerve and measures the thickness of the rim tissue by taking the shortest distance to the edge of the internal limiting membrane.
In degenerative myopic patients, tilting of the optic nerve, posterior staphylomas and RNFL thinning in myopia generally result in abnormal OCT scans or incorrect segmentation. Other changes seen in myopic patients on OCT is the temporalization of the RNFL bundles. Studies have shown that as the degree of myopia is increased (both increases in AL and spherical equivalent), the greater the temporalization of the RNFL bundles (Figure 3).11 Abnormal OCT scans are sometimes flagged as red and may hint that there might be a glaucomatous process occurring.
Myopia is a common cause of “red disease,” which indicates a false positive of glaucoma (Figure 4).12 Clinicians may see this and initiate glaucoma treatment; however, it’s important to recognize that the abnormal thinning is secondary to the myopic changes and not a true glaucomatous process.
Within the OCT programming, each scan is compared to a normative or reference database created based on studies performed by each company. This helps clinicians determine whether the measured RNFL thickness is statistically normal or abnormal. The inclusion and exclusion criteria for each company varies based on studies they have performed. For example, Zeiss’s Cirrus OCT normative databased included patients between -12D to +8D, those who had vision better than 20/40, and did not have disc hemorrhages, RNFL defects or abnormal visual field. Heidelberg’s Spectralis OCT normative database included patients between -7D to +5D, patients who had vision better than 20/30 and those that had normal appearing optic discs with no visual field defects.13 Most of the representation within these ranges is located at the mean, and actual representation of patients at the extremes is limited. The actual representation of myopic patients in the OCT normative databases is quite trivial, which reduces the strength of the analysis and heightens the difficulty of glaucoma diagnosis in this cohort.
 |
|
Fig. 4. This abnormal OCT shows poor segmentation in both the heat maps and tomograms in a high myope. The statistical analysis shows “red,” meaning abnormal thinning; however, this isn’t due to glaucoma but rather is from poor segmentation caused by high myopia. Click image to enlarge. |
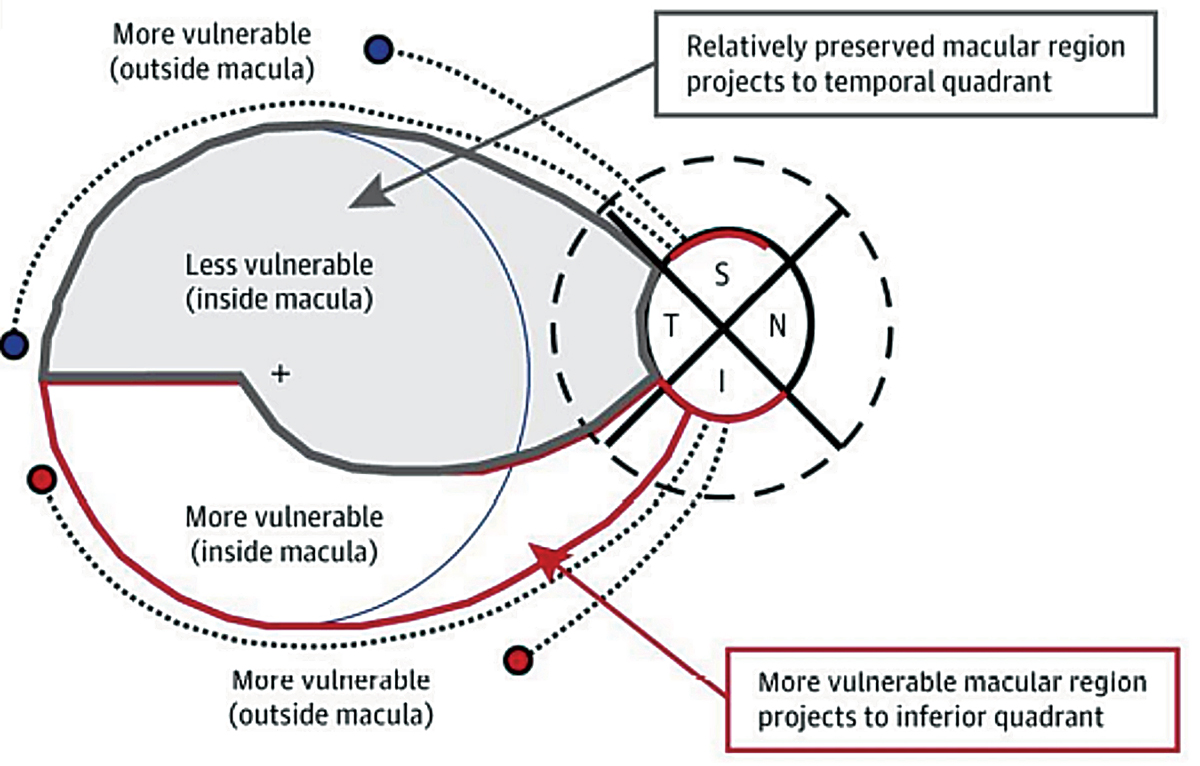
The analysis of the inner retinal thickness in the macula is complementary to the nerve fiber layer scan and offers useful information in glaucoma detection. In some cases of glaucoma where early damage occurs in the macular region first, taking only RNFL measurements would fail to detect the disease. This is highlighted by the work of Don Hood. The most vulnerable locations to be damaged by glaucoma are the temporal half of the inferior and superior quadrants of the optic nerve, which Hood named the superior and inferior vulnerability zones. Due to the macula being inferiorly displaced in most patients, the superior vulnerability zone does not consist of macular fibers. However, the inferior vulnerability zone consists of macular fibers (Figure 5).14 Obtaining macular OCT scan in all glaucoma patients is essential, and particularly in the case of glaucoma patients with high myopia, macular measurements of the ganglion cell complex may have a significantly better detection power than RNFL thickness due to anomalous nerve tilting or staphylomas.
 |
|
Fig. 5. This illustration demonstrates the inferior vulnerability zone, which consists of macular fibers that are at risk for damage due to glaucoma. The superior vulnerability zone does not consist of macular fibers.14 Click image to enlarge. |
In one previous study, macular measurements using OCT had greater diagnostic power than RNFL measurements in high myopia.15 Both glaucomatous and highly myopic eyes can show areas of RNFL thinning. However, certain types of focal loss in the ganglion cell complex can correlate to glaucomatous damage. In clinical practice, when no other macular pathologies are present, using the ganglion cell complex is quite useful in the long-term management of these patients. However, the definition of degenerative myopia tells us that people with a high amount of nearsightedness can also show degenerative changes in the retina and macula. In these patients, it’s critical to look carefully for macular staphylomas, macular schisis, macular holes, vitreomacular traction, epiretinal membrane, lacquer cracks and choroidal neovascular membranes, which will help in choosing the best imaging techniques and informing a proper diagnosis.
OCT-A
Although its value in glaucoma care is still under investigation, previous research shows that parameters in OCT angiography (OCT-A) can detect glaucomatous damage. This type of imaging obtains measurements of the retinal and choroidal vasculature by taking sequential B-scans of the same location of the retina. Mobile blood cells create changes in reflectance, while stationary tissue does not. The OCT-A device then creates a map of the blood vessels to illustrate all the microvascular layers.
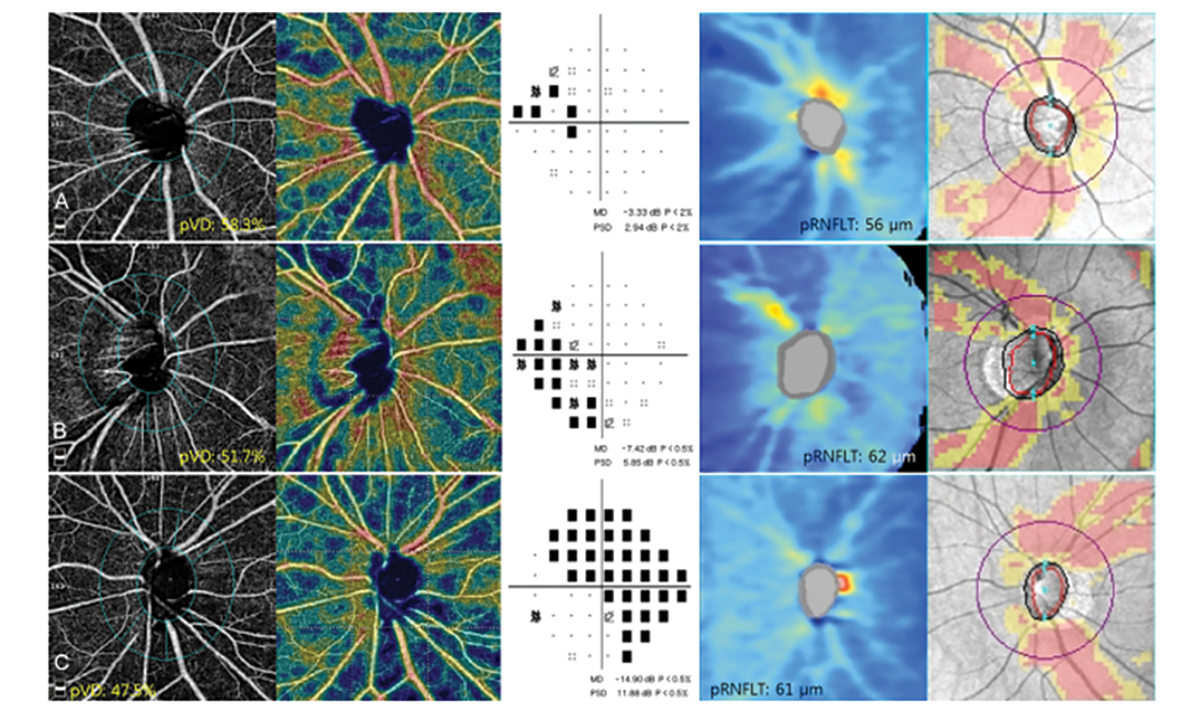
Other parameters that may be detected in glaucoma patients include peripapillary vessel density and superficial vascular complex defects. Studies have shown defects on OCT-A correlate to both the visual field and OCT RNFL. There is varying evidence on whether RNFL thinning precedes a decrease in vessel density or vice versa in glaucoma. In certain cases, the OCT RNFL is not as predictable in conditions like myelinated nerve fiber layer, epiretinal membranes and myopic discs. One study found that the vessel density parameter showed a better correlation to visual field defects in glaucoma patients with high myopia than the OCT RNFL.16
 |
|
Fig. 6. This image shows the OCT-A scans of peripapillary vessel density, visual field scans and OCT RNFL scans of three different patients. The peripapillary vessel density loss correlated more to the visual field defect than to the OCT RNFL scan.14 Click image to enlarge. |
Although there are numerous studies that show the usefulness of detecting glaucoma using OCT-A, they do have several limitations, one being the lack of a normative database and progression analysis. Without a progression analysis tool, clinicians must decide on their own whether actual progression is present. With more studies and creation of a normative database and progression analysis, OCT-A may be an important tool to be used, particularly in myopic patients with glaucoma in the future.
Visual Fields
A key assessment in the diagnosis and management of glaucoma is visual fields, as they provide a functional measurement of vision. The visual field is often compared to the structural OCT measurement to determine if there is a functional defect that correlates to RNFL thinning typical in glaucoma. However, in pathological myopia, optic nerve thinning, tilting and torsion can create visual field defects similar to those seen in glaucoma. In the Zhongshan Ophthalmic Center-Brien Holden Vision Institute (ZOC-BHVI) High Myopia Registry Study, 16.1% of the visual fields of myopic patients showed arcuate-like defects that mirrored those seen in glaucoma, and 3.4% of those showed advanced arcuate defects seen in more advanced glaucoma cases.
There are other potential sources of error when performing the visual field test on myopic patients. Trial lenses are used to correct for the refractive error, causing significant minification of the stimulus. As a result, patients may not be able to see certain stimuli, which may lead to a false estimation of their functional vision. Performing the test while the patient is corrected using contact lenses might be useful to obtain a more accurate measure of a patient’s visual field.
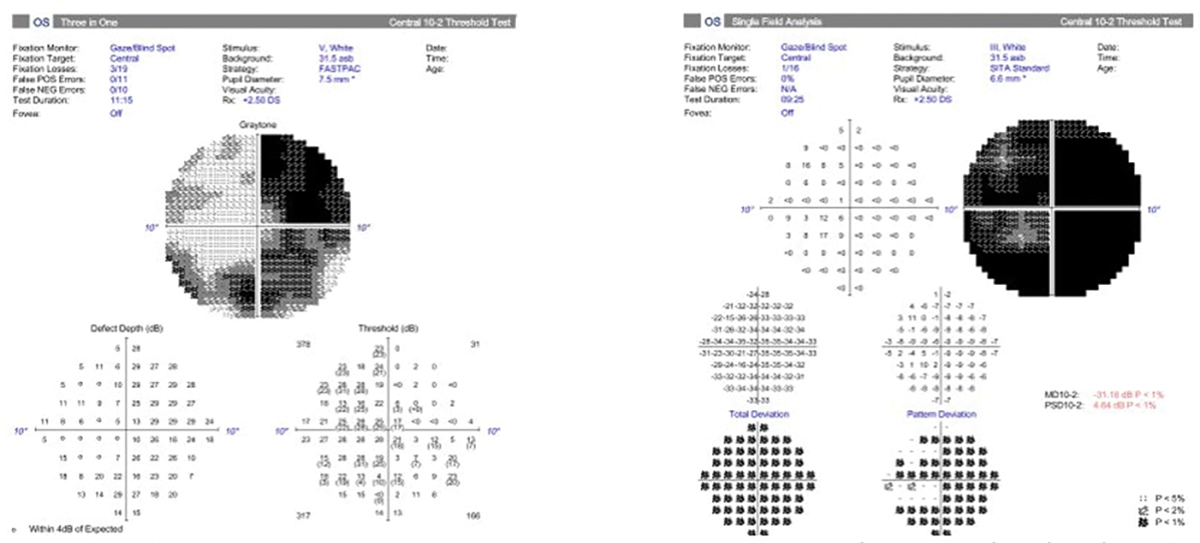
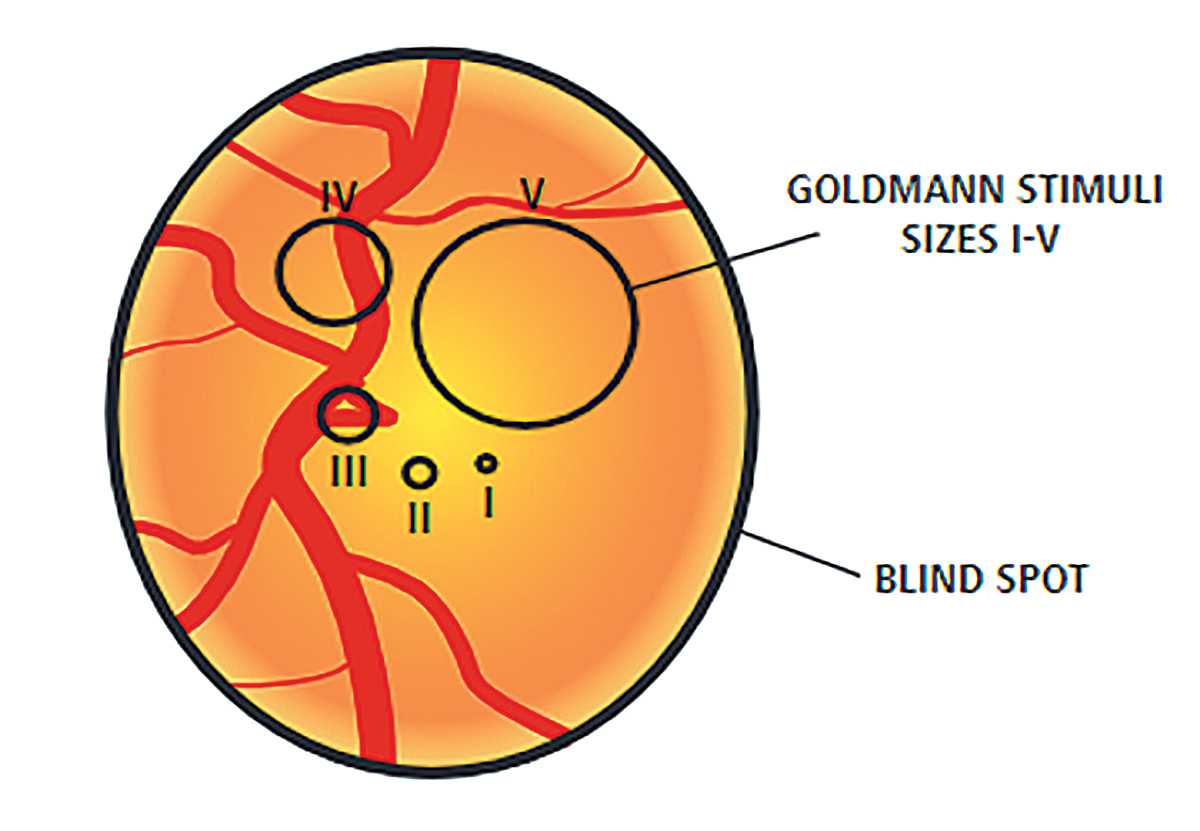
Most visual fields use a size III target, which is a 4mm2 stimulus on a 30cm bowl. In advanced cases of glaucoma or highly myopic patients where vision might be poorer than 20/100 Snellen acuity, a size V stimulus (64mm2 stimulus on a 30cm bowl) may be beneficial to gauge progression more easily. In some cases of myopia and glaucoma, using a size III stimulus would show a generalized depression of the entire visual field. Using a size V stimulus helps to determine patterns more easily and detect small changes in disease progression. Although these fields tend to be helpful in advanced cases, there is no progression analysis. Clinicians must determine progression by using the raw data to evaluate changes in threshold, particularly looking for decreases in the quadrant-specific values.
 |
|
Fig. 7. A 10-2 visual field with a size III target showing a generalized depression (right). Beside it is a 10-2 of the same patient with a size V target showing a better visualization of the pattern of visual field loss (left). The bigger stimulus size may allow for easier determination of progression. Click image to enlarge. |
Axial Length
Although these measurements are not typically used in glaucoma patients, the parameter might be a better indicator for glaucoma risk than refractive error alone. Given that we know that degenerative myopic eyes are more prone to stretching, taking AL measurements periodically on patients might be useful in the management of their glaucoma.
As myopic eyes elongate, changes tend to occur around the lamina, as it is the weakest point of the sclera. A study including patients from Tokyo High Myopia Clinic found that glaucomatous optic neuropathy was correlated to AL measurements, and that the prevalence of glaucoma increased from 12.2% in eyes with AL of >28mm to 42.1% in eyes with AL of >30mm.17 For highly myopic patients, taking an AL measurement at the first exam as a baseline and continuing to observe for change over time can be diagnostic. The future of myopia control shows us the importance of taking AL measurements to monitor changes in the anatomy and decide on the most effective treatment to slow progression.
 |
|
Fig. 8. This diagram shows a representation of the difference in size of the stimulus size III target and size V target. Photo by Anders Heijl and Vincent Michael Patella. Click image to enlarge. |
Clinical Pearls
When diagnosing glaucoma or determining if there is progression in your highly myopic patients, use the following tips to help guide your clinical decision making:
1. Demographics
Consider patient’s age, family history and amount of myopia.
AL measurements may offer correlation to the degree of laminar vulnerability.
Review additional factors including max IOP, central corneal thickness and corneal hysteresis to help differentiate those at higher risk for glaucoma or progression.
2. Clinical Data
Dilated fundus examination is essential to stereoscopically assess the papillary optic nerve rim tissue.
Documentation of the peripapillary tissue for peripapillary atrophy, disc hemorrhages and the amount of disc tilting should be noted.
Fundus photography is a good way to assess structural changes, especially if OCT scans are unreliable.
Note the limitations of RNFL OCT scans on highly myopic eyes. RNFL scans may be difficult to obtain and interpret. Be mindful of red disease, as these patients are often excluded from normative databases.
Ganglion cell measurements can be helpful and offer additional information; however, the presence of myopic macular pathology may complicate usefulness.
Visual fields are often very helpful in determining progression in this population. Consider having patients contact lens-corrected to reduce spectacle minification and consider larger stimulus size.
3. Clinical Decision Making
Glaucoma is a progressive condition, so use the above strategies to aid in detection of true glaucomatous progression.
Repeat testing often to determine baselines, as higher testing variability is common among these patients.
Understanding the higher degree of glaucoma risk in myopic patients based on epidemiological studies will optimize your clinical judgment in this cohort.
Conclusion
The current United States population is aging. In the US Census 2017 report, it was estimated that in 2030, the older population will outnumber the pediatric population for the first time in history.18 As the elderly population increases, so will the prevalence of glaucoma. It was estimated in 2020 that about 76 million people worldwide were diagnosed with glaucoma, and by 2040, predictions show that number will increase to about 111.8 million people across the globe.19
The prevalence of myopia is also on the rise. Combined this trend with the increase in glaucoma and it’s clear that optometrists are going to find themselves on the front lines of glaucoma diagnosis and differentiation in myopic patients.
Although diagnosing and managing these patients can be difficult, understanding the strengths and limitations of our current battery of tests will increase the ability to accurately distinguish the two conditions. Additionally, new technologies will allow optometrists to tackle this challenge head-on.
Mr. Rouse, Ms. Sabol and Mr. Ramdass are OD candidates at SUNY College of Optometry in New York (class of 2022) and have no financial interests to disclose. Dr. Laul is a fellow of American Academy of Optometry and an associate clinical professor at SUNY, where he also runs the Glaucoma Micro-credential program. He has received speaker honoraria from Carl Zeiss Meditec. Dr. Madonna is a professor and chair of the Department of Clinical Education at SUNY as well as director of the college’s Office of Continuing Professional Education. He has financial interests with the following companies: Aerie, Allergan, Bausch + Lomb, Carl Zeiss Meditec, Dompé and Heidelberg.
|
1. Holden BA, Fricke TR, Wilson DA, et al. Global prevalence of myopia and high myopia and temporal trends from 2000 through 2050. Ophthalmology. 2016;123(5):1036-42. 2. Wang J, Li Y, Musch DC, et al. Progression of myopia in school-aged children after COVID-19 home confinement. JAMA Ophthalmol. 2021;139(3):293-300. 3. Burgoyne C. The morphological difference between glaucoma and other optic neuropathies. J Neuroophthalmol. 2015;35(01:S8-S21. 4. Jonas JB, Budde WM. Optic nerve damage in highly myopic eyes with chronic open-angle glaucoma. Eur J Ophthalmol. 2005;15(1):41–47. 5. Ha A, Kim CK, Shim SR, Chang IB, Kim YK. Degree of myopia and glaucoma risk: A dose-response meta-analysis. Am Journal of Ophthalmol. 2022;236:107-119. 6. Lee KM, Kim TW, Lee EJ, et al. Association of corneal hysteresis with lamina cribrosa curvature in primary open angle glaucoma. IOVS. 2019;60(13):4171-77. 7. Medeiros FA, Meira-Freitas D, Lisbosa R, et al. corneal hysteresis as a risk factor for glaucoma progression: a prospective longitudinal study. Ophthalmology. 2013;120(8):1533-40. 8. Chang PY, Chang SW, Wang JY. Assessment of corneal biomechanical properties and intraocular pressure with the ocular response analyzer in childhood myopia. Br J Ophthalmol. 2010;94(7): 877–81. 9. Radcliffe NM. Hysteresis: A powerful tool for glaucoma care. Review of Ophthalmology. January 6, 2014. 10. Hood DC. Improving our understanding, and detection, of glaucomatous damage: an approach based upon optical coherence tomography (OCT). Prog Retin Eye Res. 2017;57:46-75. 11. Leung CKS, Yu M, Weinreb R, et al. Retinal nerve fiber layer imaging with spectral-domain optical coherence tomography: Interpreting the RNFL Maps in healthy myopic eyes. IOVS. 2012; 53(11):7194-7200. 12. Schuman JS. Optical coherence tomography in high myopia. JAMA Ophthalmol. 2016;134(9):1040. 13. Fechtner R. Review of normative database construction in available OCT models. World Glaucoma Congress. www.fda.gov/media/84165/download. 2013. Vancouver, Canada. Accessed January 1, 2022. 14. Hood DC, Raza AS. On improving the use of oct imaging for detecting glaucomatous damage. Br J Ophthalmol. 2014;98(Suppl 2):ii1-9. 15. Zhang Y, Wen W, Sun X. Comparison of several parameters in two optical coherence tomography systems for detecting glaucomatous defects in high myopia. IOVS. 2016;57:4910-15. 16. Shin JW, Kwon J, Lee J, Kookk MS. Relationship between vessel density and visual field sensitivity in glaucomatous eyes with high myopia. Br J Ophthalmol. 2019;103: 585-91. 17. Jonas JB, Weber P, Nagaoka N, Ohno-Matsui K. Glaucoma in high myopia and parapapillary delta zone. PLoS One. 2017;12(4):e0175120. 18. Older people projected to outnumber children for the first time in US history. www.census.gov/newsroom/press-releases/2018/cb18-41-population-projections.html. US Census Bureau. 2018;CB18-41. Accessed January 1, 2022. 19. Tham YC, Li X, Wong TY, et al. global prevalence of glaucoma and projections of glaucoma burden through 2040. Ophthalmology. 2014;121(11):20. |