 |
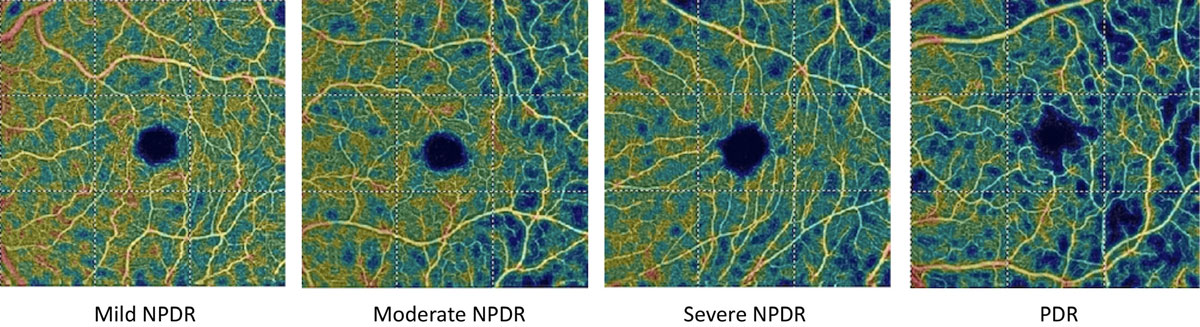
| In this study, no OCT or OCT-A metrics were associated with new DR development; however, some were able to predict disease progression. Photo: Julie Rodman, OD. Click image to enlarge. |
With multimodal imaging, eye doctors can detect and analyze retinal and microvascular changes in patients with diabetes to help predict the development and progression of diabetic retinopathy (DR). One recent study assessed whether OCT and OCT-A metrics share an association with DR development and worsening in those with type 2 diabetes. They found that while OCT-A metrics have utility in predicting disease progression in this patient population, there didn’t appear to be an association between any of the OCT or OCT-A metrics and DR development.
A total of 280 participants with type 2 diabetes underwent ultra-widefield fundus photography, OCT and OCT-A in this study. Over four years, various OCT-derived data was examined in relation to the development and worsening of DR.
By the end of follow-up, 16.7% of the eyes with no DR at baseline developed DR, which the researchers noted was associated with a higher baseline HbA1c and longer diabetes duration, but not with any of the retinal parameters. Forty-five eyes in the cohort had nonproliferative DR at baseline, and 37.7% showed DR progression after four years.
The researchers observed that DR progressors had a lower baseline vessel density than non-progressors (12.90 vs. 14.90mm/mm2), as well as significantly less macular perfusion (31.79% in progressors vs. 36.96% in non-progressors); however, no differences were detected in OCT-derived retinal nerve fiber layer and ganglion cell-inner plexiform layer thicknesses in progressors vs. non-progressors. They noted that the area under the curve (AUC)—a measure of predictive ability—for vessel density was 0.643, with 77.4% sensitivity and 41.8% specificity for a cut-off of 15.85mm/mm2. For macular perfusion, the AUC was 0.635, with 77.4% sensitivity and 25.5% specificity for a cut-off of 40.8%.
“None of the OCT and OCT-A measures showed any significant differences between the two groups [progressors and non-progressors],” the researchers noted in their paper, published in Eye. “A likely explanation could be that retinal structural changes may become apparent only after the onset of visible microvascular changes.”
The study’s findings agreed with previous literature describing microvascular changes on OCT-A in eyes with no DR and those with various stages of DR. “A larger foveal avascular zone and reduced vessel density have been associated with the presence and severity of DR, and OCT-A-derived foveal avascular zone area and fractal dimension have been associated with DR progression,” the researchers explained. “We show that the vessel density and macular perfusion measures of the superficial capillary plexus at baseline were lower (by ~13%) in those with DR progression compared with those with stable DR.”
The researchers concluded in their paper that “OCT-A metrics have utility in predicting worsening rather than the development of DR. This rapid and noninvasive assessment of morphological alterations in the retinal capillary network combined with examination of retinal functional measures may help us better understand the pathophysiology of DR.”
Srinivasan S, Sivaprasad S, Rajalakshmi R, et al. Association of OCT and OCT angiography measures with the development and worsening of diabetic retinopathy in type 2 diabetes. Eye. June 6, 2023. [Epub ahead of print]. |