 |
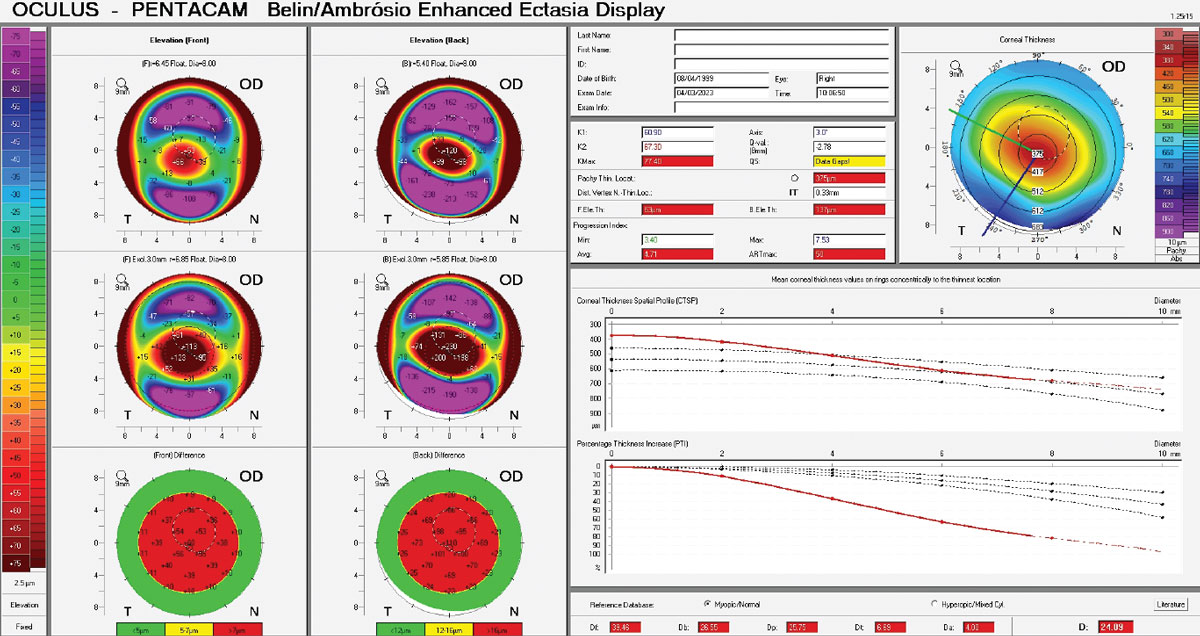
| Researchers have identified a predictor of biomechanical progression in keratoconus involving the difference between maximum and minimum stress. Photo: Christine Sindt, OD. Click image to enlarge. |
As the prevalence of keratoconus (KCN) continues to increase—now estimated at 265 cases per 100,000 individuals—so must the research efforts to detect reliable clinical measures of disease progression. While slit-lamp exams and corneal topography maps may help detect KCN, the lack of uniform criteria to diagnose the condition threatens the accuracy of these methods, especially in cases of early or subclinical disease. As an alternative tool for diagnosis and progression analysis, researchers recently proposed a novel stress distribution map that takes into account both the curvature and thickness of the cornea. They observed that in normal corneas, the stress distribution is dominated by corneal thickness, whereas in KCN, stress patterns are related to curvature.
Included in the prospective, observational, cross-sectional study were 66 eyes of 40 newly diagnosed KCN patients. The control group consisted of 155 left eyes of 155 patients without KCN. The new Corneal Contribution to Stress (CSS) maps were calculated from pachymetry and tangential curvature maps, and custom software identified the 2mm diameter zones of greatest curvature (Cspot-max), thinnest pachymetry (Pach-min), greatest stress (CCSmax) and lowest stress (CCSmin). Then, stress differences were calculated as CCSmax minus CCSmin, and T-tests were performed to compare data between KCN patients and controls.
The results showed the following:
- In normal controls, CCSmax was significantly closer to Pach-min (0.79) and Cspot-max (2.04) than CCSmin (3.17, 2.73 respectively).
- In KCN patients, CCSmin was significantly closer to Cspot-max (1.35) than CCSmax (2.52).
- In KCN, Cspot-max (severity) was significantly related to stress difference with a weak relationship in controls.
- Only in KCN patients, Cspot-max was significantly related to the distance from Pach-min to CCSmax.
“Corneal stress is driven by thickness in normal controls, with greatest stress at thinnest pachymetry and greatest curvature,” the researchers explained in their paper for Ophthalmology Science. “However, maximum stress moves away from thinnest pachymetry with progression in KCN, and minimum stress is associated with maximum curvature.” They noted that KCN severity “is significantly related to greater difference between maximum and minimum stress, consistent with the biomechanical cycle of decompensation.”
The researchers wrote in their paper that this evolution of stress distribution throughout KCN progression can help ODs interpret tomographic maps from a single visit, which they note can apply to any corneal tomographic device that includes tangential curvature and pachymetry. “Future studies are warranted to investigate the use of stress differences as a predictor of biomechanical progression in keratoconus, as well as its detection,” they conclude.
Roberts CJ, Knoll KM, Mahmoud AM, Hendershot AJ, Yuhas PT. Corneal stress distribution evolves from thickness-driven in normal corneas to curvature-driven with progression in keratoconus. Ophthalmology Sci. July 2023. [Epub ahead of print]. |