|
In our last column, “Is This Actually Amblyopia?”, Dr. Schnell did an amazing job of covering the concept that amblyopia is a diagnosis of exclusion.1 A diagnosis of amblyopia cannot simply be slapped on to a patient when their visual acuity (VA) does not get down to 20/20. We must have a reason; otherwise, we open ourselves up to legal consequences if the case goes south. She discussed amblyogenic factors related to refractive condition, strabismus or a history of deprivation and introduced three cases highlighting the concept. Well—what if we have a case with a clear amblyogenic factor, are providing treatment in the form of lenses and vision therapy and we are not seeing the improvement that we expect? In such cases, we turn to the visual evoked potential (VEP) to provide case clarity.
Why the VEP?
This is a diagnostic test that measures the electrical activity in the brain in response to visual stimuli. It is used to assess the functioning of the visual pathways from the eyes to the occipital lobe, which is the part of the brain responsible for processing visual information. It is non-invasive, can be used on patients of any age and assists eyecare providers in ruling out optic nerve damage, demyelinating diseases like multiple sclerosis or other visual pathway disorders. VEPs have been used as an alternative method to assess VA in non-verbal infants, adults with impaired intellectual abilities and potential malingerers.2
There are many commercial devices on the market that are easy to use and quite compact compared to the early days of the VEP in the 60s. Most typically, a checkboard pattern of varying spatial frequencies, ranging from 8x8 to 128x128, is used. While looking at the screen, the white boxes turn black and the black turn white at about 2Hz, or cycles per second.3
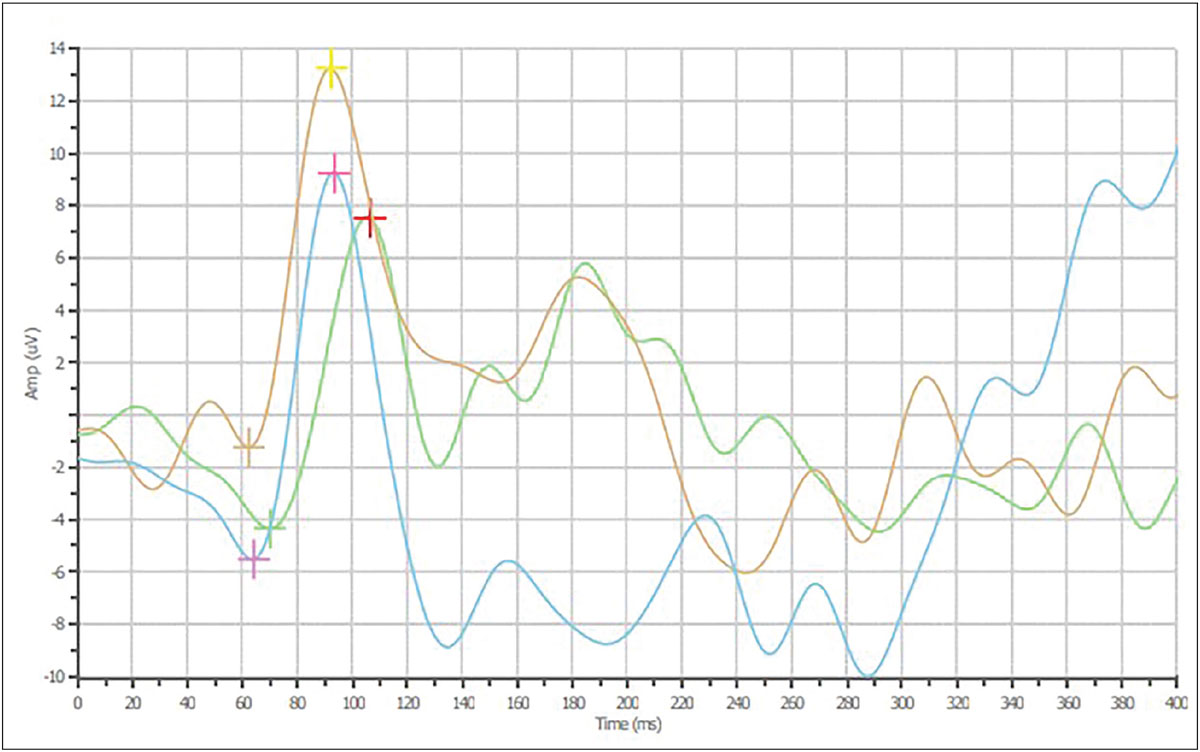
When evaluating the VEP results, we look at the amplitude, latency and binocular summation. The amplitude tells us about the amount of electricity from the occipital cortex. In Figure 1, this is presented by the height difference from the first to the second set of pluses—the N75 and P100, respectively. The latency is the time delay between the target being flashed and the P100, which is the maximum positive deflection in the relative voltage in that area of the brain compared to the background noise. In general, the larger the boxes or lower the spatial frequency, the faster the signal arrives. The final number we look at is binocular summation, and the name says it all: we expect the amplitude to be higher when both eyes are participating.3
Case 1
A 13-year-old girl presented wearing glasses for a primary care examination. Her history included blurry vision in the right eye, glasses wear since she was young and a history of patching therapy. Despite wearing the glasses and patching, her vision remained poor. With her spectacles, her VA was 20/150 OD, 20/20 OS and 20/20 OU. Her chair skills were normal but there was an absence of global stereopsis. After refraction (+4.00 -1.50x165 OD, plano OS), her best-corrected VA was 20/125 OD, 20/20 OS at distance and 20/200 OD, 20/20 OS at near. She was scheduled for a contact lens fitting, at which a Biofinity (CooperVision) toric lens (+4.00-1.25x170) was fit on the right eye, giving 20/100 VA. Vision therapy using a binocular approach was initiated, as patching was previously performed, and the teen was not keen on doing so again.
Vision therapy was initiated for the patient with the goal of improving the right eye’s acuity and developing some level of stereopsis. While the purpose of the first 10 weeks of therapy are laying the groundwork and building basic skills, we always hope to see a positive trend in the examination data.
At a 10-week follow-up visit, however, there was no change observed in the numbers. Even though there was an amblyogenic factor present—the anisometropia—we decided to perform a VEP to be on the safe side. Figure 1 shows the 16x16 spatial frequency pattern which is fairly classic for amblyopia. The latency and amplitude are both reduced when comparing the right and the left eyes. As expected, both the latency (89.8ms to 128ms) and amplitude (8.21µV to 2.62µV) also decreased as the spatial frequency was made smaller. Based on the results of the VEP testing, vision therapy was continued but with a more guarded prognosis due to the numbers from the lower spatial frequencies.
 |
|
Fig. 1. VEP for the 16x16 spatial frequency showing lower amplitude (106.4ms OD, 95.8ms OS, 93.7ms OU) and increased latency (11.90µV OD, 14.44µV OS, 14.75µV OU). Click image to enlarge. |
Case 2
A 12-year-old girl presented with a longstanding strabismus since age one. Cover test showed a constant right exotropia at distance and near of about 25.0D. She had worn glasses for many years and reported good compliance, but her vision in both eyes was “not perfect,” and the right eye was slightly worse. Her best-corrected VA with -4.50 -4.75x180 OD, -3.00 -4.75x165 OS was 20/40+3 OD and 20/30-3 OS, indicating a bilateral amblyopic refractive condition on top of the strabismus, causing the right eye’s acuity to be worse than the left. Prior to starting vision therapy, a VEP and OCT were performed. As with the VEP in the previous case, the latency was greater in the right eye across the different spatial frequencies, confirming the diagnosis. The OCT showed no defect in either eye. Vision therapy has yet to begin due to the parent’s schedule.
Takeaways
In both of these cases, we used the VEP both to confirm the diagnosis and to rule out other potential conditions that would complicate the therapy process. There are a few important rules of which you must be aware when using the VEP diagnostically in your practice. Of course, the data is just that: data. The VEP cannot be used as a stand-alone test to diagnose any specific condition, but the results do aid the clinician in the decision-making process. Even though we used the VEP in cases involving amblyopia, we did not use it to predict the outcome of the vision therapy. We will repeat testing as therapy progresses to determine subclinical improvement. Lastly, while in a perfect world we would love to get testing at different spatial frequencies, one clean test is sometimes all you get and all you need to aid in—or to confirm—the diagnosis.
As the cost and size of VEP units has come down over the years, more and more offices are using them to aid in the diagnostic process. If your office has one, use it more! If your office does not have one, consider adding it to next year’s budget, and until then, phone a friend nearby who has one and develop a test-based relationship, which is a win-win situation. Once you start down the VEP path, you will be better able to diagnose and treat your patients.
Thank you to Dr. Christopher Borgman for performing and interpreting the VEPs used in these cases.
Dr. Taub is a professor and co-supervisor of the Vision Therapy and Pediatrics residency at Southern College of Optometry (SCO) in Memphis. He specializes in vision therapy, pediatrics and brain injury. Dr. Schnell is a professor at SCO and teaches courses on ocular motility and vision therapy. She works in the pediatric and vision therapy clinics and is co-supervisor of the Vision Therapy and Pediatrics residency. Her clinical interests include infant and toddler eye care, vision therapy, visual development and the treatment and management of special populations. They have no financial interests to disclose.
1. Schnell PH, Taub MB. Is this actually amblyopia? Rev Optom. reviewofoptometry.com/article/is-this-actually-amblyopia. 2024;161(8):32-5. 2. Baiano C, Zeppieri M. Visual evoked potential. In: StatPearls. Treasure Island (FL): StatPearls Publishing. Last updated May 11, 2023. 3. Harris P. Evaluation strategies using electrodiagnostics. In: Schnell PH, Taub MB, Duckman R. Visual development, diagnosis, and treatment of the pediatric patient. 2nd ed. Wolters Kluwer. 2020. |