 |
In this second of two columns focused on identifying structural changes related to progressive disease, there is a neuro-ophthalmic twist.
Case
This 74-year-old Caucasian man was last seen by me in May 2024 as a follow-up to his normal tension glaucoma with a couple of interesting twists in his health since we first met in 2017. Back then, he initially presented to me as a new patient carrying a diagnosis of normal tension glaucoma. At this first visit, he was taking latanoprost h.s. OU and had been so for approximately three years.
At that visit, visual acuities were 20/25- OU through hyperopic astigmatic correction. Pupils were ERRLA with no afferent pupillary defect. Pachymetry readings were 574µm OD and 581µm OS. Applanation tensions were 18mm Hg and 16mm Hg OD and OS, respectively. The anterior segments were essentially normal OU, and the patient was pseudophakic with clear centered intraocular lenses OU with clear posterior capsules. Gonioscopy at that visit demonstrated grade 4 open angles with moderate trabecular pigmentation OU.
The cup-to-disc ratio as seen through dilated pupils was judged to be 0.7x0.7 OD and 0.65x0.65 OS with slightly large optic discs. The retinal vascular picture as well as the macular evaluations were normal, given his age with no peripheral retinal problems noted.
Since the patient was establishing care with me, I did not make any changes to his medication regimen, as none were needed and he was scheduled for regular follow-ups. Subsequent visits demonstrated stable OCT scans and stable visual field studies with minimal defects OU on 24-2 strategy.
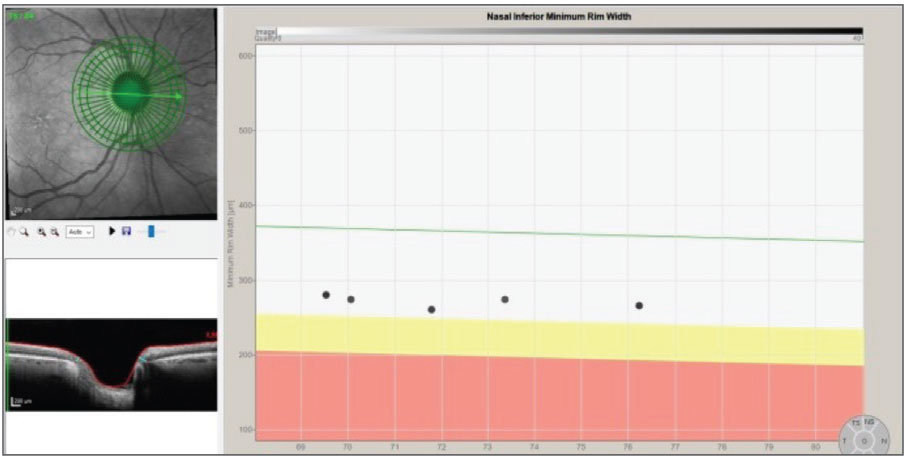
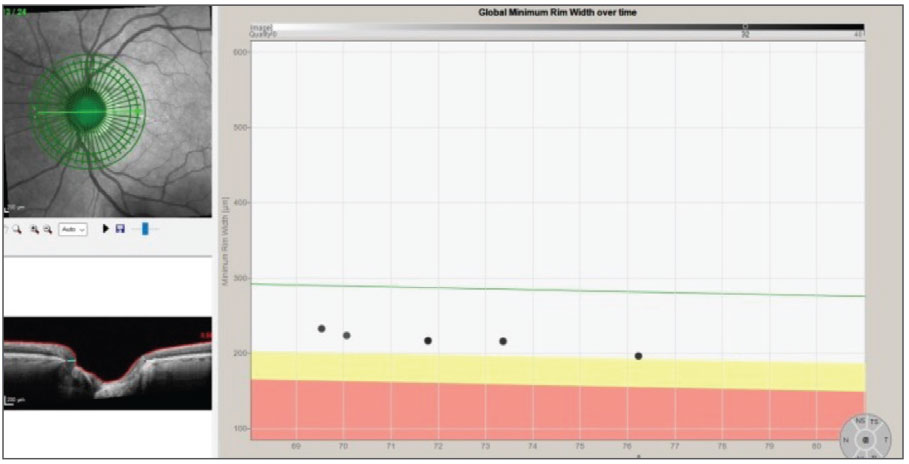
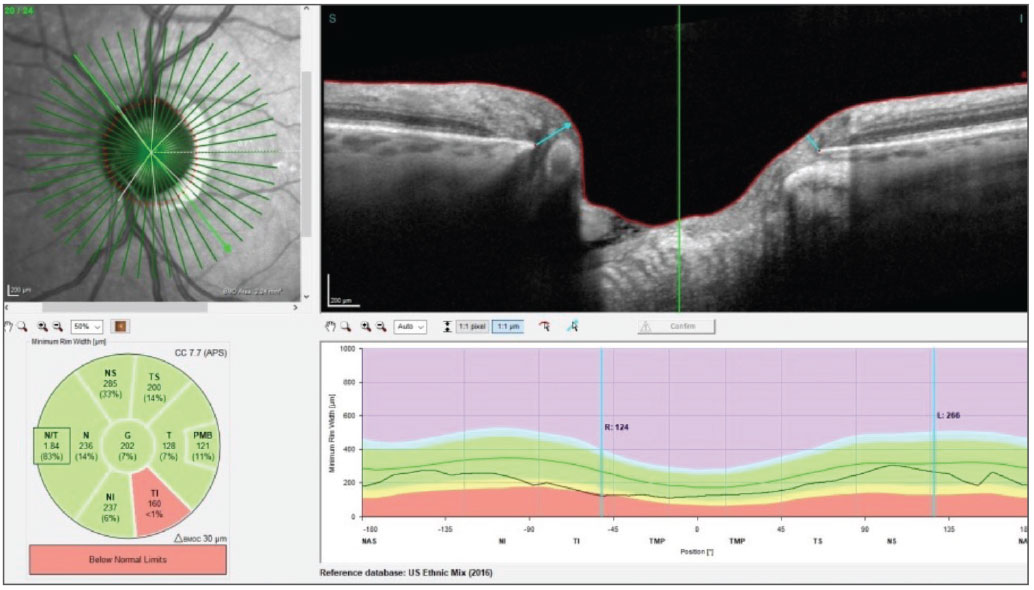
Figures 1 and 2 show the progression analyses of the right and left Bruch’s membrane opening-minimum rim width (BMO-MRW) indices over the past seven years, respectively. Note there was no change whatsoever in the right eye (Figure 1) and only a slight, gradual decline in the left eye (Figure 2). During this time interval, he did present with a disc hemorrhage in the right eye, but there was clearly no evidence of neuroretinal rim loss in the right eye following resolution of the disc hemorrhage.
 |
|
Fig. 1. The progression analysis of the right neuroretinal rim demonstrates no significant deterioration. Click image to enlarge. |
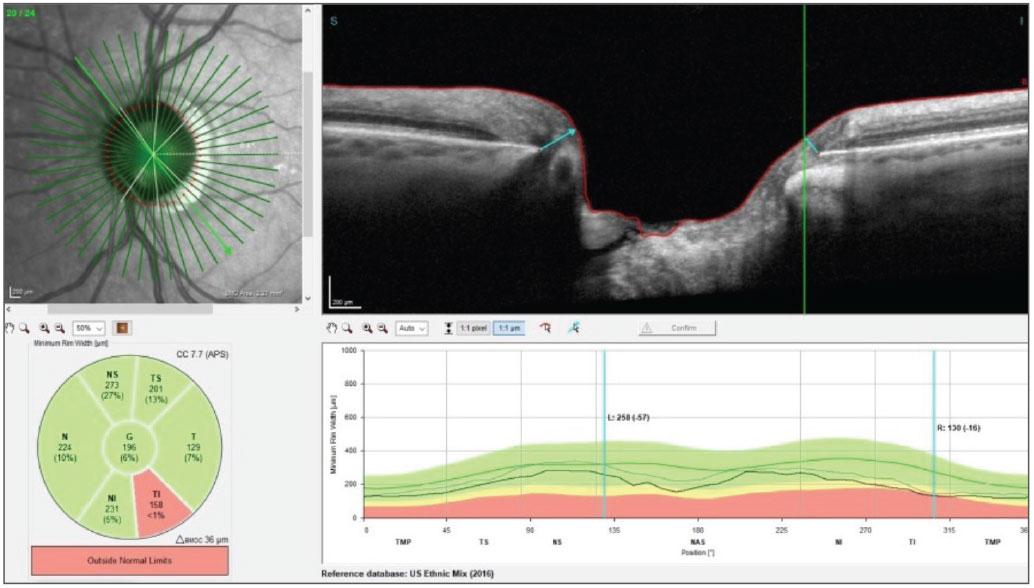
A close examination of Figure 2 shows a gap in OCT scans prior to the most recent scan in May 2024—he was last seen by me, prior to the most recent visit, in December 2022. There was a two-fold reason for this interval: the first had to do with COVID shutdowns, with many people not seeking care during that time. The other, however, was a more ominous issue with persistent headaches of several months’ duration in the early part of 2022. Ultimately, the patient was evaluated with MR imaging that revealed a pituitary adenoma skewed more anatomically to the left side, which also invaded the cavernous sinus on that side. Review of his medical records demonstrated no efferent cranial neuropathy or evidence of cavernous sinus syndrome, and the patient underwent uneventful neurosurgery to remove as much of the adenoma as was possible.
 |
|
Fig. 2. A slight decrease in the neuroretinal rim thickness in the left eye, especially with the most recent scan. Click image to enlarge. |
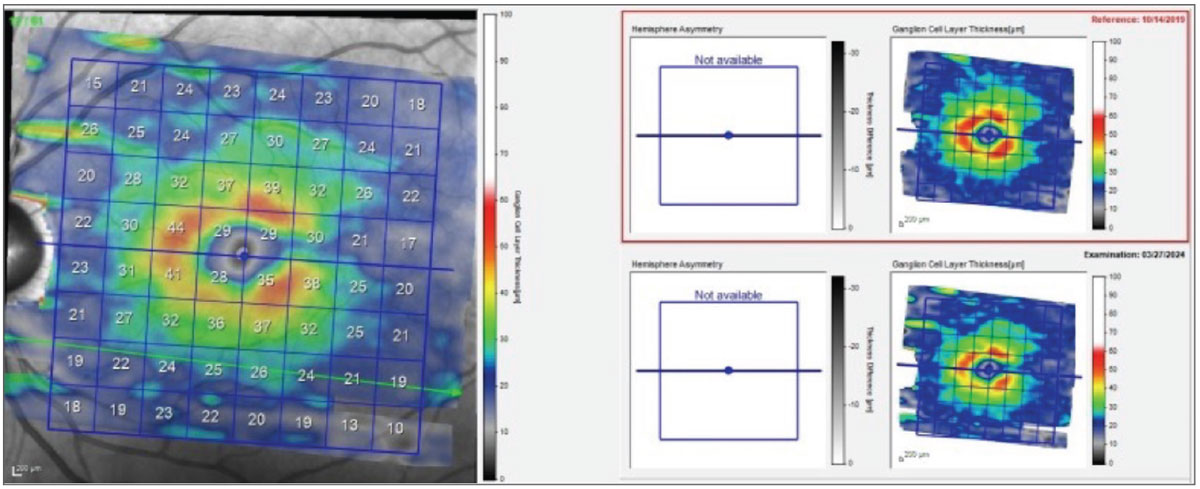
Ultimately he returned to my care, at the request of the neurosurgeon, in May 2024. At this visit, repeat OCT scans were obtained. As you can see in Figure 3, there is a decline in the retinal ganglion cell layer (GCL) thickness at the most recent visit compared with the baseline scan in 2019. This is consistent with glaucoma, though the question remains as to whether the anteriorly displaced pituitary adenoma which also invaded the left cavernous sinus may have played a role in the GCL thinning, as well as the last BMO-MRW scan OS showing neuroretinal rim thinning.
 |
|
Fig. 3. The change in retinal ganglion cell thickness from baseline to most recent scan. Note loss of retinal GCL thickness over this time period. Click image to enlarge. |
In any event, a neuro profile scan was also obtained in addition to the standard glaucoma scans performed at the last visit. The purpose of this scan was to help dissect out any changes in the neuroretinal rim that may occur in the future that are not related to glaucoma but rather consistent with the pituitary adenoma causing axonal damage. Of course, interval MR imaging is part and parcel to his continued care.
Note the neuro profile OCT scan of the left eye (Figure 4). In particular, pay attention to the segmentation of the papillomacular bundle separate from the global temporal rim sector. This segmentation is very sensitive to showing axonal damage not related to glaucoma, though in advanced glaucoma, this too, can ultimately be affected.
 |
|
Fig. 4. The baseline neuro OCT of the left eye shows a rather normal BMO-MRW, except for the inferotemporal sector, which is consistent with the glaucomatous defect seen at the initial visit. Click image to enlarge. |
Figure 5 shows the BMO-MRW scan of the left eye from baseline in 2019 through the most recent visit occurring in 2024. Note the global reduction in neuroretinal rim thickness throughout all sectors of the optic nerve except for the temporal sector. Most of this change occurred during the time interval when he was absent from ophthalmic oversight.
 |
|
Fig. 5. The changes to the BMO-MRW readings in the left eye from baseline until the most recent visit. Notice the global reduction in neuroretinal rim thickness. Click image to enlarge. |
Discussion
Could the changes seen in Figure 5 be related to his glaucoma potentially not being adequately treated during the hiatus from care? This is certainly a possibility. Could the changes seen in Figure 4 conversely be related to the pituitary adenoma? That, too, is possible, and I suspect that may partially be involved, but this is purely speculation on my part at this time. It is important to note that during this same time frame, there was absolutely no change to the right neuroretinal rim.
 |
|
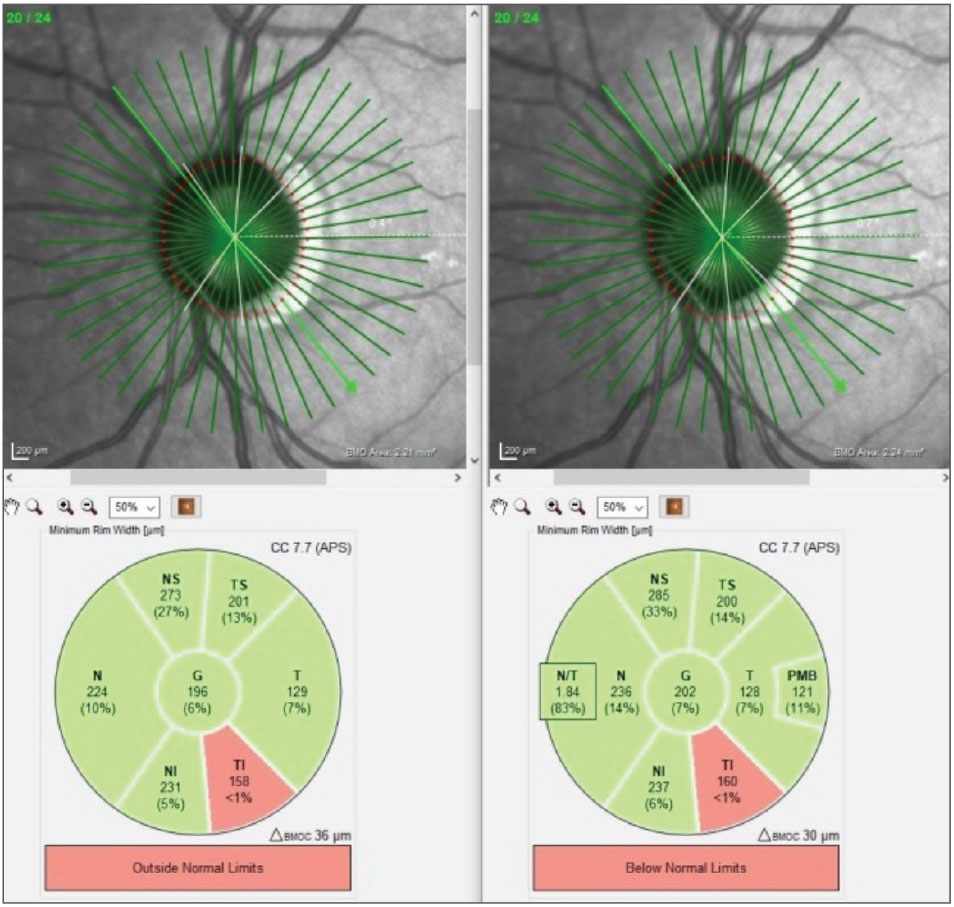
Fig. 6. The BMO-MRW scans using glaucoma software on the left and the neuro on the right. Note the Garway-Heath sectors are almost identical between the differing scans. Click image to enlarge. |
In moving forward with management of this patient, he will be scheduled for OCT imaging. When going for imaging, he will receive the following scans: perioptic retinal nerve fiber layer scans, GCL scans, BMO-MRW glaucoma scans and additionally, the neuro profile scans. Note in Figure 6 the symmetry and precision of the standard BMO-MRW scan on the left and the neuro scan on the right. The resolution and image registration of the Spectralis software should make dissecting out future glaucomatous vs. non-glaucomatous change easier to see, ultimately lending to better patient care.
Dr. Fanelli is in private practice in North Carolina and is the founder and director of the Cape Fear Eye Institute in Wilmington, NC. He is chairman of the EyeSki Optometric Conference and the CE in Italy/Europe Conference. He is an adjunct faculty member of PCO, Western U and UAB School of Optometry. He is on advisory boards for Heidelberg Engineering and Glaukos.