 |
|
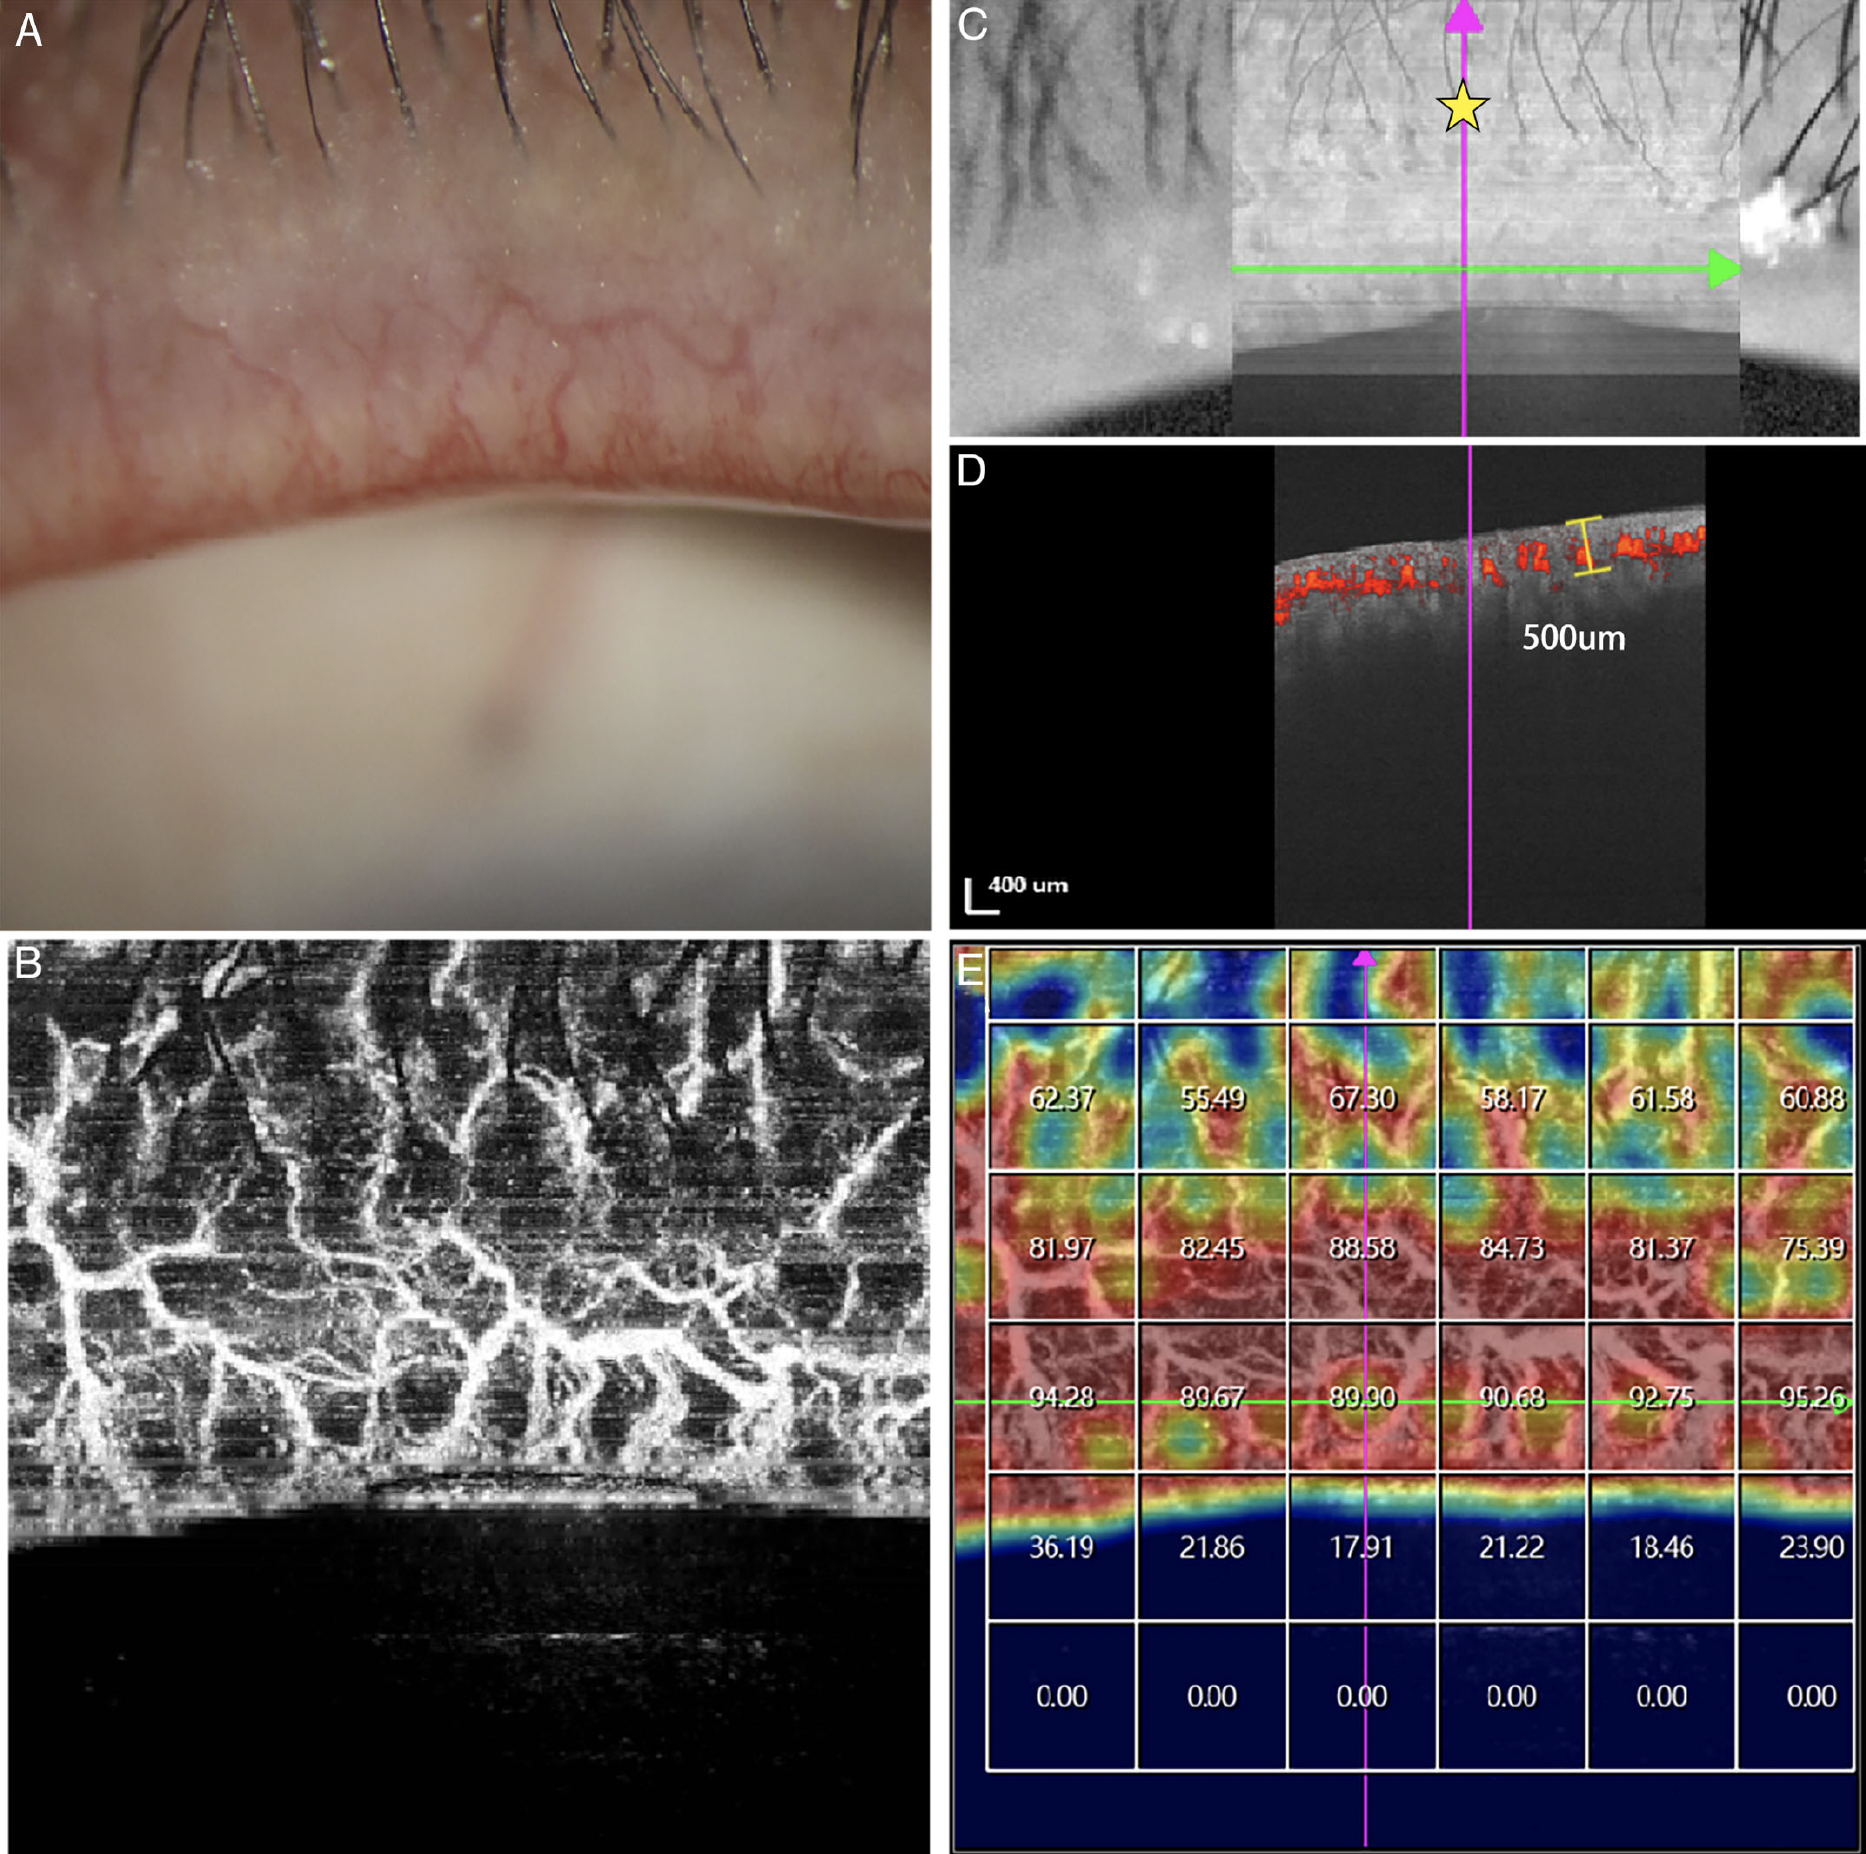
These images from the study show the potential application of swept-source OCT-A measurement of blood flow density in MGD assessment. Fig. (A) shows severe lid margin vascularity by slit-lamp examination. Fig. (B) shows that blood flow by OCT-A was consistent with the blood vessel network. In Fig. (C), the yellow asterisk denotes the site of the analysis center at the palpebral margin below. Fig. (D) provides the measured depth of vascularity (approximately 500μm). Finally, Fig. (E) presents a vascular density map with a 1x1mm grid. Photo: Hu M, et al. Transl Vis Sci Technol. 2024;13(6):6. Click image to enlarge. |
While most optometrists and ophthalmologists can readily assess eyelid margin inflammation by slit lamp exam alone, objective and quantitative indicators could potentially increase precision. Recently, Chinese researchers conducted a prospective study using swept-source OCT angiography (OCT-A) to assess lid margin vascularity. Their results were published in Translational Vision Science & Technology.
Included in the trial was a total of 125 participants: 15 controls and 110 subjects with meibomian gland dysfunction (MGD). OCT-A was used to obtain lid margin blood flow density and this parameter was assessed for repeatability in 54 of the total participants and for reproducibility in 23. Efficacy was also validated in all individuals, with divisions of mild (n=46), moderate (n=42) and severe (n=37) groups made based on lid margin vascularity seen in slit-lamp photos. Other MG-related parameters were analyzed for correlation with LMBFD in all participants, including Ocular Surface Disease Index (OSDI) score, fluorescein tear break-up time (FTBUT), cornea fluorescein staining, lid margin score and MG expressibility.
Coefficients for both repeatability and reproducibility were satisfactorily high with scan areas of 6x6mm and 9x9mm. Blood flow density gradually increased in mild, moderate and severe groups, and it also was significantly correlated with OSDI, FTBUT, fluorescein staining, meibomian gland expressibility and lid margin score.
In their paper, the authors relay that OCT-A quantitatively analyzed blood flow at lid margin while also possessing good repeatability. They also specify that OCT-A did not show depth of measurement, so they used ImageJ software to measure some OCT images, resulting in a depth of blood vessels of about 500μm. The researchers indicate that at this depth, “the blood flow density of the lid margin measured by OCT-A includes not only the blood vessels of the blepharon surface but also the blood vessels of the subcutaneous tissue." Meanwhile, the results of validity analysis showed that the value of blood flow density as measured by OCT-A “was consistent with the severity of the lid margin vasculature shown in the photograph.”
Because of this, they add that “these data support a role for OCT-A as a commercial instrument in evaluating lid margin vascularity” and, based on these results, they suggest that lid margin blood flow density may reflect eyelid inflammation in MGD patients.
Hu M, Wang C, Li Y, et al. Quantitative assessment of lid margin vascularity using swept-source optical coherence tomography angiography. Transl Vis Sci Technol. 2024;13(6):6. |