A profession cannot advance without scientific study and, because of this, we need to be able to easily read and understand new developments within our field. We also need to be able to critically evaluate these advances to determine if they are worthy of incorporating into practice. Medical research and medical practice are very different realms, however, each with its own priorities, strategies and customs. While the typical clinician is exposed to research concepts during their training and throughout their career, some of the terms and concepts used in scientific papers may seem like a distant memory; thus, the purpose of this article is to provide clinicians with a quick reference that describes key clinical research terms and concepts so that they can more easily digest the vast body of medical knowledge.
This article is part 1 of a four-part series Review of Optometry is publishing on the role of medical research in guiding our clinical decisions. This month, we will share straightforward definitions of the workhorse terms used in medical studies. Part 2 will build on this foundation to teach critical analysis of research findings. Part 3 will canvass experts for their opinions on the lasting value of the landmark clinical trials in eye care. Part 4 will delve into the workings of one specific research group so that we can see how tomorrow’s insights are being worked on today. The overarching goal is to equip busy optometrists with the capacity to read, understand and apply medical research in their practices.
Study Designs
A first step toward deciphering a clinical study is to understand its design, as this choice both empowers and constrains the researchers in various ways. Most studies can be broadly considered to be either observational or experimental. In the former category, the researchers do not control the data that’s collected in any way other than by making a choice to study a group with certain characteristics—myopes under age 10 or non-smokers over age 60, for instance. Examples of observational studies include cohort study, case-control study and cross-sectional study. By contrast, studies that use an experimental design set inclusion and exclusion criteria and aim to measure a specific exposure (e.g., a medical therapy or risk factor) and the researchers set one or more primary outcomes and secondary outcomes that would define success or failure.
 |
|
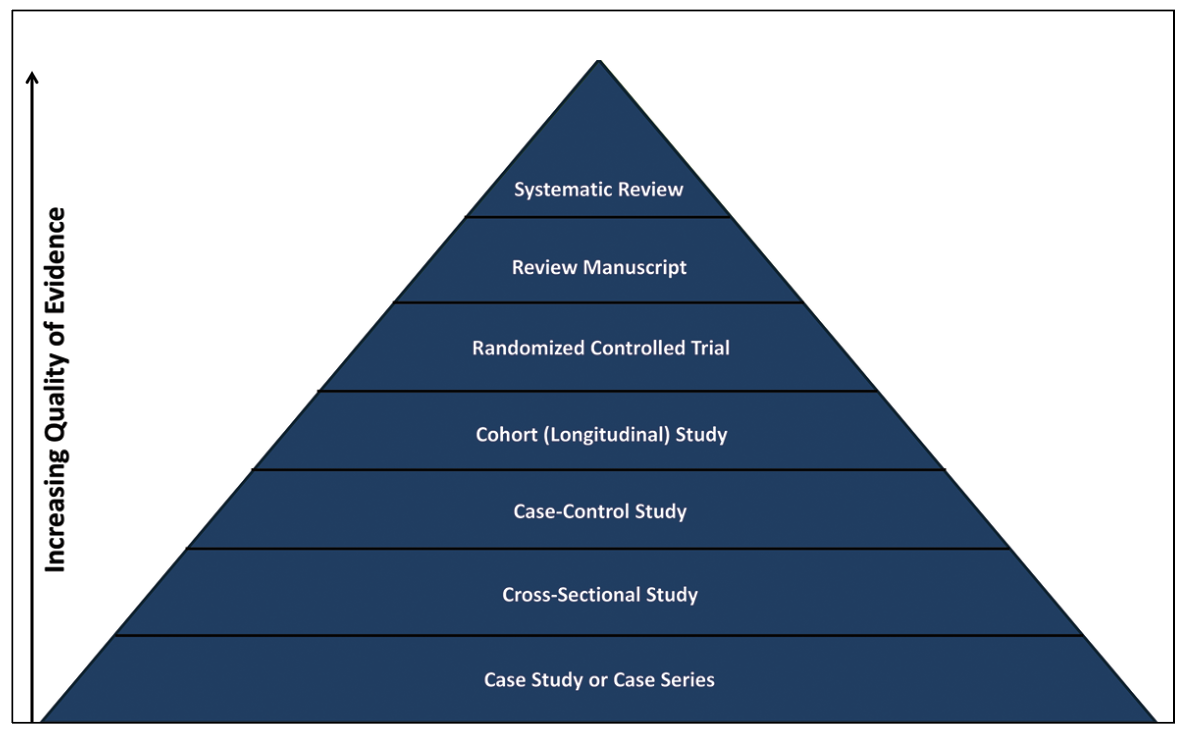
Not all studies merit equal consideration by clinicians, nor are they necessarily intended to by their authors. Bear in mind the hierarchy shown here. Click image to enlarge. |
Below are the most common types of study designs, ordered from least complex/lowest level of evidence to most complex/highest level of evidence.
Case Study: A report on an individual patient.1 Case reports are only descriptive of that patient’s condition.2 With regards to advancing clinical research, a case report is often the beginning of a scientific understanding of a clinical question, typically by documenting a novel presentation or treatment effect.
Case Series: This is a report on more than one subject and thus has a bit more substance than a single case study, but still lacks the rigor that a formal trial demonstrates. This type of work might involve a chart review to evaluate all potential subjects with an uncommon condition.
Cross-Sectional Study: A study that evaluates all comers within the population of interest at a single timepoint over a finite amount of time.1,2 No causal relationships can be determined from this type of study.2
Case-Control Study: A type of study that compares subjects with a specific condition (e.g., dry eye) to subjects who do not have a condition (e.g., asymptomatic subjects) to determine between-group differences to better understand a condition.1,2 With this type of study, one can only calculate the odds of an association between factors.
Cohort (Longitudinal) Study: A study that enrolls a group of subjects and follows them over an extended period to determine if they develop an outcome and how it may change over time.1,2 This type of study allows one to prove temporal relationships and allow for determination of risk.
Randomized Controlled Trial (RCT): A study that assigns subjects to treatment groups by chance.1,2 Subjects are then compared at the end to determine if there are between-group differences. The randomization is intended to wash out any differences unrelated to the mechanism being evaluated to help avoid confounding factors, such as having the subjects of the treatment group being older than the controls, which might bias the results.
Review Manuscript: A summary of the literature on a specific topic. A review manuscript can serve as a good reference on a topic while also helping the field determine knowledge gaps and future directions for scientific study.
Systematic Review Manuscript: This is a special type of review that first evaluates any publication that might be remotely related to the topic of study. After selecting articles that meet the entry criteria, the authors then collect the predefined clinical data relevant to the topic. When enough data is available, a meta-analysis (mathematical evaluation) can be conducted to determine the current state of the field.
Systemic reviews are typically limited to completed RCTs. A systemic review is often considered the highest level of data, and this effort has been pioneered by the Cochrane Library (www.cochranelibrary.com). Cochrane reviews are typically considered the highest level of systematic reviews, given that they have exceptionally high quality standards.
|
|
Click image to enlarge. |
FDA Trial Phases
The FDA classifies drug trials based upon four different categories. Some are classified as a combination (e.g., Phase I/II) if they contain components of both. The following describes each of the four phases individually:1,3,4
Phase I: This type of trial is aimed at understanding initial safety and drug concentration. These trials tend to be unmasked and have a small number of subjects, who may be healthy or have the indication (disease) of interest. Phase I vision trials tend to have included subjects undergo a short duration of treatment (e.g., one month), and the data obtained are typically used for subsequent trial planning and for fundraising. About 75% of Phase I trials are successful.5
Phase II: These tend to be larger than Phase I trials and they enroll subjects with the indication of interest to understand initial drug safety and efficacy. A Phase II trial may not be adequately powered; however, they yield important data for sample size planning for future trials. Phase II trials likewise are important for selecting primary outcomes for pivotal trials (e.g., what outcomes are mostly likely to improve with the investigational drug) and logistical planning. About 50% of Phase II trials are successful.5
Phase III: The make-or-break moment for a new drug. Phase III trials tend to have hundreds to even thousands of subjects with the indication of interest. These trials are adequately powered to demonstrate safety and efficacy to the FDA. While not always the case, more than one Phase III trial is typically needed before a drug is approved by the FDA. The duration of these trials varies by indication, but some may be a year or longer. About 60% of Phase III trials are successful.5
Phase IV: A product only makes it to market about 20% of the time.5 Once a drug is approved, the FDA may require additional study via a Phase IV trial to gain more safety information. The sponsors may also initiate studies without FDA mandate for marketing purposes. Phase IV trials tend to be large, and they may run for an extended duration (e.g., >1 year) depending upon the indication.
 |
|
Click image to enlarge. |
Glossary of Terms
The next step in being a critical reviewer of the literature is understanding the terms commonly used to describe clinical parameters and the statistical analysis used in the scientific community. While this glossary is not a complete list, it does cover the commonly encountered research terms.
Alpha (α): Also known as the level of significance or margin of error.1 A typical alpha value for a vision trial is 0.05, which means that there is a 5% or one in 20 chance that a study will find a significant association by chance alone; said another way, there is only a 5% chance the study will erroneously show a significant result. The confidence level is defined as 1-α or, in this case, 95%.
The closely related concept of confidence interval describes the minimum and maximum thresholds within which you would expect to find the mean value of the sample. The level of significance is sometimes adjusted downward (closer to zero) to adjust for multiple comparisons (several statistical tests) because increased testing increases the chance of erroneous findings. If the p-value (probability value) is lower than the alpha value, the finding can be said to have statistical significance.
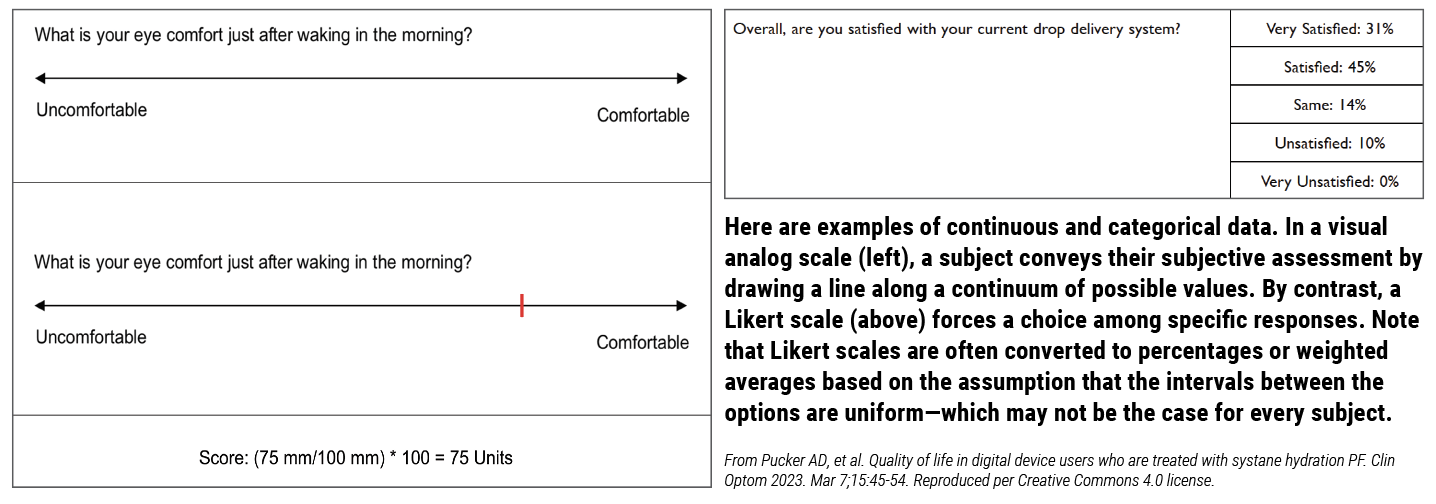
Categorical Data: A variable that only has a finite number of response options, which may not have even intervals between the potential choices.1 A good example of this in vision research is a questionnaire that asks subjects to indicate if they strongly agree, agree, have no preference, disagree or strongly disagree with a question. With this sort of question, the difference between each level is subjective (varies by subject’s interpretation). One person may judge strongly agree to be closer to agree than agree is to no preference, yet these sorts of data are typically reported as percentages even if the relative weights differ for a given subject or between subjects.
Clinically Meaningful Difference: A distinction between groups or circumstances that is large enough for the clinician to be able to detect it in the clinical setting. If we take refractive error as an example, the typical phoropter has 0.25D steps in sphere power. If a study finds a significant difference of 0.12D, this would not be a clinically meaningful difference (no discernible effect on care), given that it is too small to measure on the phoropter.
Continuous Data: A variable that could in theory have limitless potential values. It may be helpful to think of continuous variables as a line of numbers.1 A common continuous variable is a visual analog scale (VAS), which typically has a range of scores anywhere between 0 and 100 units, and a subject can rate their condition by placing a vertical line anywhere along the horizontal VAS line.
Cronbach’s alpha: This evaluates how each questionnaire item is correlated with all the other items in the instrument.6,7 An acceptable Cronbach’s alpha is typically considered to be >0.70 (lower values suggest not measuring a single trait/multidimensionality) and <0.90 (greater values suggest items are redundant).6,7
Effect Size: The size of the between-group difference used in a sample size calculation.1 When discussing clinical studies, this is typically considered the clinically meaningful difference.
Frequency: How often something occurs in a sample of subjects. This term should be used unless a representative sample is evaluated; in that case, the terms incidence or prevalence can be applied.
Generalizability: How applicable the study results are to the population of interest.1 When designing a study, one should try to make it as inclusive as possible to help ensure generalizability (inclusion criteria), yet certain groups of subjects are typically excluded (exclusion criteria) because they could confound the study results.
Incidence: The rate by which new cases of a condition occur over a specific time, which in clinical research is typically within the past year.1 If the term incidence is used, the sample must be representative (people included in the study should mirror the population of interest). If not, the term frequency should be used.
Intention-to-Treat (ITT): An analysis approach used in randomized trials wherein subjects are analyzed based on the group they were originally assigned to at the time of randomization even if they got a treatment different than intended, were shown to be nonadherent to the study protocol or otherwise deviated from instructions. 1 In this way, ITT reflects real-world circumstances and reduces the risk of overestimating the statistical significance of the findings.
Interquartile Range: A value that reflects the central 50% of a dataset, calculated by adding the 2nd and 3rd quartiles but excluding the 1st and 4th.8 Interquartile range is typically reported with medians and is sometimes a better representation of data that has the potential to be skewed by outliers (e.g., billionaires skew the average net worth of a population).
Intra/Inter-class Correlation Coefficient: These describe the repeatability of a continuous variable on a scale of 0 to 1.7 A value of >0.70 is recommended to discriminate between groups and one of >0.90 is recommended to discriminate between individual participants within a group.7
Intra-Subject and Test-Test Repeatability: These describe how similarly one subject or measurement provides the same test score on two different occasions under the same circumstances.9
Investigator-Developed Questionnaire: An instrument created by subject matter experts to gather general data about a topic. These questionnaires are not typically psychometrically validated, which is not of great concern because they are usually used to gather valuable patient-reported outcomes that can help guide clinical practice or patient education. These instruments are not suitable for diagnosing a condition or tracking disease progression.
Likert Scale: A type of questionnaire with qualitative response options, typically reported as percentages.1 An example of a Likert scale is when a subject is asked if they strongly agree, agree, have no preference, disagree or strongly disagree with a question.
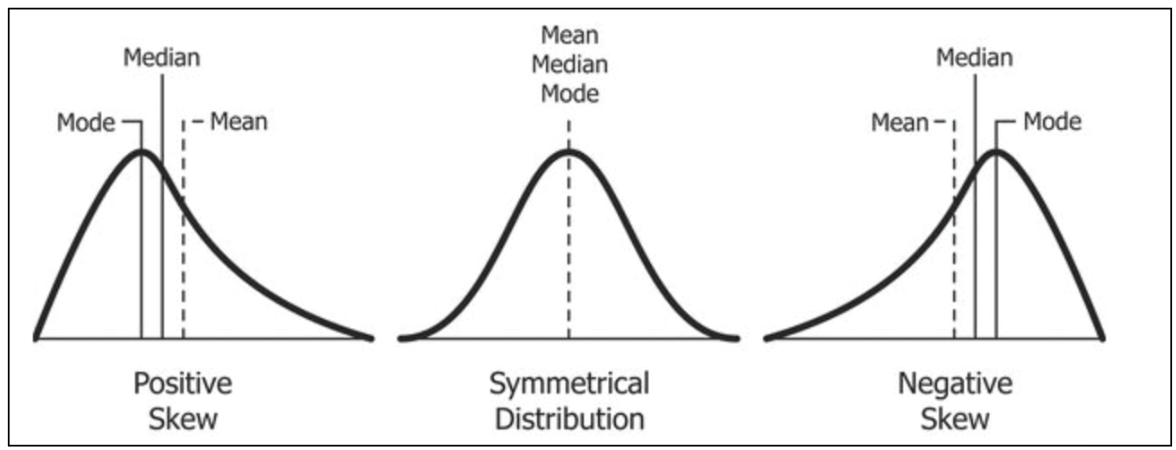 |
| The mean, median and mode values are identical when study data are symmetrically distributed along a classic bell curve. Photo: Diva Jain/Wikimedia Commons. Click image to enlarge. |
Mean: The average of a set of numbers.8 Like median, it is a measure of central tendency. It should be used when the data are normally distributed.
Median: The middle number of a set.8 It is a measure of central tendency and it is less affected by outliers; thus, it should be used when the data are not normally distributed.
Normal Distribution: A pattern in which continuous data follow a bell-shaped curve where the likelihood of a value occurring decreases as it moves away from the center number.
Paired Comparison: In clinical research, this is when a comparison is made within the same subject.8 Performing comparisons within the same subjects typically results in decreased variability and the need for fewer subjects in a study compared to comparisons between subjects.
Person-Separation Index: This evaluates measurement precision—the ability to discriminate between subjects with different amounts of a trait. A value >2.0 is considered to be acceptable.6,7,10
Prevalence: The proportion of people within a defined population who have a specific condition.1 For the term prevalence to be appropriate, the sample being used must be representative (i.e., people included in the study should mirror the population of interest). If the population is not fully represented, the term frequency should be used.
Principal Components Analysis: In a Rasch analysis, this is a statistical approach for determining if the questionnaire is unidimensional (measuring a single trait). A value >2.0 suggests multidimensionality (measuring more than one trait), which is not ideal for a questionnaire aimed at quantifying a specific trait (e.g., dry eye symptoms).10
Rasch Analysis: A statistical approach for testing the psychometric properties (ability to measure a trait) of a questionnaire with categorical items.6,7
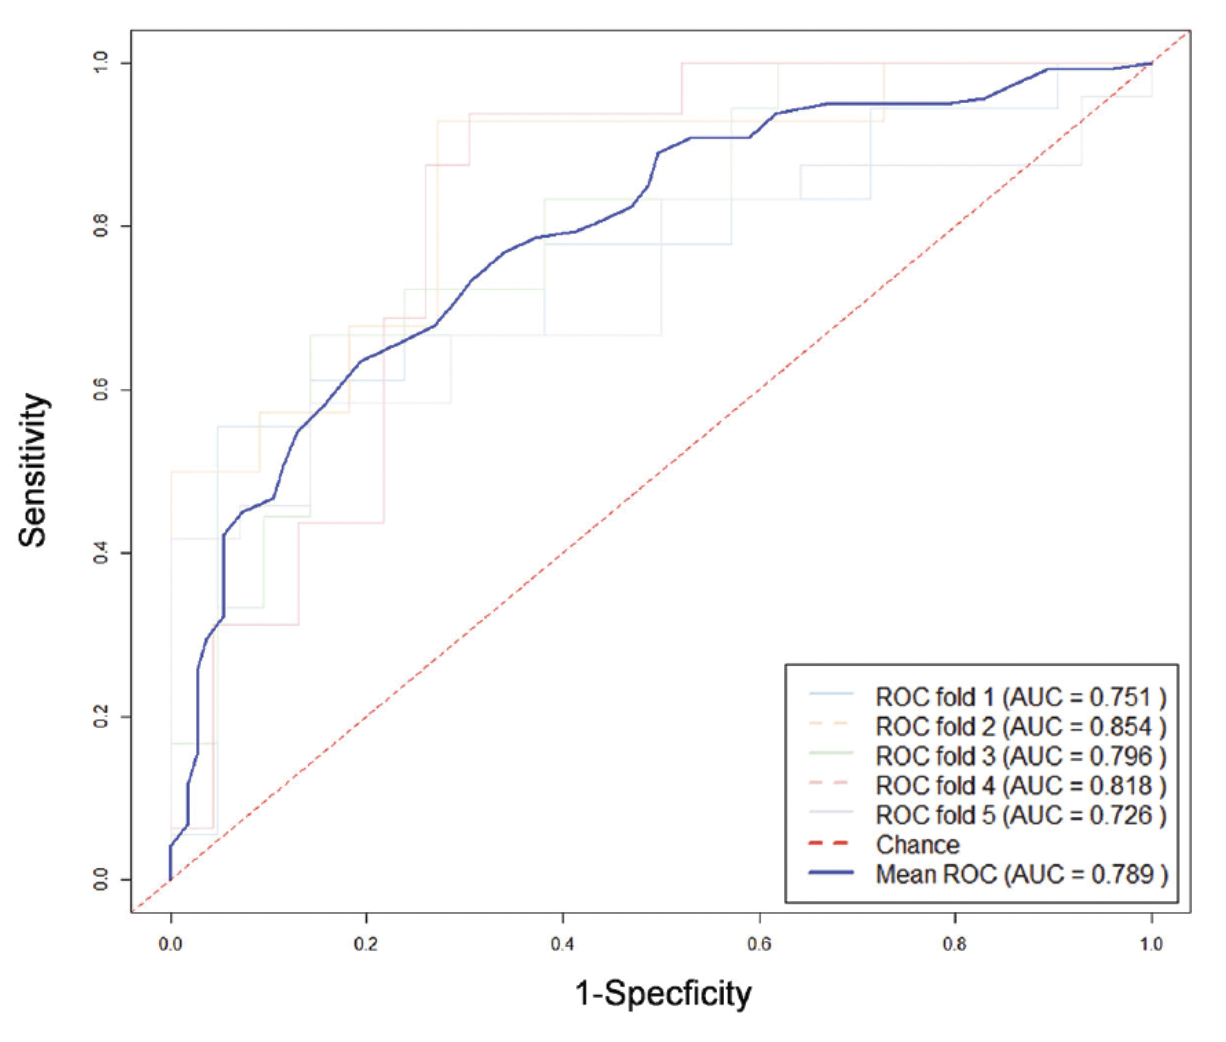 |
| ROC curves are a staple of medical research. This one appeared in a recent issue of IOVS, in a study exploring the relationship between visual field defects and high myopia. Do such defects occur by chance in these patients? No, says this analysis.The diagonal red line in an ROC curve represents pure chance. Anything above it shows an association. The area under the curve (AUC) value quantifies the strength of the association, with 1.00 being perfect and 0.50 being purely random. From Li C, et al. Long-term prediction and risk factors for incident visual field defect in nonpathologic high myopia. Invest Ophthalmol Vis Sci. 2024;65(10):43. Reproduced per Creative Commons 4.0 license. Click image to enlarge. |
Receiver Operating Characteristic (ROC) Curve: This is a statistical approach used for balancing the sensitivity and specificity of a measure to determine a cut-point between normal and abnormal subjects.11 An area under the curve (AUC) value obtained from this approach of 0.50 has no ability to differentiate between having a condition and not, while a value of 1.00 indicates a perfect ability to differentiate between them.11
Sample Size: The number of subjects needed in a study to correctly determine if a significant difference in a comparison can be determined.1 When sample size calculations are performed, they typically yield the number of subjects needed per group. The sample size for a study is typically only calculated for the primary outcome or for key outcomes.
Sensitivity: How likely one can detect a condition in an individual using a test (in percentage).12
Specificity: How likely one can rule out a condition in an individual using a test (in percentage).12
Standard Deviation: A measure of variability from the mean value for a continuous variable.1 Higher numbers indicate a greater spread of the data and hence more randomness to the association being studied.
Statistical Power: The probability of finding a non-random correlation in the data and thus rejecting the null hypothesis (i.e., a presumption of no effect) if the effect size in the population is equal to or greater than the study’s prespecified effect size.1 If, for example, a study uses a power of 80%, which is common in medical science, this means it would correctly reject the null hypothesis 80% of the time. When discussing power, the term beta (β) is sometimes mentioned.1 Beta is the probability of failing to reject the null hypothesis when it is false. Power is calculated by subtracting beta from 100 (e.g., 100-20=80% power).
Statistically Significant Difference: This formal term can be said to be present when there is a mathematical relationship between variables.8 The phrase can sometimes be misconstrued to suggest the more colloquial use of the word significant. However, as a matter of statistics, all it means is that the p-value of the results is less than the alpha (also called the level of significance). This relationship may or may not be a clinically meaningful difference.
 |
| Click image to enlarge. |
Unpaired Comparison: In clinical research, this is typically when a comparison is made between two different subjects.8 Comparing different subjects typically results in increased variability compared to comparisons within a subject.
Validated Questionnaire: An instrument that has undergone psychometric testing (e.g., Rasch analysis) to ensure that it is evaluating the desired trait.6
Sample Sizes
The concept of sample size is worth dwelling on for a moment. While there are multiple ways to determine a sample size, which are based upon the type of data being evaluated and the desired study outcomes, the most common method used in vision studies involves calculating paired or unpaired superiority sample sizes for continuous data to determine the number of subjects who should be enrolled to demonstrate if there is no association found. This is an important distinction because once an outcome reaches statistical significance, the significance typically only gets stronger with more subjects, assuming that the analysis was done with a sample size in the parametric statistics range (roughly a normal distribution of values with >20 subjects).
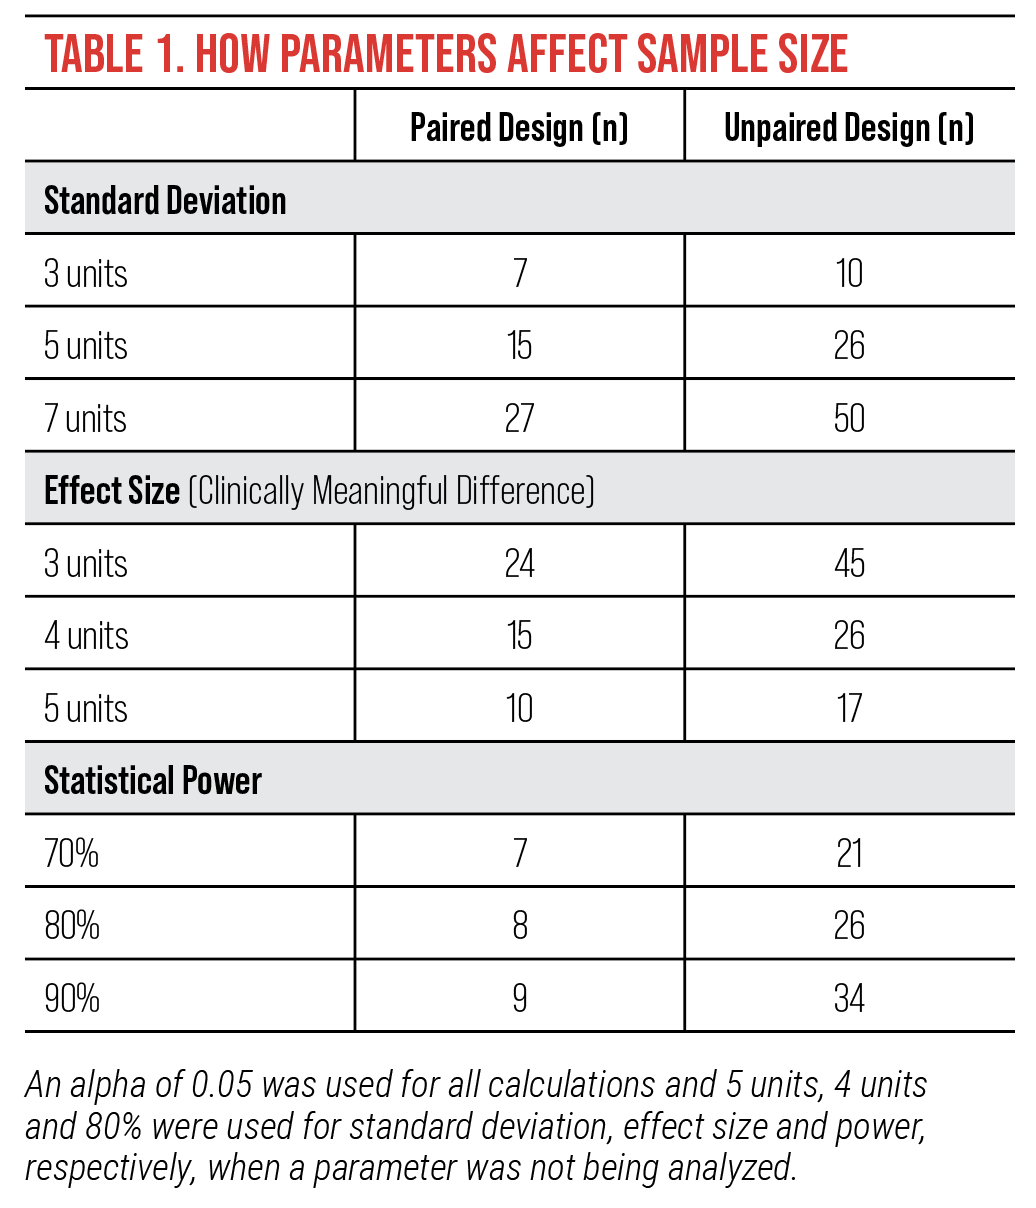
Table 1 demonstrates by example how sample size can vary wildly by the factors included in the calculation. The example specifically uses Standard Patient Evaluation of Eye Dryness Questionnaire data (score range=0-28 units), a common dry eye symptoms questionnaire, which has a published clinically meaningful difference of 4 units.10,13
This example highlights that smaller sample sizes are calculated with smaller standard deviations, larger effect sizes, less power and paired designs, yet the more power you include in the calculation, the more likely your results will represent the true result.
Commonly Confused Terms• Adverse event (AE) vs. serious adverse event (SAE) vs. side effect: FDA trials typically define an AE as any untoward medical occurrence in a clinical trial subject that is temporally associated with the use of study intervention. An AE does not need to be related to the study treatment to be considered one. An AE reaches the level of SAE when it meets specific criteria such as death or elevated mortality risk. The severity of an event is graded (mild, moderate, severe) based upon how big of an impact the event has on daily activities. The term side effect is more broad than AE or SAE and, strictly speaking, does not always connotate a negative consequence. When Allergan received reports of eyelash growth as a side effect of Lumigan use, it spun that off into its own indication for the cosmetic product Latisse. • Vehicle-controlled vs. placebo-controlled vs. comparator-controlled studies: A vehicle is a control treatment that is the same as the active treatment, just without the active drug present. A placebo is a general, inert substance that is not thought to have any treatment effect (e.g., saline drops). A comparator control is an active treatment, which is typically the standard of care. Comparator controls are typically used when it is determined that it is unethical to withhold treatment from a subject. • Parallel assignment vs. crossover study: A parallel group study is when a subject is assigned a treatment and they stay on that same treatment until the end of the trial, while a crossover study is when a subject enters a study on one treatment and switches to another at a defined point in the trial. A crossover study design allows investigators to see how an individual subject will respond to more than one treatment (less subject variability), yet crossover studies are not typically used because it is challenging to determine if the first treatment has a spillover effect into the next study phase (e.g., delayed appearance of an adverse event). • Primary outcomes vs. secondary outcomes: The primary outcome is the main question of the trial (e.g., will drug X treat sign Y). The primary outcome is key to trial planning (e.g., sample size, study duration). Secondary outcomes are other key signs or symptoms evaluated in a trial. Exploratory outcomes are also sometimes included to help gather information for future trials or marketing purposes. While rare, a drug can get approved by the FDA even if a trial fails to meet its primary outcome if the results of a secondary outcome are compelling enough to affect clinical practice.14 The FDA may likewise approve a drug if a trial fails to meet its primary outcome if there is compelling data from a companion trial. • Confidence interval (CI) vs. standard deviation (SD): These both describe the spread of data. A CI is a measure of variability for non-parametric data (non-normally distributed data) while SD is a measure of variability for parametric data (normally distributed data). • Odds ratio (OR) vs. relative risk (RR) vs. hazard ratio (HR): All of these describe the chance of seeing a disease in those exposed to a risk factor. They differ in that an odds ratio describes associations between an intervention and risk while relative risk describes how an intervention changes risk.1,5 Similarly to RR, a hazard ratio also describes how an intervention changes the rate of an event happening but it is a measure of rate of change within two groups, whereas relative risk is a calculation of risk in a single population.15 HR deals with rates over time, providing insights into the timing of events, while OR and RR both describe cumulative risk over the duration of the study.5 OR is typically used in case-control studies, RR in cohort studies and randomized controlled trials, and HR in survival analysis and time-to-event studies. |
Conclusion
As clinicians, it is imperative that we regularly review new research as it becomes available so that we can bring the best and newest treatments to our patients. To that end, we not only need to read the most recent research but fully understand and critically evaluate it to determine if new developments merit incorporation into our practice. While the above information is not a comprehensive lexicon of clinical research, it does provide you with the tools to help you become a more critical reviewer.
Dr. Pucker is the executive director of clinical and medical sciences at Lexitas Pharma Services. He earned his OD, MS and PhD degrees from The Ohio State University. His independent research and clinical career have focused on dry eye disease, contact lenses and myopia development. Dr. Pucker is a Fellow and Diplomate of the American Academy of Optometry, Fellow of the Scleral Lens Education Society and Fellow of the British Contact Lens Association.
1. Hulley SB, Cummings SR, Browner WS, Grady DG, Newman TB. Designing Clinical Research. 4th ed. LWW. 2013. 2. Ranganathan P. Understanding research study designs. Indian J Crit Care Med 2019;23(Suppl 4):S305-7. 3. U.S. Food & Drug Administration. Step 3: Clinical research. 2018. www.fda.gov/patients/drug-development-process/step-3-clinical-research. 4. Pucker AD, Derthick N, Scott L. Running the enrollment numbers on ophthalmic clinical trials in the united states. Optom Vis Sci 2024:In press. 5. Takebe T, Imai R, Ono S. The current status of drug discovery and development as originated in united states academia: The influence of industrial and academic collaboration on drug discovery and development. Clin Transl Sci 2018;11:597-606. 6. Pesudovs K, Burr JM, Harley C, Elliott DB. The development, assessment, and selection of questionnaires. Optom Vis Sci 2007;84(8):663-74. 7. Nichols KK, Mitchell GL, Zadnik K. The repeatability of clinical measurements of dry eye. Cornea 2004;23:272-85. 8. Pagano M, Gauvreau K. Principles of biostatistics, 2nd ed. Duxbury Press. 2000. 9. Powell DR, Nichols JJ, Nichols KK. Inter-examiner reliability in meibomian gland dysfunction assessment. Invest Ophthalmol Vis Sci 2012;53(6):3120-5. 10. Pucker AD, Dougherty BE, Jones-Jordan LA, et al. Psychometric analysis of the SPEED questionnaire and CLDEQ-8. Invest Ophthalmol Vis Sci 2018;59(8):3307-13. 11. Gothwal VK, Pesudovs K, Wright TA, et al. McMonnies questionnaire: enhancing screning for dry eye syndromes with Rasch analysis. Invest Ophthalmol Vis Sci 2010;51(3):1401-7. 12. Farris RL, Gilbard JP, Stuchell RN, et al. Diagnostic tests in keratoconjunctivitis sicca. CLAO J 1983;9(1):23-8. 13. Asiedu K, Kyei S, Mensah SN, et al. Ocular surface disease index (OSDI) versus the standard patient evaluation of eye dryness (SPEED): a study of a nonclinical sample. Cornea 2016;35(2):175-80. 14. Pocock SJ, Stone GW. The primary outcome fails - what next? N Engl J Med 2016;375(9):861-70. 15. George A, Stead TS, Ganti L. What’s the risk: differentiating risk ratios, odds ratios, and hazard ratios? Cureus 2020;12(8):e10047. |