Retina Takes the StageExperts offer pearls for detecting and managing numerous posterior segment conditions in the June 2024 issue of Review of Optometry, our 15th annual Retina Report. Check out the other articles featured in this issue:
|
In the past, the primary question eyecare clinicians sought to answer when evaluating a patient with age-related macular degeneration (AMD) was, “Is it dry or wet?” When using OCT to assess patients back then, we were mostly focused on detecting subretinal or intraretinal fluid—the telltale sign that a patient converted from dry to wet AMD—which would necessitate an urgent referral to a retina specialist for treatment with intravitreal anti-VEGF. However, with advancements in OCT, as well as increased knowledge about the natural history of AMD and geographic atrophy (GA), we now know of other, more subtle findings on OCT that can help us characterize a patient’s risk of progressing to advanced AMD. Furthermore, the “dry vs. wet” conceptualization is overly simplistic and should be replaced by a more nuanced understanding of AMD.
In screening for this disease, we also must consider that GA (advanced dry AMD) and macular neovascularization (MNV; neovascular AMD) can coexist. This has shown to be more evident in histologic vs. clinical examination.1 One study using histological examination found that 22 eyes of 63 patients with clinical bilateral choroidal neovascularization (CNV) also had areas of retinal pigment epithelium (RPE) atrophy (GA), and another found that 86 eyes of 760 with a pre-mortem diagnosis of AMD demonstrated both CNV and RPE atrophy.2,3 These studies verify that coexistence of MNV and GA is not uncommon in eyes with AMD, which may require a shift in the management approach.
In this article, we will discuss how to properly stage macular degeneration and identify biomarkers for dry AMD on OCT. Additionally, we also highlight some new findings in neovascular AMD that may hold predictive value.
AMD Grading Scales
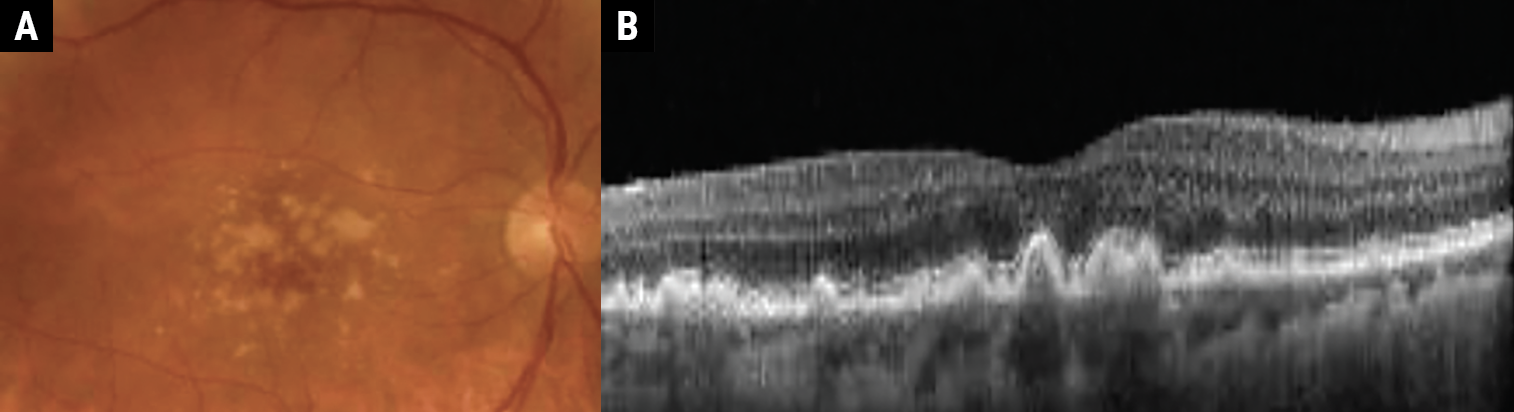
Taking it back to the basics, the hallmark sign of AMD is drusen, which are yellow-white deposits of extracellular debris between the basal lamina of the RPE and Bruch’s membrane. Drusen size was used in the original AREDS study to stage AMD into one of four categories (Figures 1a, 1b, 2a and 2b):4
- Category 1: Early AMD characterized by fewer than five small drusen, each below 63µm in size.
- Category 2: Mild AMD defined as multiple small drusen, a single intermediate-sized drusen from 63µm to 124µm or RPE changes.
- Category 3: Moderate AMD characterized by one large drusen greater than 125µm, extensive intermediate drusen or GA non-centrally.
- Category 4: Advanced AMD defined as more than one large drusen or GA centrally.
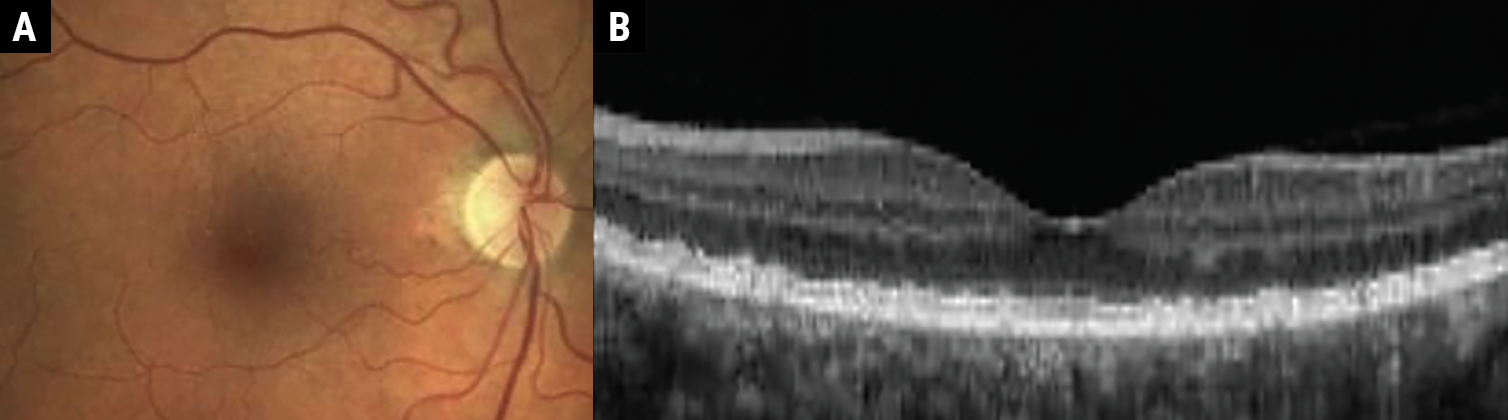 |
Fig. 1a-b. Early AMD characterized by medium-sized drusen (63μm to 125μm). Click image to enlarge. |
 |
|
Fig. 2a-b. Intermediate AMD demonstrating large-sized drusen (>125μm). Click image to enlarge. |
An AREDS simplified scale is also in wide clinical use. In this system, each eye is assigned one risk factor for the presence of one or more large drusen and one risk factor for the presence of any pigment abnormality. Risk factors are added up for both eyes and graded on a five-step scale (0-4). The advantage of this system is that the five-year risk of developing advanced AMD in at least one eye correlates with an easily remembered sequence (Table 1): zero factors, 0.5%; one factor, 3%; two factors, 12%; three factors, 25%; and four factors, 50%.5
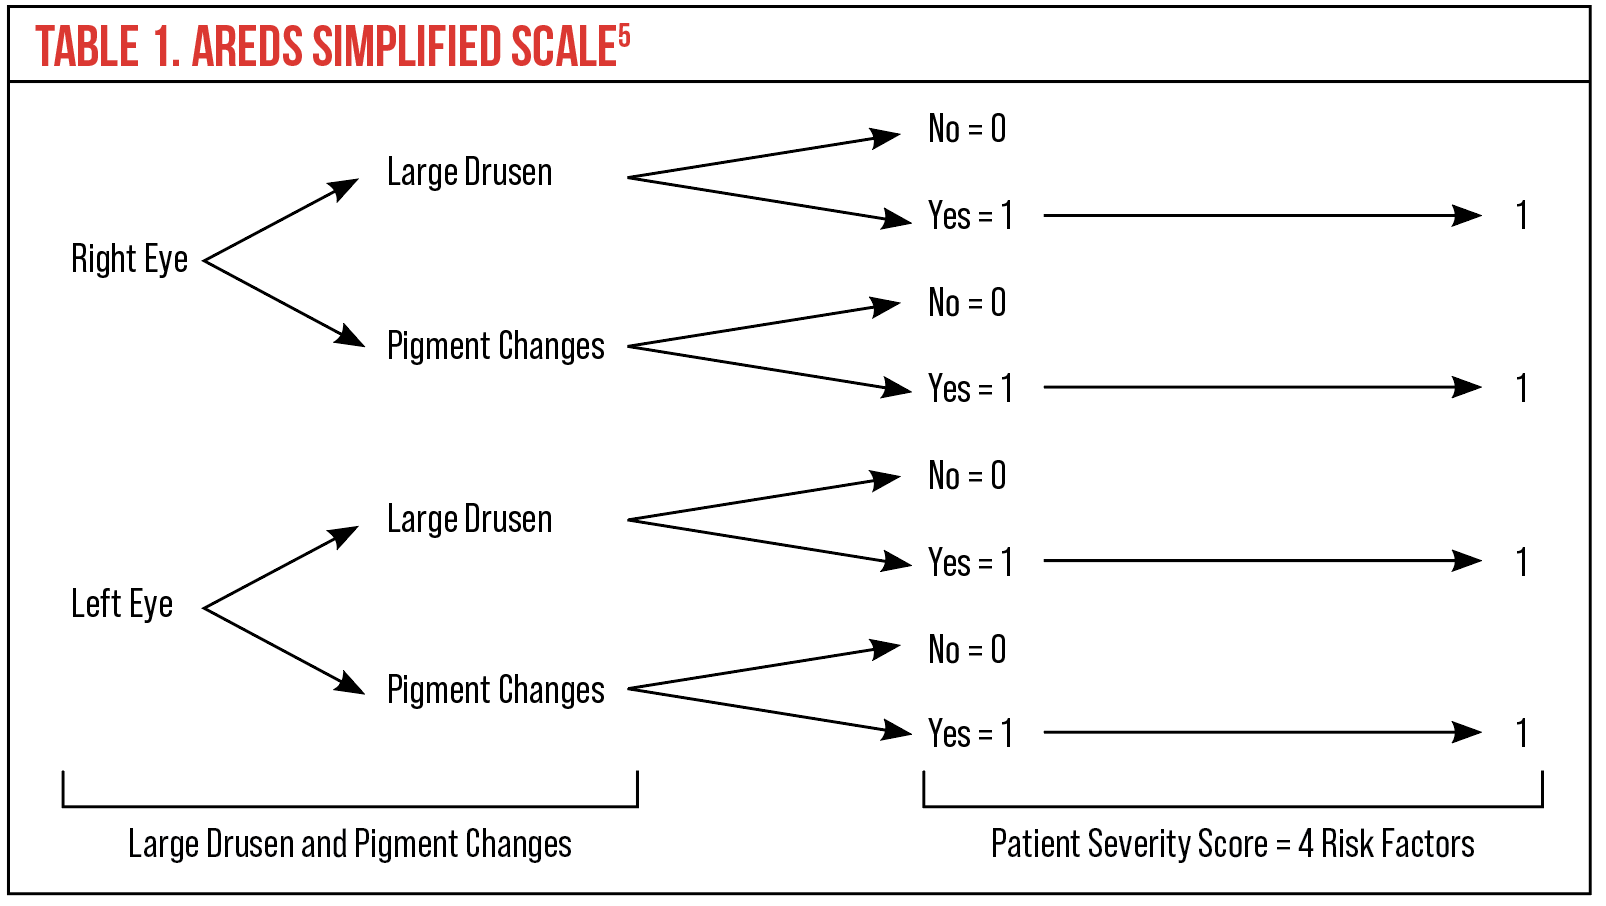 |
| Click table to enlarge. |
Many eyecare providers prefer the Beckman Classification System, developed in 2013, which requires only a clinical examination or color fundus images to classify AMD. This system has five stages, ranging from no apparent aging changes to late AMD, based primarily on drusen size and pigmentary changes (Table 2).6
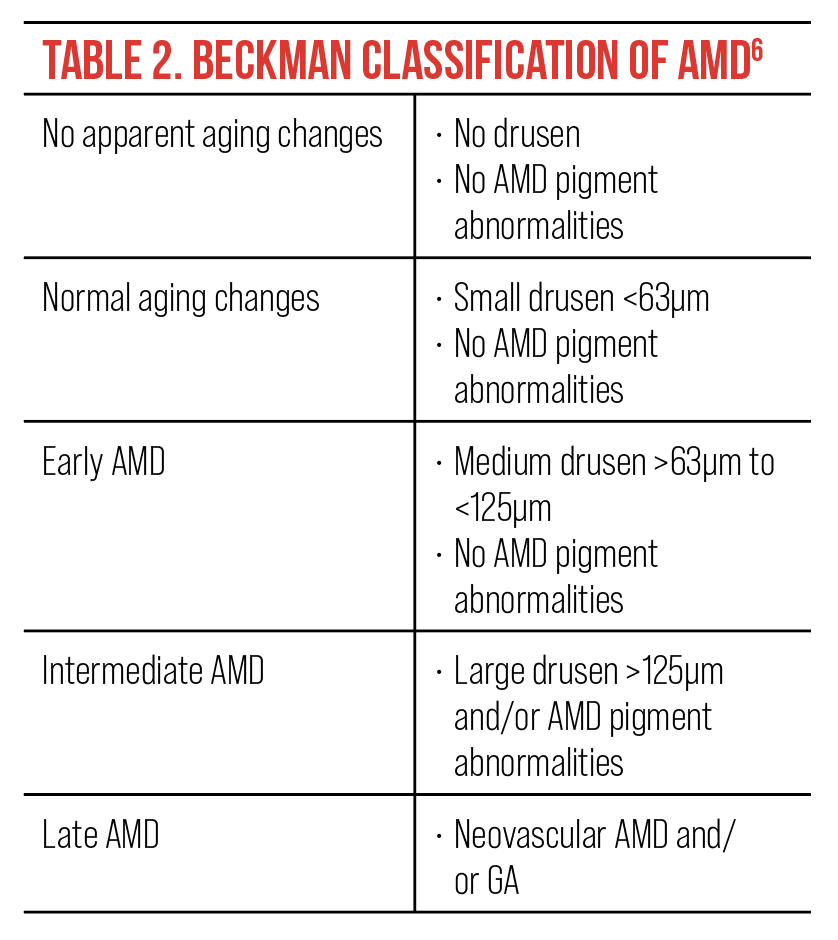 |
| Click image to enlarge. |
Drusen
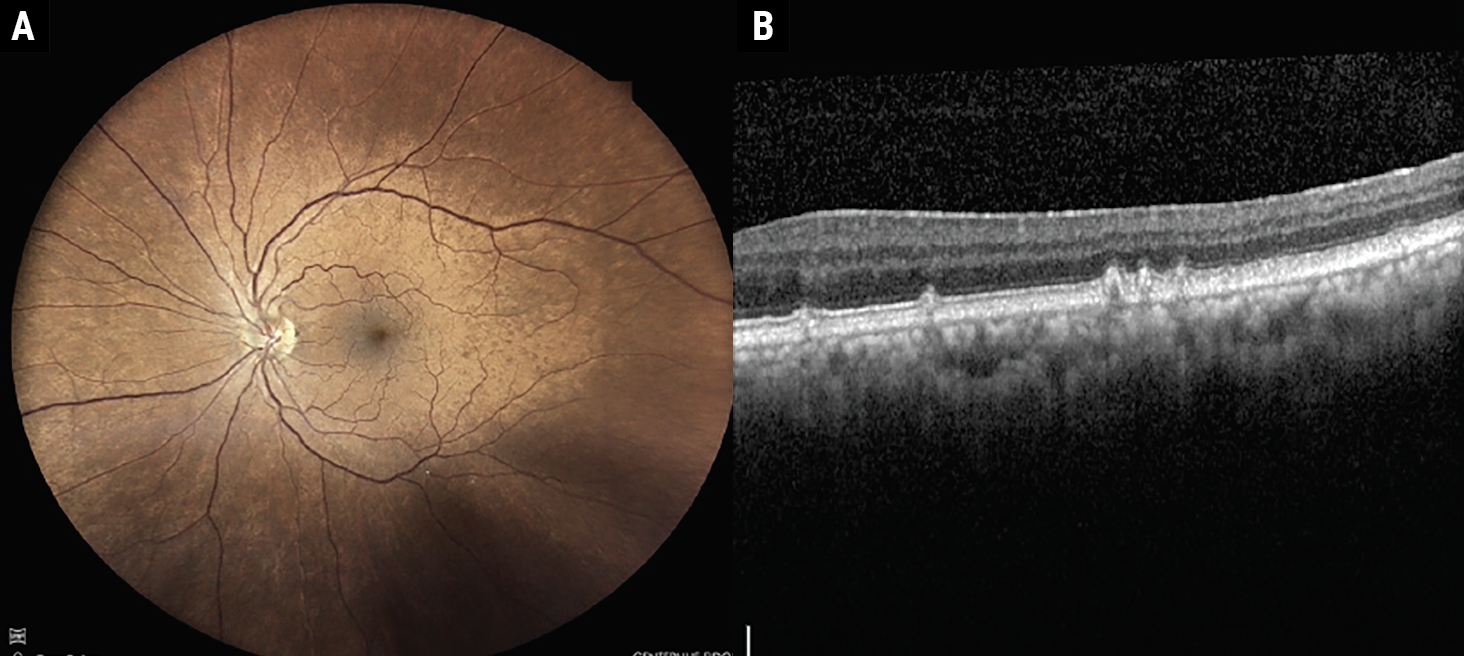
There are several different types of drusen defined within the literature. Hard drusen appear as round, discrete, yellow-white spots, typically measure less than 63µm and are present in approximately 80% of the population, thought to be a physiological sign of aging. Soft drusen appear more ill-defined with non-discrete borders and typically measure greater than 63µm. Studies show soft drusen affect approximately 26% of people over the age of 70. Cuticular drusen are small in diameter (typically 50µm to 75µm), yellow, triangular deposits below the RPE, often with a saw-tooth appearance (Figures 3a and 3b).7,8
Early studies evaluating color fundus photos of drusen have given some insight into important risk factors for progression to advanced AMD. These studies concluded that large, soft confluent drusen as well as pigmentary abnormalities relay higher risk. Fellow eye status to predict risk in the second eye is also important. Therefore, early risk calculators have used drusen size, the presence or absence of pigment abnormalities, as well as fellow eye status to convey risk of progression to advanced disease.5
 |
|
Fig. 3a-b. Fundus photo and OCT demonstrating cuticular drusen. Click image to enlarge. |
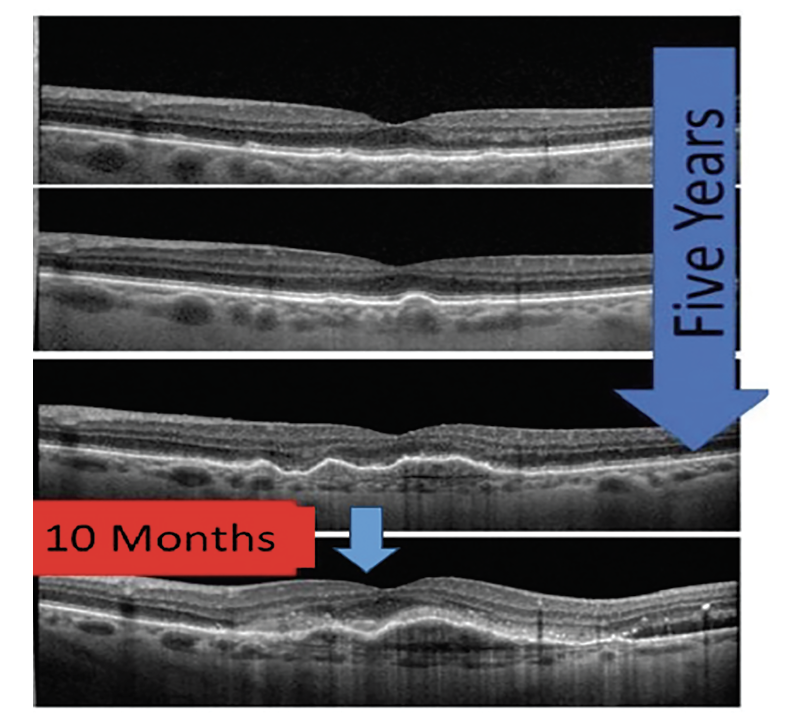
Newer studies have evaluated several additional drusen characteristics associated with increased risk. Drusen volume/area, drusen height and drusen length have all been associated with increased risk of progression to advanced AMD. Increased drusen volume has been associated with increased risk to either neovascular AMD or GA, while increase in drusen height has been associated with progression to atrophic AMD. Lastly, drusen length appears to have a positive correlation with increased risk of conversion to neovascular AMD.9-11 Although in early AMD these changes may be slow, once drusen volume reaches 0.03mm3 the risk of developing late AMD is four-times higher when compared to those with smaller drusen (Figure 4).12
 |
|
Fig. 4. This series of OCT images demonstrates slow progression of AMD from early to intermediate over five years; however, with increased drusen volume and development of pigment epithelial detachments, the patient converted from dry to neovascular AMD in less than a year. Click image to enlarge. |
Drusen regression—that is, the disappearance of drusen—is also a risk factor for progression to advanced disease. The AREDS study reported that 82% of eyes that developed significant atrophic changes had preceding drusen regression. Other studies revealed that in patients with early to intermediate disease, drusen regression occurred in 44% of eyes and preceded advanced AMD, including both GA and neovascular AMD.13
Reticular Pseudodrusen
Also called subretinal drusenoid deposits, reticular pseudodrusen (RPD) are subretinal, granular, hyperreflective material above the RPE. They are often located in the superior macula or close to the superotemporal arcades. On OCT, they have a specific growth pattern characterized by invasion into the ellipsoid zone followed by regression. RPD are best appreciated on infrared reflectance or spectral domain OCT and perhaps worst visualized with color fundus photography (Figure 5).14
 |
|
Fig. 5. OCT showing subretinal drusenoid deposits, also known as reticular pseudodrusen. Click image to enlarge. |
RPD are found to be present in higher numbers in patients with AMD, present in 4.6% of eyes with no AMD, 13.0% in early AMD, 62.6% with intermediate AMD, 34.6% with atrophic AMD and 8.1% with wet AMD. Further, these studies reveal that presence of RPD is associated with an additional two- to sixfold increased risk of progression to neovascular AMD or central GA, with the risk even higher for RPD located outside the macula.15
Hyperreflective Foci
 |
|
Fig. 6. Hyperreflective foci on OCT. Click image to enlarge. |
These appear as well-defined lesions within the neurosensory retina on OCT. They can appear as solitary lesions approximately 20µm to 40µm in diameter or in clusters. Their exact pathogenesis is somewhat debatable, although most researchers now believe they represent anteriorly migrating RPE cells as well as possible disaggregated photoreceptors (Figure 6).16-18
Whatever their exact pathogenesis, hyperreflective foci are considered a strong predictor of AMD progression. The AREDS 2 study revealed that patients with hyperreflective foci at baseline have a fivefold increased risk of progression to GA at two years compared with controls. Correlation with neovascular AMD is not as well demonstrated.19
Hyperreflective foci within drusen may also increase the risk for atrophy. It is theorized that this represents increased heterogeneity of the internal drusen structure and may represent softening of the drusen. This internal softening may lead to a greater likelihood of collapse and progression to atrophy.20
Hyper-transmission Defects
GA is an advanced form of dry AMD that results in progressive and irreversible loss of all retinal tissues, including the photoreceptors, RPE and choriocapillaris. An OCT feature that is seen in patients with GA is hyper-transmission defects. These defects appear as bright regions in the choroid due to increased penetrance of light secondary to missing RPE and other retinal layers. Other terms for these defects—including waterfall, barcode or sub-RPE illumination—have fallen out of favor due to the preferred term of hyper-transmission. Researchers have found that these defects are seen as patients progress from intermediate to late-stage GA (Figure 7).21
 |
|
Fig. 7. Hyper-transmission defect on OCT. Click image to enlarge. |
Based on OCT findings, GA can be classified as either incomplete RPE and outer retinal atrophy (iRORA), which describes partial atrophic loss of the ellipsoid and interdigitation zones as well as the RPE monolayer, or complete RPE and outer retinal atrophy (cRORA), describing a total loss of photoreceptors and the RPE.22
Subsidence
 |
|
Fig. 8. Subsidence from collapsed drusen. Click image to enlarge. |
Another feature that may predict advancing GA is subsidence of the inner nuclear layer and outer plexiform layer, with or without a hyporeflective wedge within the outer plexiform layer. Both these signs indicate a loss of the preceptor layers and precede the development of frank GA (Figure 8).23
Fundus Autofluorescence (FAF)
This noninvasive imaging technique has been shown to be helpful in the diagnosis and management of a myriad of retinal diseases, most notably GA. FAF uses a series of various filters and wavelengths to look for lipofuscin, a byproduct of retinal cell death that is found in many age-related eye diseases, such as GA.24 This provides a very useful tool to look for areas of atrophy, which will appear hypofluorescent or dark, as well as hyperfluorescent areas, typically on the border of the GA lesion, which indicates an active lesion that may be more likely to progress. Therefore, lesions of atrophy surrounded by a ring of hyperfluorescence should be monitored more closely for lesion growth or referred for treatment with the newer complement inhibitor drugs for GA. New studies are also evaluating different patterns of FAF to see if they hold prognostic value for lesions more likely to progress.25
MNV
This finding is associated with neovascular AMD and used to be commonly referred to as CNV. However, since choroidal neovascular membranes may develop in locations other than the macula, such as in the peripapillary area or peripheral retina, macular neovascular membrane or MNV are more descriptive terms for CNV associated with neovascular AMD. This terminology is also more appropriate in neovascular AMD since the neovascularization does not always originate from the choroid.26
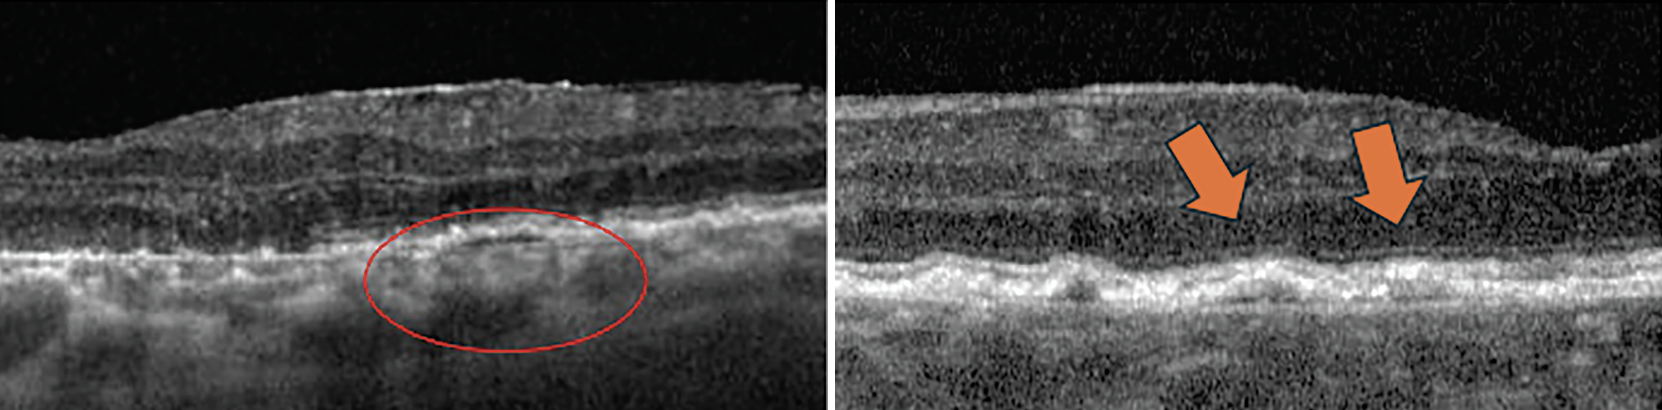 |
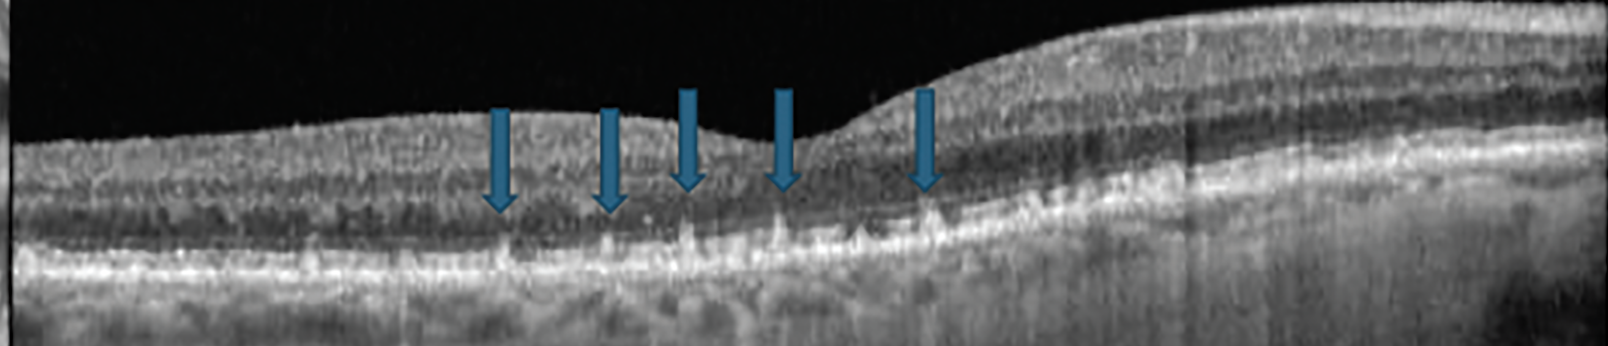
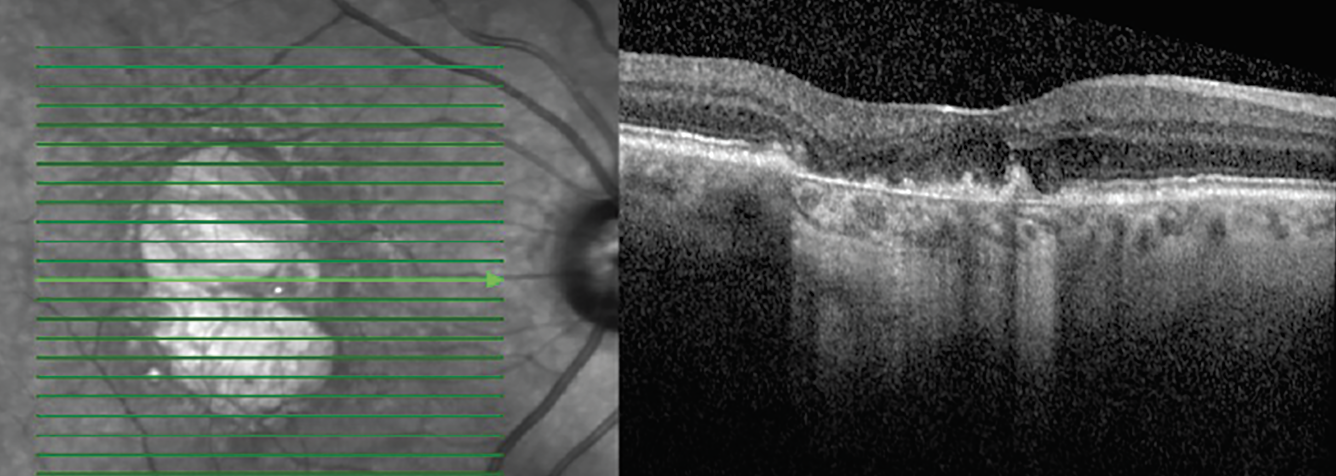
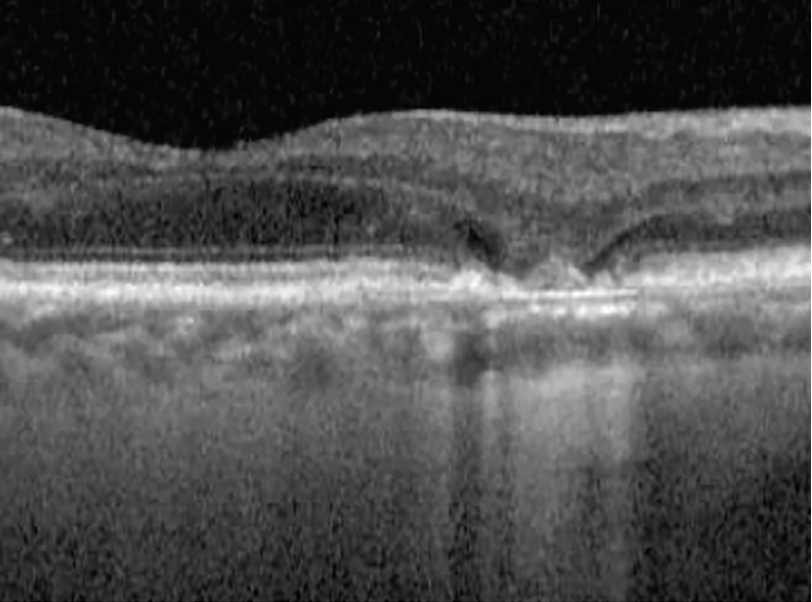
| Fig. 9. Double-layer sign is seen within the circle and marked by arrows in these two OCT cross-sections. Click image to enlarge. |
In addition to increased drusen volume as previously mentioned, there are other predictive and diagnostic biomarkers for neovascular AMD on OCT B-scan. Double-layer sign is an OCT cross-sectional finding reported as small, shallow and irregular elevation of the RPE from Bruch’s membrane that is associated with AMD and pachychoriod spectrum (Figure 9).27 When these lesions are >1,000µm in length and <100µm in height, they are referred to as shallow irregular RPE elevation, or SIRE (Figure 10).27
 |
|
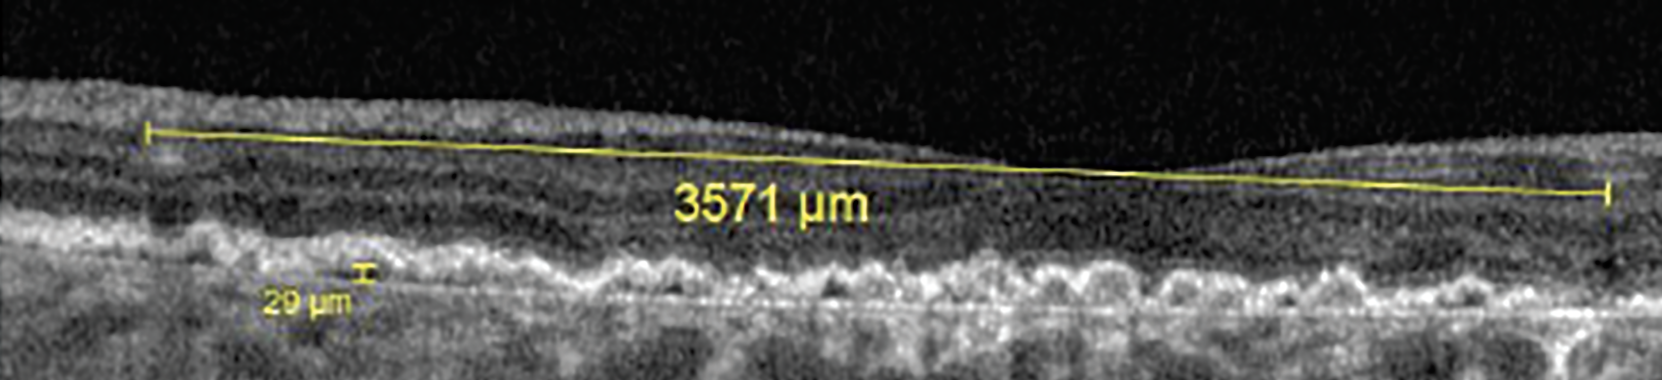
Fig. 10. This shallow irregular RPE elevation was more than 3,500μm in length and only 29μm in height. Click image to enlarge. |
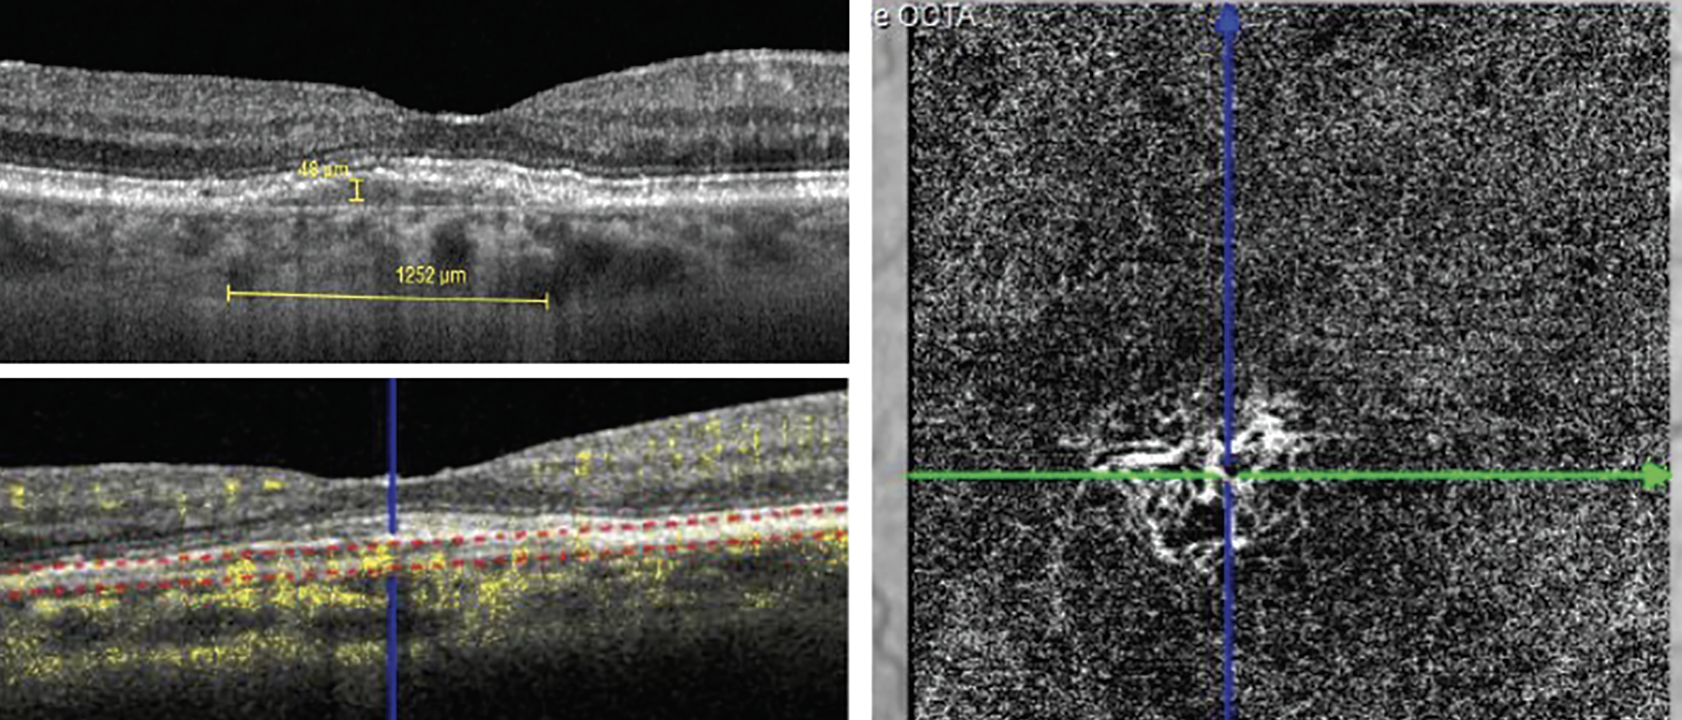
Double-layer sign and SIRE are considered highly predictive of presence or progression of exudative as well as nonexudative MNV.28,29 In the presence of double-layer sign and SIRE—and the absence of typical biomarkers of exudative MNV such as sub- or intraretinal fluid—OCT angiography is useful to rule out nonexudative MNV (Figure 11).30
 |
|
Fig. 11. Comparison of a shallow irregular RPE elevation with OCT B-scan to OCT-A, which reveals nonexudative MNV. Click image to enlarge. |
OCT also is crucial in the detection of nonexudative MNV. This condition can be broken down into the following three types:
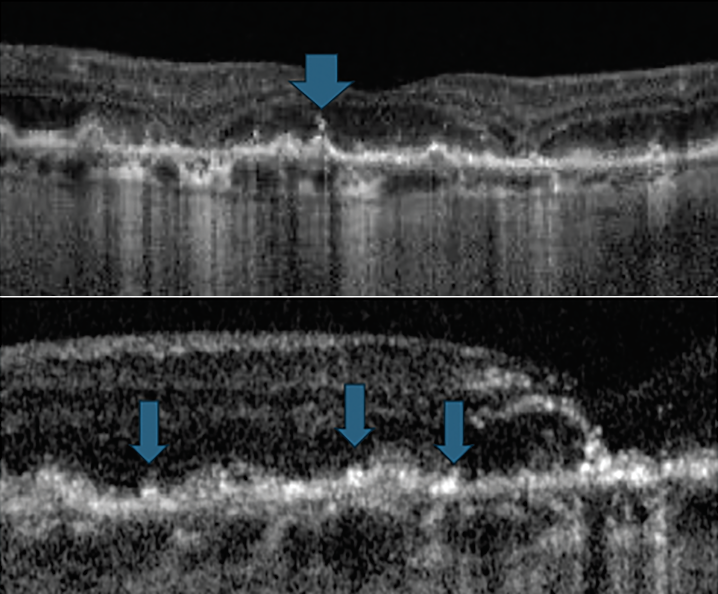
- Type 1: The growth of vessels initiates from the choriocapillaris advancing in the sub-RPE space detected by varying form of pigment epithelial detachments (Figure 12).31
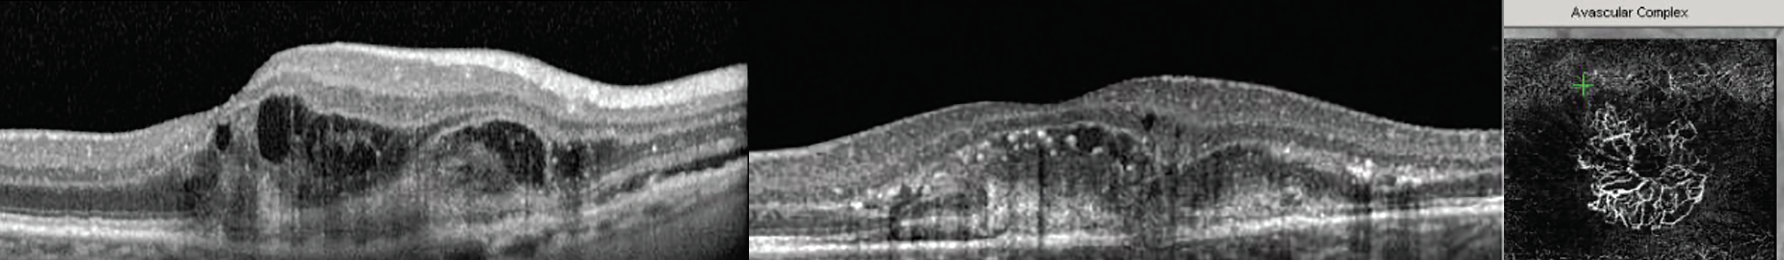
- Type 2: Abnormal vessels begin in the choroid and progress into the subretinal space by breaking through Bruch’s membrane.31 Subretinal lesions of various sizes can be detected with possible presence of retinal hemorrhages, sub- and/or intraretinal fluid or exudates (Figure 13).30
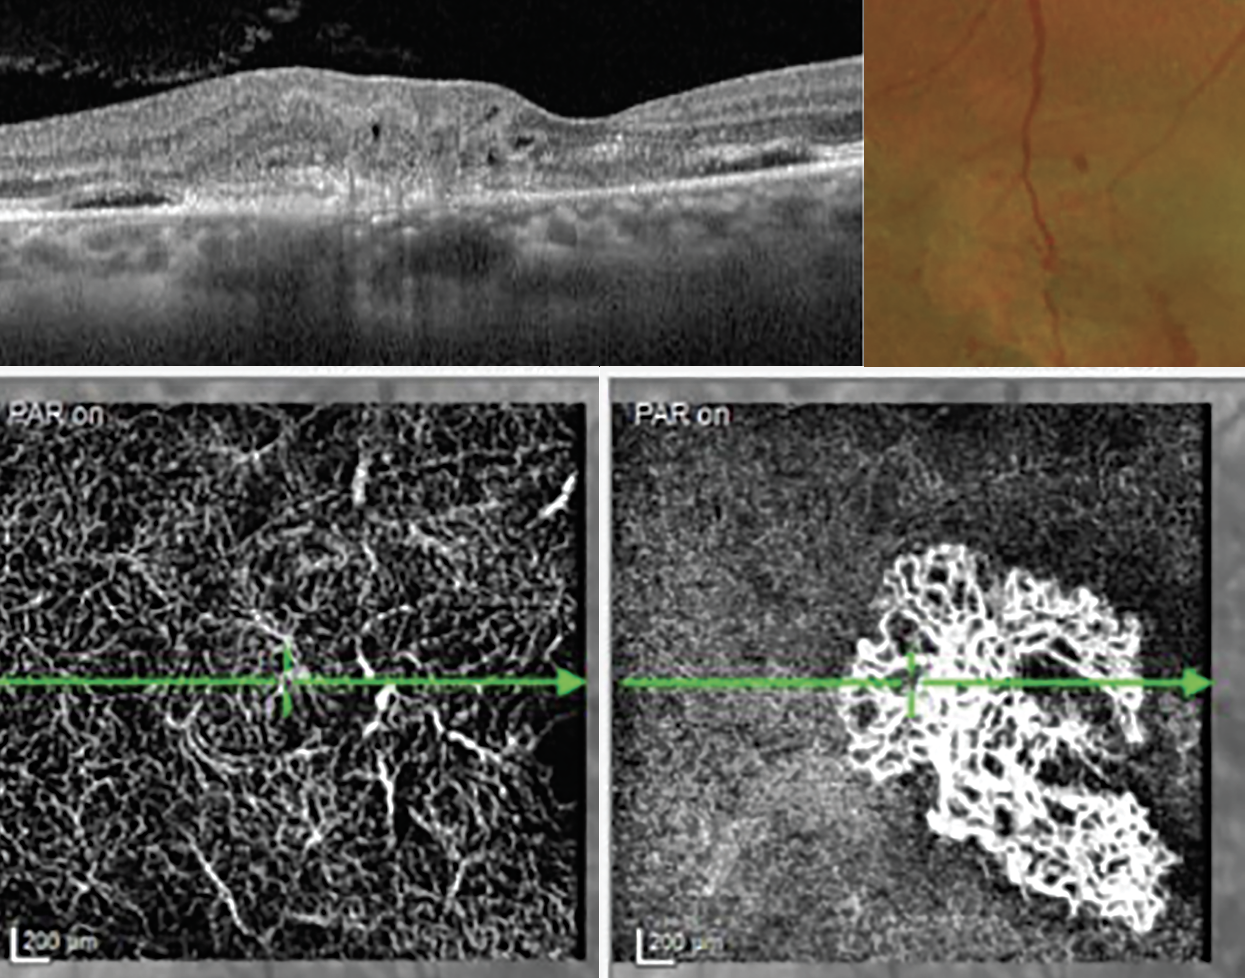
- Type 3 (retinal angiomatous proliferation): Neovascularization begins in the retinal circulation, often from the deep capillary plexus advancing to the outer retina (Figure 14).26,31
 |
|
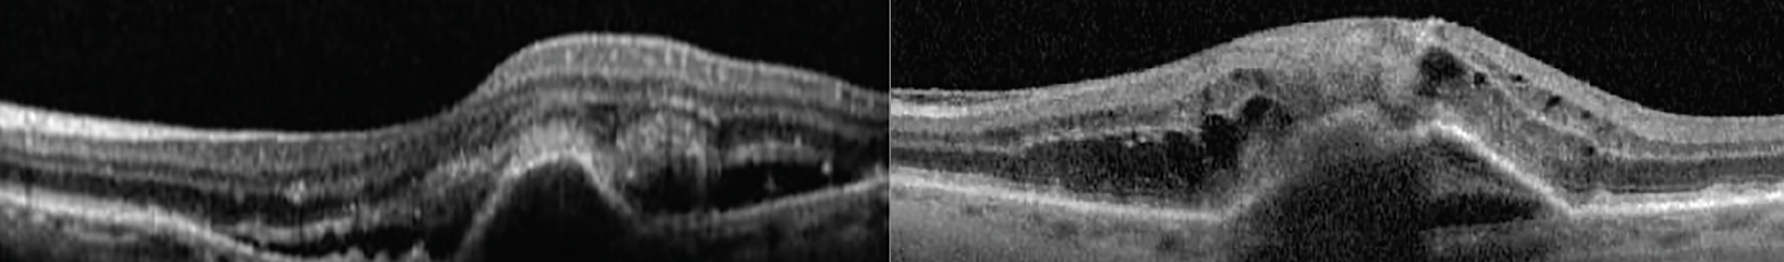
Fig. 12. Two case examples of type 1 MNV showing a pigment epithelial detachment and sub- and intraretinal fluid. Click image to enlarge. |
 |
|
Fig. 13. These two examples of type 2 MNV show lesions that penetrated Bruch’s membrane and are invading the subretinal space. The OCT-A on the right shows the abnormal vessel growth causing the morphological damage seen in the corresponding OCT cross-section. Click image to enlarge. |
Takeaways
 |
|
Fig. 14. These images demonstrate a type 3 MNV or a retinal angiomatous proliferation lesion on OCT. In the color fundus photograph (top right), the collateral retinal vessels are seen in the center on the neovascular lesion. The OCT-A images show capillary telangiectasia in the deep vascular plexus and the large MNV at the avascular level (bottom right). Click image to enlarge. |
All these advancements in imaging increase our knowledge of AMD, help convey risk for progression and help identify those patients in need of earlier referral for treatment. These advances may also help develop more targeted treatments based on certain morphologic factors discovered through imaging. AI tools are currently being developed that hopefully will aid the ability to screen for certain factors and help develop models for disease progression, aiding with clinical decision-making. Until then, it behooves the clinician to spend extra time studying images for these more subtle biomarkers of AMD progression and realize there are more questions to answer than merely, “Is it dry or wet?”
Dr. Ferrucci is currently chief of optometry at the Sepulveda VA Ambulatory Care Center and Nursing Home in North Hills, CA. He is also a professor at the Southern California College of Optometry at Marshall B. Ketchum University. Dr. Ferrucci is a fellow of the American Academy of Optometry (AAO), as well as a fellow and past president of the Optometric Retina Society (ORS). He serves on the advisory board and/or speakers bureau for Apellis, Astellas, I-Care, LKC Technologies, Science Based Health and Visible Genomics. Dr. Rafieetary is a consultative optometric physician at the Charles Retina Institute in Germantown, TN. He is also a fellow of the AAO and ORS. Dr. Rafieetary is on advisory boards for Heidelberg Engineering, Optos, Regeneron, Notal Vision and Cardinal Health.
1. Kaszubski P, Ami TB, Saade C, Smith RT. Geographic atrophy and choroidal neovascularization in the same eye: a review. Ophthalmic Res. 2016;55(4):185-93. 2. Green WR, Key SN 3rd. Senile macular degeneration: a histopathologic study. Trans Am Ophthalmol Soc. 1977;75:180-254. 3. Green WR, Enger C. Age-related macular degeneration histopathologic studies. The 1992 Lorenz E. Zimmerman Lecture. Ophthalmology. 1993;100(10):1519-35. 4. Age-Related Eye Disease Study Research Group. The AREDS system for classifying age-related macular degeneration from stereoscopic color fundus photographs: the Age-Related Eye Disease Study Report Number 6. Am J Ophthalmol. 2001;132(5):668-81. 5. Ferris FL, Davis MD, Clemons TE, et al; Age-Related Eye Disease Study (AREDS) Research Group. A simplified severity scale for age-related macular degeneration: AREDS Report No. 18. Arch Ophthalmol. 2005;123(11):1570-4. 6. Ferris FL 3rd, Wilkinson CP, Bird A, et al. Clinical classification of age-related macular degeneration. Ophthalmology. 2013;120(4):844-51. 7. Spaide RF, Curcio CA. Drusen characterization with multimodal imaging. Retina. 2010;30:1441-54. 8. Chan H, Cougnard-Grégoire A, Delyfer MN, et al. Multimodal imaging of reticular pseudodrusen in a population-based setting: The Alienor Study. Invest Ophthalmol Vis Sci. 2016;57(7):3058-65. 9. de Sisternes L, Simon N, Tibshirani R, Leng T, Rubin DL. Quantitative SD-OCT imaging biomarkers as indicators of age-related macular degeneration progression. Invest Ophthalmol Vis Sci. 2014;55(11):7093-103. 10. Nathoo NA, Or C, Young M, et al. Optical coherence tomography-based measurement of drusen load predicts development of advanced age-related macular degeneration. Am J Ophthalmol. 2014;158(4):757-61. 11. Dieaconescu DA, Dieaconescu IM, Williams MA, Hogg RE, Chakravarthy U. Drusen height and width are highly predictive markers for progression to neovascular AMD. Invest Ophthalmol Vis Sci. 2012;53:2910. 12. Adbelfattah N, Zhang H, Boyer D, et al. Drusen volume as a predictor of disease progression in patients with late age-related macular degeneration in the fellow eye. Invest Ophthalmol Vis Sci. 2016;57:1839-46. 13. Klein ML, Francis PJ, Ferris FL 3rd, Hamon SC, Clemons TE. Risk assessment model for development of advanced age-related macular degeneration. Arch Ophthalmol. 2011;129:1543-50. 14. Xu X, Liu X, Wang X, et al. Retinal pigment epithelium degeneration associated with subretinal drusenoid deposits in age-related macular degeneration. Am J Ophthalmol. 2017;175:87-9. 15. Zweifel SA, Imamura Y, Spaide TC, Fujiwara T, Spaide RF. Prevalence and significance of subretinal drusenoid deposits (reticular pseudodrusen) in age-related macular degeneration. Ophthalmology. 2010;117:1775-81. 16. Khanifar AF, Koreishi JAI, Toth CA. Drusen ultrastructure imaging with spectral domain optical coherence tomography in age-related macular degeneration. Ophthalmology. 2008;115(11):1883-90. 17. Schuman SG, Koreishi AF, Farsiu S, et al. Photoreceptor layer thinning over drusen in eyes with age-related macular degeneration imaged in vivo with spectral-domain optical coherence tomography. Ophthalmology. 2009;116(3):488-96. 18. Folgar FA, Chow JH, Farsiu S, et al. Spatial correlation between hyperpigmentary changes on color fundus photography and hyperreflective foci on SD-OCT in intermediate AMD. Invest Ophthalmol Vis Sci. 2012;53(8):4626-33. 19. Christenbury JG, Folgar FA, O’Connell RV, et al. Age-related eye disease study 2 ancillary spectral domain optical coherence tomography study group. Progression of intermediate age-related macular degeneration with proliferation and inner retinal migration of hyperreflective foci. Ophthalmology. 2013;120:1038-45. 20. Ouyang Y, Heussen FM, Hariri A, et al. Optical coherence tomography-based observation of the natural history of drusenoid lesion in eyes with dry age-related macular degeneration. Ophthalmology. 2013;120:2656-65. 21. Shi Y, Yang J, Feuer W, Gregori G, Rosenfeld PJ. Persistent hypertransmission defects on en face OCT imaging as a stand-alone precursor for the future formation of geographic atrophy. Ophthalmol Retina. 2021;5(12):1214-25. 22. Guymer RH, Rosenfeld PJ, Curcio CA, et al. Incomplete retinal pigment epithelial and outer retinal atrophy in age-related macular degeneration: classification of atrophy meeting report 4. Ophthalmology. 2020;127(3):394-409. 23. Wu Z, Luu CD, Ayton LN, et al. Optical coherence tomography-defined changes preceding the development of drusen-associated atrophy in age-related macular degeneration. Ophthalmology. 2014;121(12):2415-22. 24. Sepah YJ, Akhtar A, Sadiq MA, et al. Fundus autofluorescence imaging: fundamentals and clinical relevance. Saudi J Ophthal. 2014;28(2):111-6. 25. Biarnés M, Arias L, Alonso J, et al. Increased fundus autofluorescence and progression of geographic atrophy secondary to age-related macular degeneration. The GAIN study. Am J Ophthalmol. 2015;160(2):345-53. 26. Spaide RF, Jaffe GJ, Sarraf D, et al. Consensus nomenclature for reporting neovascular age-related macular degeneration data: consensus on Neovascular Age-Related Macular Degeneration Nomenclature Study Group. Ophthalmology. 2020;127(5):616-36. 27. Sheth J, Anantharaman G, Chandra S, Sivaprasad S. Double-layer sign on spectral domain optical coherence tomography in pachychoroid spectrum disease. Indian J Ophthalmol. 2018;66(12):1796-1801. 28. Csincsik L, Muldrew KA, Bettiol A, et al. The double layer sign is highly predictive of progression to exudation in age-related macular degeneration. Ophthalmol Retina. 2024;8(3):234-45. 29. Csincsik L, Muldrew A, Sproule A, et al. The predictive value of double layer sign and shallow irregular RPE elevation: results from a systemic study. Invest Ophthalmol Vis Sci. 2023;64(8):2179. 30. Metrangolo C, Donati S, Mazzola M, et al. OCT biomarkers in neovascular age-related macular degeneration: a narrative review. J Ophthalmol. 2021;9994098. 31. Tsai ASH, Cheung N, Gan ATL, et al. Retinal angiomatous proliferation. Surv Ophthalmol. 2017;62(4):462-92. |