More and more optometrists are investing in optical coherence tomography (OCT) for their practices. With the increase in adoption of this technology comes the question of how to expand its uses from conventional and common to sophisticated but still practical. This article looks to explore a few ways ODs can ramp up their OCT usage.
OCT-A in Diabetic Retinopathy
OCT angiography (OCT-A) is a noninvasive, dyeless imaging technology that provides volumetric maps of the retinal and choroidal vascular systems, as well as information on blood flow. Because it employs OCT imaging technology, vascular information can be viewed alongside or superimposed on structural data. This allows for precise localization of vascular lesions and for structural correlations to be drawn.
As diabetic retinopathy predominantly affects inner retinal circulation, OCT-A preset en face displays of interest include the superficial and deep capillary plexuses as well as the vitreous or vitreoretinal interface. Retinal nonperfusion, apparent on the superficial and deep capillary enface displays, is often most prominent in the midperiphery and is best visualized with montage angiography imaging (Figure 1B). The greater the degree of nonperfusion, the greater the vascular endothelial growth factor (VEGF) release and the higher the risk of current or future proliferation.
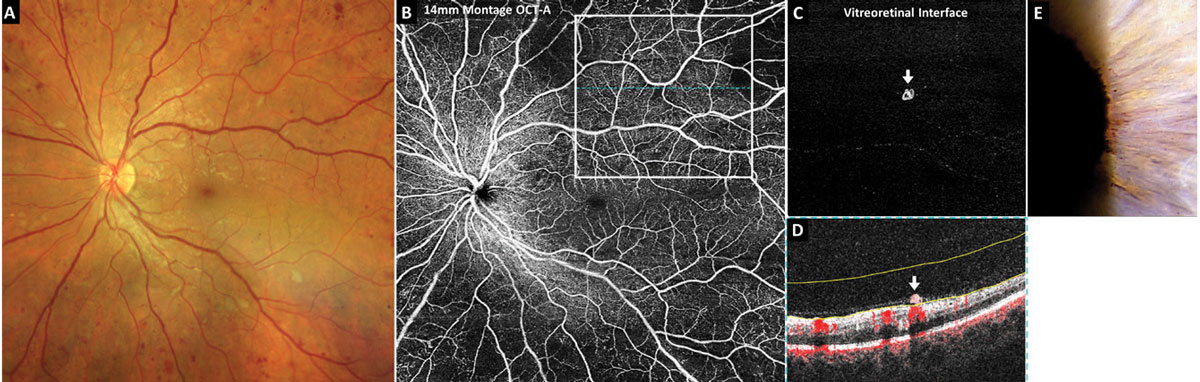 |
| Fig. 1. OCT-A of subtle proliferative diabetic retinopathy. Click image to enlarge. |
Montage OCT-A is incredibly useful in detecting small areas of preretinal neovascularization in eyes with diabetic retinopathy and, therefore, aids in the earliest diagnosis of proliferative-stage disease possible. The volumetric dataset provided with OCT-A imaging also applies to montage images so that neovascularization can be easily isolated and identified using the preset vitreoretinal interface or vitreous enface display. The vitreoretinal interface includes data from the vitreous just anterior to the retina. In a healthy eye, it should be void of signal, or black. Areas of preretinal neovascularization will appear hyperreflective (Figure 1C).
Figure 1 includes OCT-A imaging in a treatment-naïve eye with 20/20 acuity. Color photography and funduscopy revealed what was initially thought to be very severe nonproliferative diabetic retinopathy (Figure 1A). A 14mm x 14mm montage OCT-A superficial capillary plexus scan revealed significant midperipheral retinal nonperfusion (Figure 1B). The superior temporal 8mm OCT-A vitreoretinal interface image revealed a small preretinal neovascular membrane (Figure 1C). The corresponding OCT cross-sectional B-scan with blood flow overlay in red highlighted the preretinal neovascularization (white arrow) which rests on the retinal surface and appears to be clinging to a shallowly detached posterior hyaloid membrane (Figure 1D). This eye also exhibited subtle iris rubeosis (Figure 1E).
Recent research suggests subtle neovascularization is often missed in eyes clinically graded as severe nonproliferative but can be detected with montage OCT-A. Researchers performed montage OCT-A on 27 eyes clinically graded as having nonproliferative diabetic retinopathy.1 Of the seven eyes originally graded as severe nonproliferative, montage OCT-A detected neovascularization in four (57%). Of note, the neovascularization would have been missed in two of these eyes if only a single 6mm x 6mm angiography macular scan was done.
There is a shifting paradigm toward earlier treatment of diabetic retinopathy, even in the nonproliferative stages, with anti-VEGF agents to prevent vision-threatening complications. Therefore, accurate staging and early detection of proliferative disease is of the upmost importance so that patients can be referred appropriately.
OCT-A in Retinal Venous Occlusion
Vision decline in retinal venous occlusive disease without neovascularization may be due to macular edema, macular ischemia and/or macular hemorrhage. Most clinicians are familiar with the utility of OCT in the evaluation of macular edema; however, it is important to also be aware that macular ischemia apparent via OCT-A may also be present and contributing to vision loss.
The prognosis for visual improvement is guarded in eyes with both macular edema and macular ischemia, the latter of which is thought to be mostly non-reversible despite appropriate anti-VEGF therapy. Both macular ischemia and retinal nonperfusion are typically invisible with fundoscopy alone unless acute or extensive. OCT-A, however, readily demonstrates retinal and macular nonperfusion. Macular ischemia is evident on OCT-A through enlargement of the foveal avascular zone.
 |
|
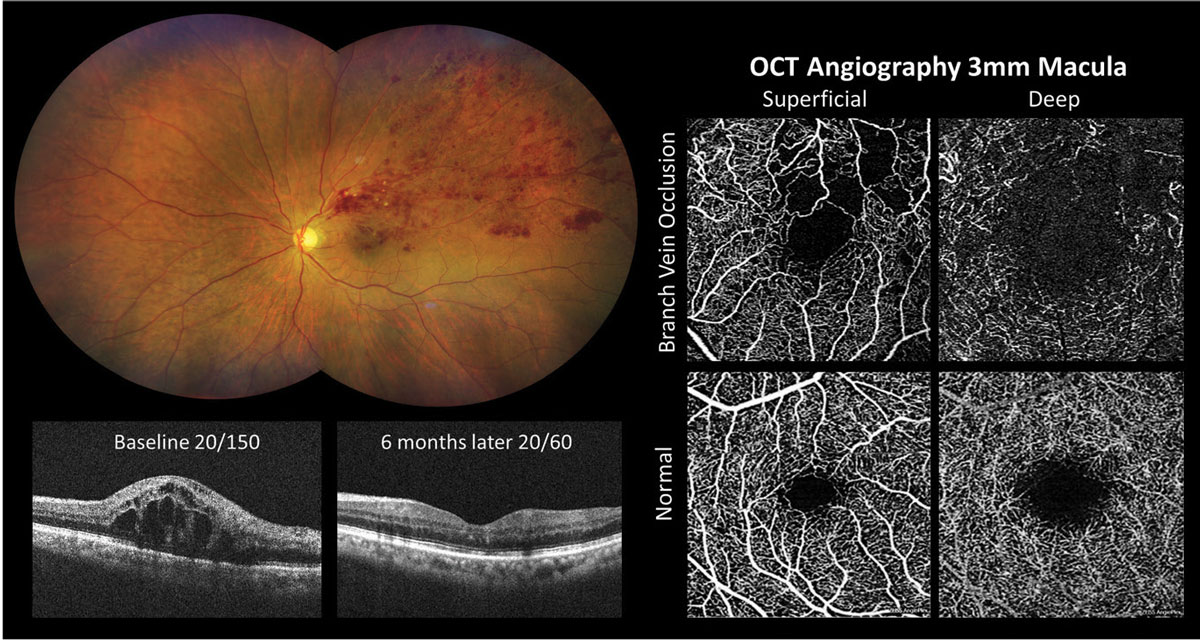
Fig. 2. OCT-A detection of macular ischemia in branch retinal vein occlusion. Photo: Click image to enlarge. |
Figure 2 shows OCT-A imaging in an eye with macular edema and macular ischemia secondary to superior temporal branch retinal vein occlusion. Significant macular edema was present at baseline and vision improved from 20/150 to 20/60 following six months of anti-VEGF treatment. A 3mm macular OCT-A scan suggested that the reduced vision was due to macular ischemia. The superficial capillary plexus enface image showed an enlarged foveal avascular zone with irregular contour and retinal nonperfusion within the superior macula.
Another clinical application of OCT-A in retinal venous occlusion is the detection and quantification of retinal capillary nonperfusion using montage imaging.2 Estimating the degree of retinal nonperfusion is useful for differentiating ischemic from nonischemic occlusions and predicting which eyes are at greatest risk for developing neovascularization. Ischemic branch retinal vein occlusions, or those with greater than five disc areas of nonperfusion, are at high risk of developing posterior segment neovascularization such as neovascularization of the disc or retina elsewhere.3 Similarly, eyes with ischemic central retinal vein occlusions, defined as having 10 or more disc areas of nonperfusion, are at high risk for developing iris and angle neovascularization as well as subsequent neovascular glaucoma.4
OCT-A in Drusen Subclassification
In the evaluation of age-related macular degeneration (AMD), OCT interpretation should not merely be limited to the identification of drusen. Determining the type of drusen, through the assessment of its location and morphological characteristics, is crucial in clinical decision-making. For instance, hard drusen in the macula, which we are familiar with as a risk factor for AMD, can be associated with other types of drusen that carry more aggressive pathological risks for conversion of nonexudative AMD to its exudative form.
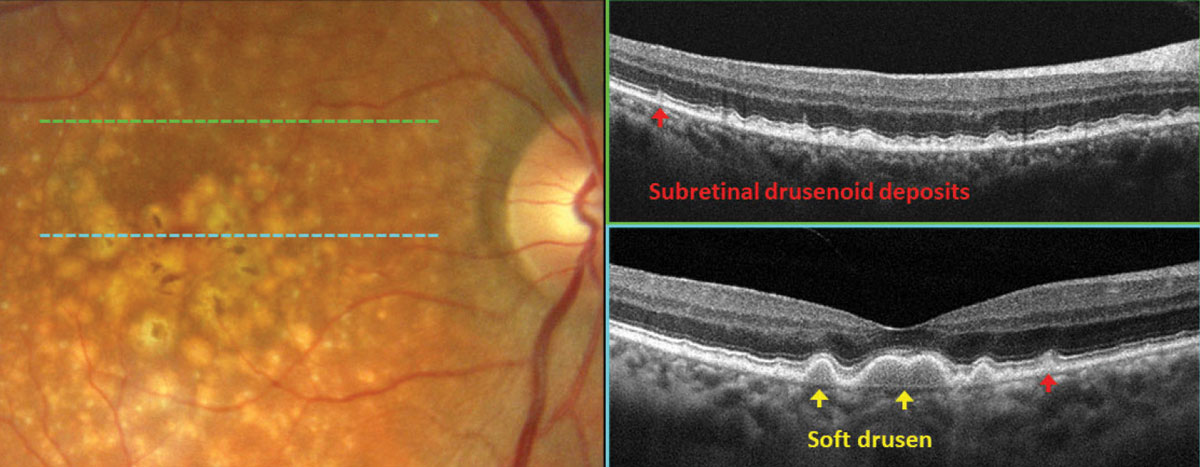
In Figure 3, fundus photography gives a general presentation of drusen with pigmentary changes in the macula. Careful review of OCT scans revealed distinct subtypes of drusen. Subretinal drusenoid deposits (SDD, red arrows), also referred to as reticular pseudodrusen, can be identified below the sensory retina and are associated with an intact retinal pigment epithelium (RPE). Another subtype of drusen, soft drusen (yellow arrows), is associated with drusenoid RPE detachments and is characterized by hyporeflective areas beneath the mounds of RPE. When these two types of drusen are present, reflecting compromise of the photoreceptors and RPE, the risk of conversion to exudative AMD increases.
In a study of patients with neovascular AMD in one eye, the five-year incidence of neovascularization in the contralateral eye with SDDs was 25.7%, and with soft drusen, it was 46.2%.5 The presence of both SDDs and soft drusen resulted in an incidence of 76.4%.5 It is therefore key to distinguish these types of drusen on OCT scans for patient education and to set appropriate monitoring intervals.
 |
|
Fig. 3. OCT subclassification of drusen in AMD. Click image to enlarge. |
OCT-A in Macular Degeneration
This technology allows for noninvasive assessment of the retinal and choroidal vasculature and is therefore useful in detecting, classifying and morphologically characterizing neovascular membranes that may complicate diseases of the outer retina such as AMD. OCT-A aids in earlier detection of subretinal and choroidal neovascular membranes (CNV) in AMD, allowing for prompt treatment and vision preservation.
Conventional structural OCT provides valuable information regarding the presence of CNV membranes by allowing the clinician to observe secondary manifestations of CNV, such as fluid accumulation and retinal and subretinal thickening. The addition of OCT-A provides another tool for CNV detection since it allows the membrane itself to be seen.6,7 There are various enface preset displays that are specifically designed to aid in the detection of subretinal and CNV membranes, including the outer retina and the outer retina choriocapillaris whose segmentation boundaries include a combination of photoreceptors, RPE and the choriocapillaris.
Figure 4 shows OCT and OCT-A imaging in an eye with new-onset exudative neovascular AMD and acuity of 20/25-1. Fundus examination revealed multiple macular drusen, non-central geographic atrophy and grayish thickening of the temporal fovea with adjacent subretinal hemorrhage (Figure 4A). Structural OCT of the superior macula (Figure 4B) and through the center of the fovea (Figure 4C) revealed outer retinal thickening and a hyperreflective subretinal mass (yellow arrow) with adjacent subretinal fluid. A 3mm OCT-A scan of the macula outer retina choriocapillaris enface preset (Figure 4D) demonstrates a well-formed neovascular complex; the corresponding segmentation boundaries are shown in yellow (Figure 4E).
In some cases, OCT-A may reveal subclinical neovascular membranes before the onset of exudation, a condition referred to as nonexudative or quiescent CNV. A nonexudative CNV membrane is a well-defined neovascular complex visualized with OCT-A without exudative features via ophthalmoscopy such as exudate or hemorrhage. Additionally, no fluid is present via structural OCT imaging and the CNV membrane does not leak with intravenous fluorescein angiography.8 This lesion carries with it a substantial risk for conversion to the exudative form of the disease; therefore, these are eyes that need to be monitored very closely. Research suggests that eyes with nonexudative CNV have a nearly 15-fold increased risk of subsequently developing exudation.9-11
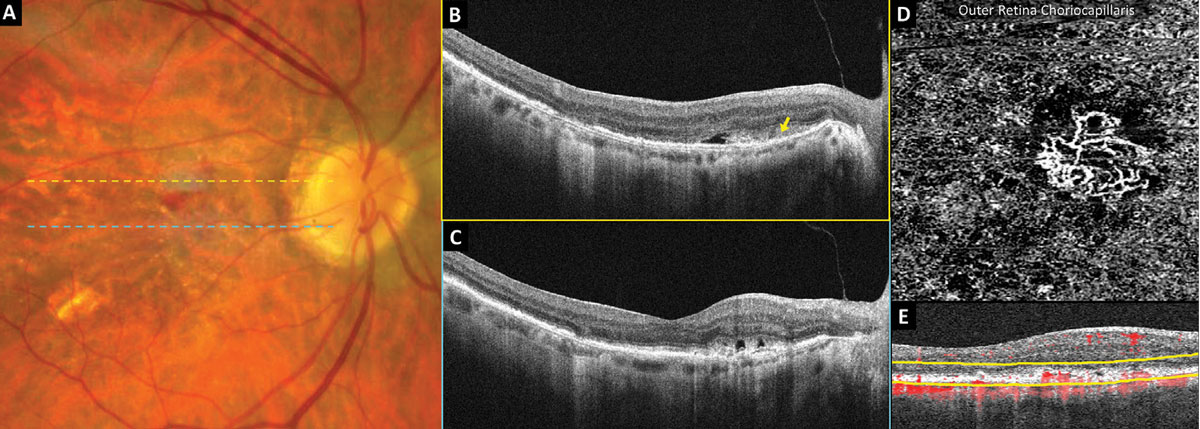 |
Fig. 4. OCT-A detection of neovascular AMD. Click image to enlarge. |
OCT-A in Macular Telangiectasia Type 2
Macular telangiectasia type 2 (MacTel2) is characterized by bilateral perifoveal telangiectatic capillaries as well as mild and slowly progressive vision loss in the fifth to sixth decades of life.12 Prevalence is estimated to be 0.1% in people 40 years and older, and both environmental and genetic factors are thought to play a role in the pathogenesis.12 Fundus features include a prominent reddish foveal appearance with parafoveal (especially temporal) retinal opacity, crystalline deposits, blunted right-angle venules and hyperpigmented plaques.12 These findings can be incredibly subtle in early stages of the disease; therefore, MacTel2 is commonly misdiagnosed as a macular hole, macular degeneration or central serous chorioretinopathy.
Structural OCT and OCT-A are invaluable tools that aid in the challenging diagnosis of MacTel2. Structural OCT often reveals early loss of the foveal photoreceptors eventually resulting in severe outer retinal thinning and atrophy with possible internal limiting membrane draping.12 Loss of tissue may result in pseudocystic formation or dark subfoveal atrophic cleft development. OCT-A further assists in diagnosis by revealing bilateral dilated telangiectatic perifoveal capillaries, which are typically most prominent within the deep capillary plexus of the temporal region, enlargement of the foveal avascular zone and blunted right-angle venules.13,14
Figure 5 shows imaging of a patient in his mid-fifties with MacTel2 and 20/20 vision. Structural OCT of the right and left eyes shows loss of the photoreceptor ellipsoid zone and outer nuclear layers within the temporal fovea (Figures 5B and 5E). A 3mm OCT-A scan of both eyes demonstrates enlargement of the foveal avascular zone within the superficial capillary plexus as well as dilated telangiectatic capillaries within the deep capillary plexus, especially temporally (Figures 5C and 5F). The outer retina choriocapillaris enface display of the right eye demonstrates a hyperreflective transmission artifact within the temporal fovea due to loss of the outer retina with no evidence of subretinal neovascularization.
OCT-A also aids in the early detection of subretinal neovascularization, which is a more severe and potentially treatable complication of MacTel2.15 Eyes with subretinal neovascularization tend to have a poorer visual prognosis; early detection and treatment is imperative.12,15
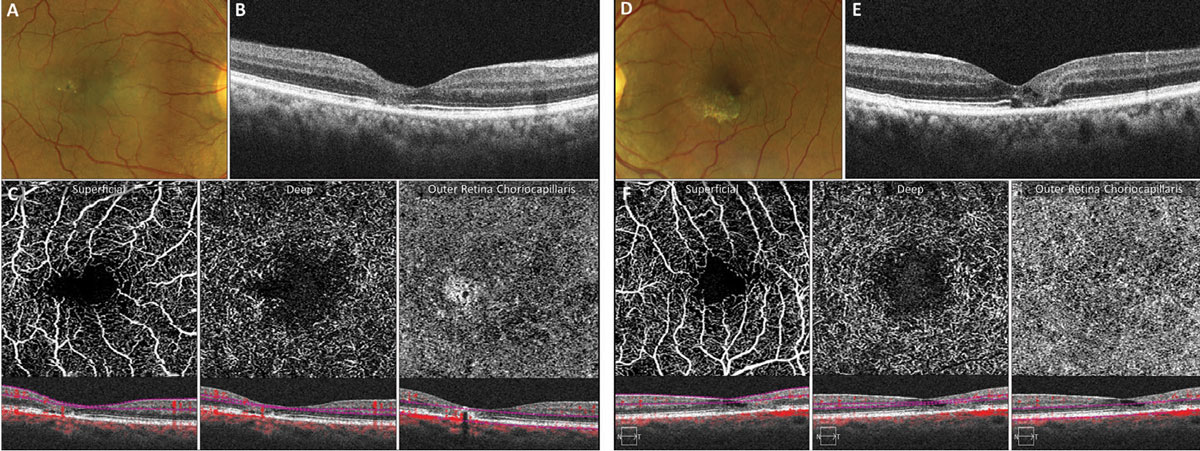 |
Fig. 5. OCT-A abnormalities in early MacTel2. Click image to enlarge. |
EDI-OCT in Choroidal Tumors
Advances in OCT technology such as swept-source OCT and enhanced-depth imaging OCT (EDI-OCT) allow for deeper imaging down into the choroid and are invaluable in the assessment of high-risk choroidal tumors. EDI-OCT penetrates an additional 500µm to 800µm deeper compared with traditional OCT imaging and can be easily performed with just the click of a button or check of a box on most commercially available OCT models with newer software upgrades.16
It is important to use the OCT caliper tool to measure choroidal tumor thickness from the posterior aspect of the RPE down to the posterior border of the tumor (often immediately adjacent to the hyperreflective inner sclera) through the region where the tumor appears to be thickest.17 Combining EDI-OCT with image averaging (condensing all raster lines down into one line) will provide the highest-resolution imaging of the choroid and the best chance of identifying the posterior border of a tumor. Prior studies suggest that ultrasonography significantly overestimates tumor thickness compared with EDI-OCT, with one study finding that small choroidal melanoma tumor thickness was overestimated by 55% on ultrasonography compared with EDI-OCT.17
Differentiating choroidal nevus from small choroidal melanoma and predicting which choroidal nevi are at greatest risk for malignant transformation has long been a diagnostic challenge. The mnemonic “To Find Small Ocular Melanoma” helps us remember the high-risk features predictive of malignant transformation.18 This well-known mnemonic was recently updated to “To Find Small Ocular Melanoma Doing IMaging” to incorporate risk factors visualized with multimodal imaging modalities including OCT.19 The “T” stands for tumor thickness greater than 2mm with ultrasonography.19 As previously mentioned, however, it is important to be aware that a 2mm ultrasound does not equal a 2mm OCT, since ultrasound overestimates tumor thickness.19 A more reasonable tumor thickness cutoff for suspicion if using EDI-OCT is approximately 890µm.
The “F” stands for subretinal fluid via OCT imaging, and the “S” stands for symptomatic vision loss of 20/50 or worse.19 The “O” is for orange pigment or lipofuscin deposition that is best visualized with fundus autofluorescence (FAF), and “M” stands for melanoma acoustic hollowness, or a dark internal appearance, via ultrasound.19
Lastly, the “Doing IMaging” stands for a diameter greater than 5mm as measured with widefield or ultra-widefield color fundus photography.19
Figure 6 shows FAF and EDI-OCT imaging in an eye with a suspicious pigmented choroidal tumor being monitored closely by ocular oncology. Upon FAF imaging, most of the tumor is heterogeneously hypoautofluorescent (Figure 6B). A strong hyperautofluorescent signal is present on the most peripheral aspect of the tumor and likely signifies a “gutter” of RPE irritation from chronic waxing and waning subretinal fluid that has sunk inferiorly with gravity. Tumor thickness (red line) was measured from the posterior aspect of the RPE/Bruch’s membrane down to the posterior border of the tumor (dashed blue line) using EDI-OCT and was found to be 1,450µm (Figure 6C).
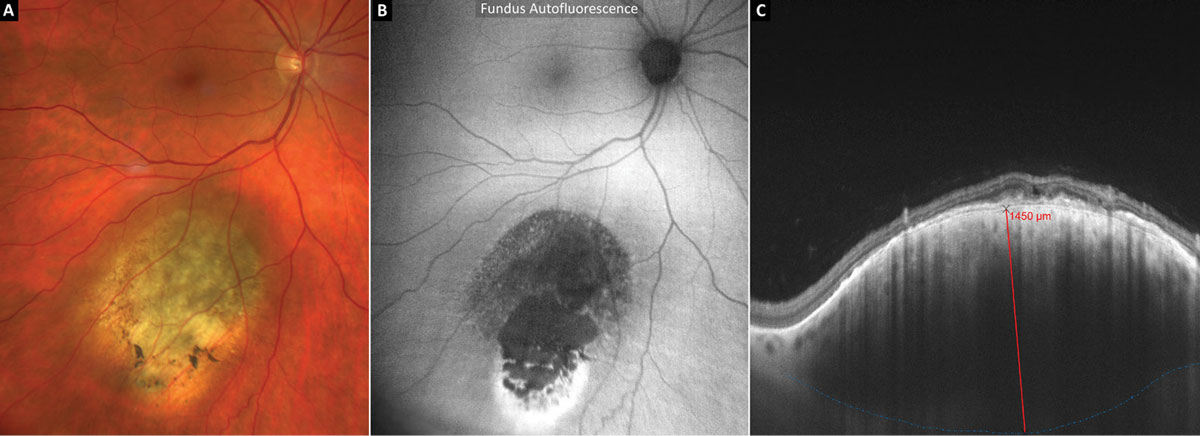 |
Fig. 6. EDI-OCT and thickness measurement of a suspicious pigmented choroidal tumor. Click image to enlarge. |
OCT in Retrochiasmal and Chiasmal Damage
Macular ganglion cell analysis algorithms can measure the combined thickness of the ganglion cell and inner plexiform layers (GCIPL), providing quantitative measurements that can detect subtle damage to the inner retina.20
Retrochiasmal lesions. Recall that the retrochiasmal visual pathway includes the optic tract, lateral geniculate nucleus (LGN), optic radiations and occipital cortex. A lesion involving any of these structures may result in corresponding homonymous hemi-macular GCIPL thinning.
For example, a right-sided retrochiasmal visual pathway lesion will result in temporal GCIPL thinning of the right eye and nasal GCIPL thinning of the left eye in addition to a left homonymous hemianopia. In the instance of an optic tract lesion, GCIPL thinning occurs due to retrograde degeneration, in which atrophy travels back toward the presynaptic cell body (ganglion cell).21 In the case of a lesion of the optic radiations, transsynaptic retrograde degeneration occurs across the synapse at the LGN.21 Anterior lesions of the retrochiasmal visual pathway, such as those involving the optic tract or LGN, result in faster and more severe GCIPL loss than posterior lesions involving the occipital lobe.22
Researchers found that the majority of hemi-macular GCIPL thinning occurs within six months (as early as two months in anterior lesions) and stabilizes at two years.22 Therefore, if GCIPL thinning is found to be progressing after two years, multiple lesions (such as repetitive strokes) should be suspected.22
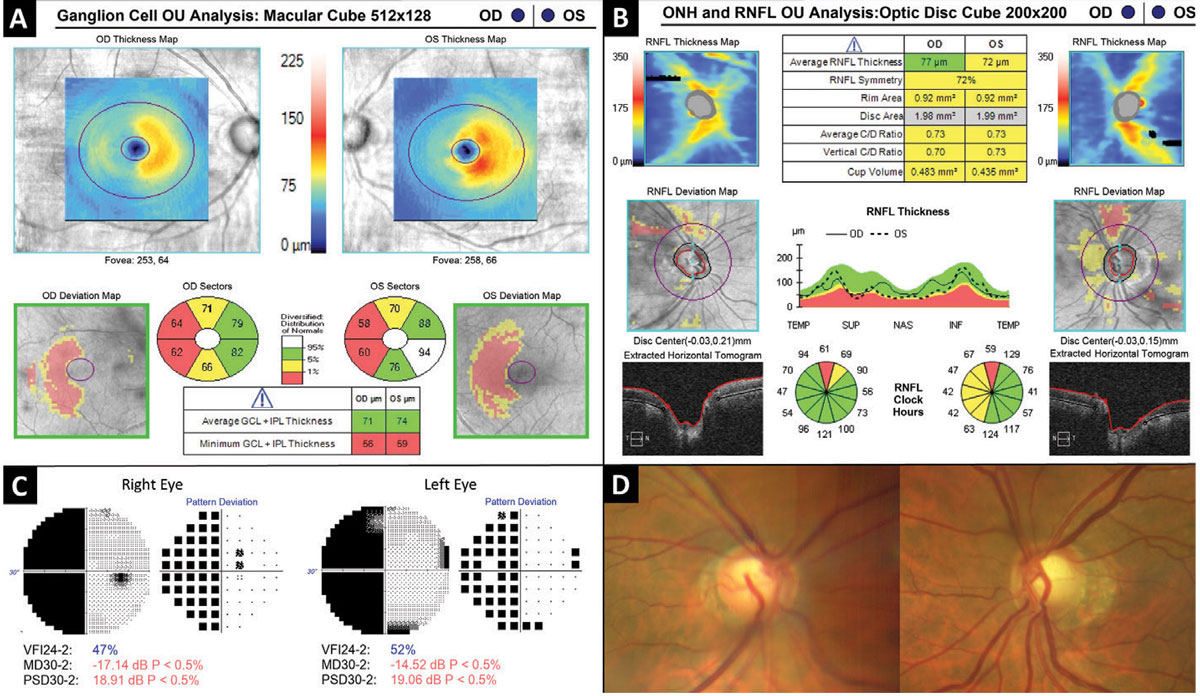 |
Fig. 7. Hemi-macular GCIPL thinning as a result of retrochiasmal visual pathway damage. Click image to enlarge. |
Figure 7 depicts a patient in his sixties who suffered a right-sided intraventricular hemorrhage three years prior. Automated visual field testing (Figure 7C) revealed a near complete left homonymous hemianopia which corresponds to bilateral hemi-macular GCIPL thinning evident on OCT ganglion cell analysis (Figure 7A). The optic nerves demonstrated bilateral cupping along with temporal and nasal “band” pallor of the neuroretinal rim tissue of the left nerve (Figure 7D).
Retrochiasmal disorders include ischemic stroke (most common), neoplasm, hemorrhage, trauma and aneurysm.23 A retrochiasmal lesion causing GCIPL thinning may be easily confused with and misdiagnosed as glaucoma. Red flags for a non-glaucomatous etiology include a homonymous pattern with vertical respect which may be a feature of both ganglion cell thinning and visual field loss. When these kinds of features are present, further investigation including neuroimaging should be considered.
Chiasmal lesions. A chiasmal visual pathway lesion, such as a compressive pituitary adenoma, may also result in hemi-macular GCIPL thinning. Chiasmal lesions are more likely to result in bi-nasal or heteronymous GCIPL thinning vs. the homonymous loss that commonly occurs with retrochiasmal lesions. Research suggests OCT ganglion cell analysis may be more sensitive than standard automated visual field testing in the detection of early chiasmal compression.24 Therefore, OCT ganglion cell analysis should be included in the workup for patients suspected of chiasmal compression.
OCT in RNFL Progression
Most newer OCT systems include glaucoma progression analysis software that can be very valuable for assessing changes in RNFL thickness and optic nerve head morphology over time. OCT guided progression analysis will do most of the work for you to determine whether optic nerve pathology is worsening or improving. The clinical utility of OCT progression analysis software goes far beyond glaucoma and can be used to monitor many other conditions, including idiopathic intracranial hypertension, disc drusen, ischemic optic neuropathy and optic neuritis.
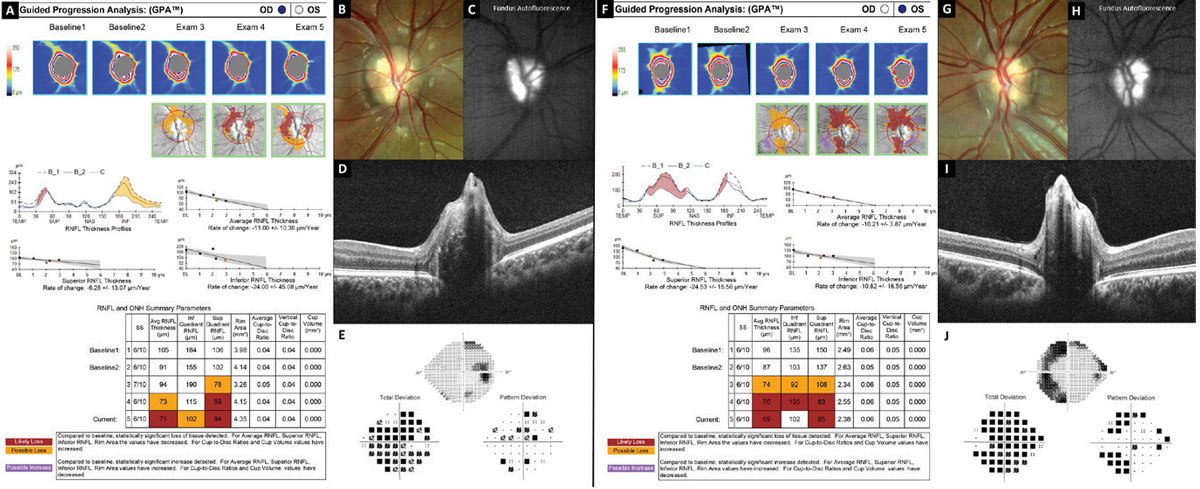 |
Fig. 8. Optic nerve and RNFL progression analysis demonstrating loss of the nerve fiber layer in optic nerve head drusen. Click image to enlarge. |
Figure 8 shows evidence of progressive RNFL thinning in a teenager with severe optic nerve head drusen confirmed with B-scan ultrasonography, FAF (Figures 8C and 8H) and EDI-OCT (Figures 8D and 8I). Analysis of the right eye (Figure 8A) shows decreasing RNFL thickness especially inferior, while the left eye (Figure 8F) shows decreasing RNFL thickness especially superior. This analysis represents a time span of three years.
Takeaways
As OCT continues to become more popular, it’s worth revisiting how you currently use this technology and how you can expand its uses to better serve your patients and treat a wider range of ocular conditions.
Dr. Majcher is an associate professor and the director of residency programs at the Oklahoma College of Optometry Northeastern State University in Tahlequah, OK. She is a paid speaker and consultant for Regeneron Pharmaceuticals and Carl Zeiss Meditec.
Dr. Cobbina is a family practice/ocular disease resident at the Oklahoma College of Optometry Northeastern State University and an Army optometrist. His contribution to this article does not represent the views of the US Army, the Department of Defense or its components.
| 1. You QS, Guo Y, Wang J, et al. Detection of clinically unsuspected retinal neovascularization with wide-field optical coherence tomography angiography. Retina. 2020;40(5):891-7. 2. Seknazi D, Coscas F, Sellam A, et al. Optical coherence tomography angiography in retinal vein occlusion: correlations between macular vascular density, visual acuity, and peripheral nonperfusion area on fluorescein angiography. Retina. 2018;38(8):1562-70. 3. Argon laser scatter photocoagulation for prevention of neovascularization and vitreous hemorrhage in branch vein occlusion. A randomized clinical trial. Branch Vein Occlusion Study Group. Arch Ophthalmol. 1986;104(1):34-41. 4. Natural history and clinical management of central retinal vein occlusion. The Central Vein Occlusion Study Group. Arch Ophthalmol. 1997;115(4):486-91. 5. Lee J, Choi S, Lee CS, et al. Neovascularization in fellow eye of unilateral neovascular age-related macular degeneration according to different drusen types. Am J Ophthalmol. 2019;208:103-10. 6. De Carlo TE, Romano A, Waheed NK, et al. A review of optical coherence tomography angiography (OCTA). Int J Retina Vitreous. 2015;1(5):1-15. 7. Majcher C, Johnson SL. Imaging motion: a review of OCT-A. Rev Optom. 2017;154(3):36-48. 8. Carnevali A, Cicinelli MV, Capuano V, et al. Optical coherence tomography angiography: a useful tool for diagnosis of treatment-naïve quiescent choroidal neovascularization. Am J Ophthalmol. 2016;169:189-98. 9. Bailey ST, Gao SS, Flaxel CJ, et al. Early detection of choroidal neovascularization with OCT angiography. ARVO Annual Meeting Abstract, June 2017. 10. Bailey ST, Thaware O, Wang J, et al. Detection of nonexudative choroidal neovascularization and progression to exudative choroidal neovascularization using OCT angiography. Ophthalmol Retina. 2019;3(8):629-36. 11. de Oliveira Dias JR, Zhang Q, Garcia JMB, et al. Natural history of subclinical neovascularization in nonexudative age-related macular degeneration using swept-source OCT angiography. Ophthalmology. 2018;125(2):255-66. 12. Issa PC, Gillies MC, Chew EY, et al. Macular telangiectasia type 2. Prog Retin Eye Res. 2013;34:49-77. 13. Dogan B, Erol MK, Akidan M, et al. Retinal vascular density evaluated by optical coherence tomography angiography in macular telangiectasia type 2. Int Ophthalmol. 2019;39(10):2245-56. 14. Nalcı H, Şermet F, Demirel S, et al. Optic coherence angiography findings in type-2 macular telangiectasia. Turk J Ophthalmol. 2017;47(5):279-84. 15. Villegas VM, Kovach JL. Optical coherence tomography angiography of macular telangiectasia type 2 with associated subretinal neovascular membrane. Case Rep Ophthalmol Med. 2017;2017:8186134. 16. Mrejen S, Spaide RF. Optical coherence tomography: imaging of the choroid and beyond. Surv Ophthalmol. 2013;58(5):387-429. 17. Shields CL, Kaliki S, Rojanaporn D, et al. Enhanced depth imaging optical coherence tomography of small choroidal melanoma: comparison with choroidal nevus. Arch Ophthalmol. 2012;130(7):850-6. 18. Shields CL, Shields JA. Clinical features of small choroidal melanoma. Curr Opin Ophthalmol. 2002;13(3):135-41. 19. Shields CL, Lim LAS, Dalvin LA, et al. Small choroidal melanoma: detection with multimodal imaging and management with plaque radiotherapy or AU-011 nanoparticle therapy. Curr Opin Ophthalmol. 2019;30(3):206-14. 20. Alshareef RA, Goud A, Mikhail M, et al. Segmentation errors in macular ganglion cell analysis as determined by optical coherence tomography in eyes with macular pathology. Int J Retina Vitreous. 2017;3:25. 21. Herro AM, Lam BL. Retrograde degeneration of retinal ganglion cells in homonymous hemianopsia. Clin Ophthalmol. 2015;9:1057-64. 22. Rajanala AP, Shariati MA, Liao YJ. Long distance retrograde degeneration of the retino-geniculo-cortical pathway in homonymous hemianopia. Ophthalmology. August 2019. [Epub ahead of print]. 23. Liu G, Volpe N, Galetta S. Liu, Volpe, and Galetta’s Neuro-Ophthalmology: Diagnosis and Management, 3rd Ed. Elsevier; 2018. 24. Blanch RJ, Micieli JA, Oyesiku NM, et al. Optical coherence tomography retinal ganglion cell complex analysis for the detection of early chiasmal compression. Pituitary. 2018;21(5):515-23 |