When diagnosing and managing posterior segment pathology, a wide variety of technologies aid us, including posterior segment imaging, neuroimaging and tests of visual function. Some conditions may be diagnosed and managed based on the clinical examination alone, but even in common conditions such as age-related macular degeneration (AMD) and diabetic retinopathy (DR), diagnostic imaging may show unique aspects of the disease that cannot be seen clinically. Additionally, more complicated pathologies often require a battery of tests to eliminate differentials and arrive at the correct diagnosis. Inspect the cases and examples below to see how diagnostic testing can be used to further understand a pathology or to arrive at a correct diagnosis or treatment plan.
Examine how newer technologies such as optical coherence tomography (OCT), fundus autofluorescence (FAF) and OCT angiography (OCT-A) have changed how we understand and visualize posterior segment pathology. Notice how advances in these technologies such as OCT with enhanced-depth imaging (EDI) and the ability to obtain widefield imaging in technology such as FAF is changing how we view the retina. Nevertheless, older diagnostic tools such as visual field testing, B-scan ultrasound, fluorescein angiography (FA) and indocyanine green angiography (ICGA) can still provide critical information.
 |
|
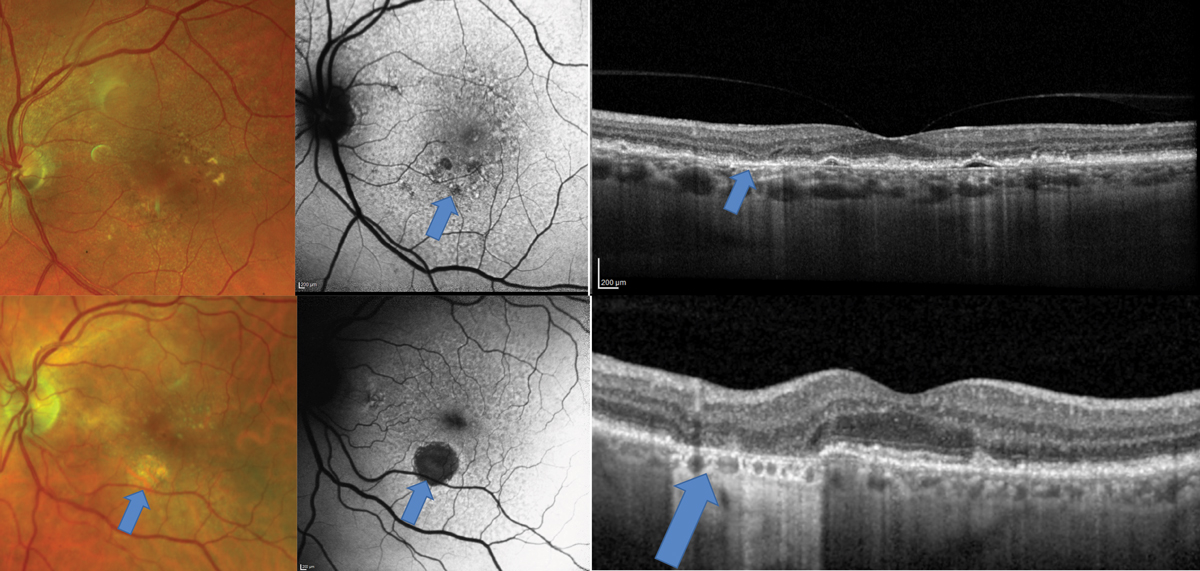
Fig. 1. AMD patient with a disc-shaped region of pigmentary abnormalities on clinical exam, also demonstrated on the FAF (top middle image). OCT shows an elongated pigment epithelial detachment (PED) with minimal evidence of overlying exudation such as subretinal or intraretinal fluid. OCT-A (top right), however, shows an extensive choroidal neovascular network underlying the PED. Click image to enlarge. |
 |
|
Fig. 2. Top images show a patient who would be categorized clinically as intermediate-stage AMD due to pigmentary changes. The FAF shows diffuse alterations to the RPE with areas of hypo-autofluorescence suggestive of early GA. In this region on the OCT, there is atrophy of the outer nuclear layer also suggestive of early GA. The bottom images show a patient with a frank area of GA that is visible clinically but seen even more easily with FAF. Click image to enlarge. |
Small but Mighty
Standard staging of AMD is based on clinical examination—primarily focusing on the size of macular drusen and the presence or absence of macular pigmentary changes.1 The AREDS1 trial determined that eyes with large-sized drusen (greater than 125µm) and/or pigmentary changes had increased risk of developing advanced-stage disease and benefited from vitamin supplementation.2 At the time, clinical examination and FA were the tools used to determine presence of advanced AMD with presence of choroidal neovascularization (CNV) or geographic atrophy (GA).
Now, the use of multimodal imaging—including OCT, OCT-A and FAF—provides us unique insight into who is at risk for progression to advanced-stage AMD and who may already show early signs of advanced disease. OCT and OCT-A allow for earlier detection of CNV, even occult or non-exudative CNV (Figure 1).3 OCT cross-section scans may show presence of sub- or intra-retinal fluid suggestive of exudative AMD that is not visible clinically. OCT-A may show the presence of vasculature in the outer retina or avascular zone suggestive of CNV that is not visible clinically, and may not even show signs of “fluid” on OCT.
OCT and FAF are of great use in identifying early regions of GA, which may be crucial if treatment for GA is approved in the future (Figure 2).4 OCT cross-section scans can be evaluated for atrophy of the outer retina including the outer nuclear layer and the retinal pigment epithelium (RPE). Additionally, increased reflectivity called “hyper-reflective columns” extending into the choroid may be signs of RPE atrophy on OCT cross-section scans. Areas of GA will show on an FAF as dark regions of hyporeflectivity.
 |
|
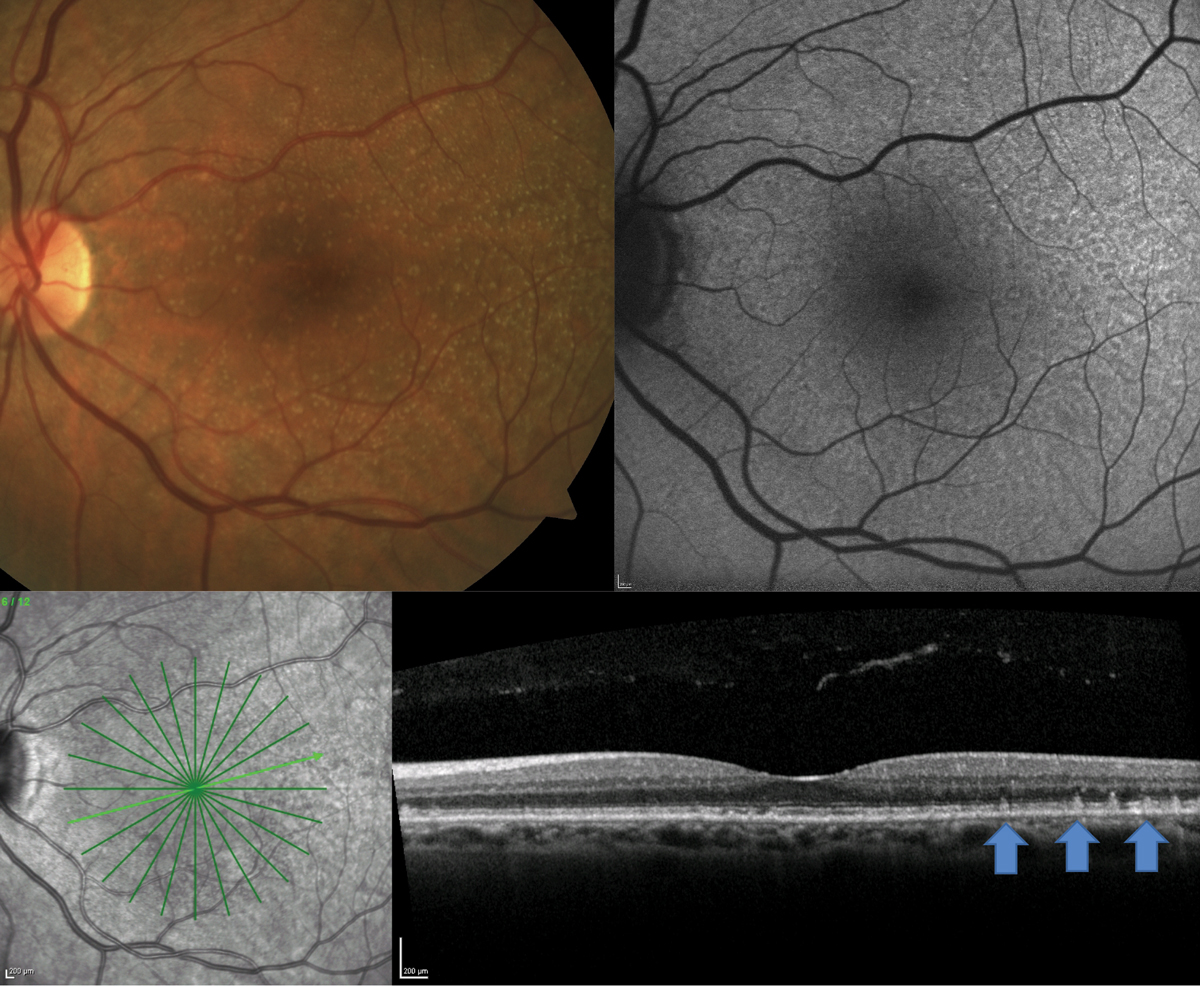
Fig. 3. A patient with clinically visible small- to medium-sized drusen shows presence of RPD on FAF and OCT. Click image to enlarge. |
OCT and FAF were particularly helpful in this case of a 70-year-old white male who presented for an AMD evaluation with 20/20 vision OU (Figure 3). On clinical examination, the patient had neither large drusen nor pigmentary changes. A 12-line radial OCT with EDI and FAF of the macula demonstrated the presence of reticular pseudodrusen (RPD). This is a particular phenotype of drusen that may be missed on clinical exam but is well visualized with OCT or FAF.
On OCT, RPD present as hyper-reflective projections on top of the RPE, and on FAF, they present as diffuse reticular alterations to the FAF signal.4 Identification of this phenotype is important as patients with RPD have even higher incidence of developing advanced-stage AMD (both CNV and GA) than patients with large drusen.5,6 In addition, they tend to have worse visual function, which could be evident on functional tests such as dark adaptation.7,8 Educate these patients heavily on the risk of conversion to advanced disease and monitor them more carefully.
 |
|
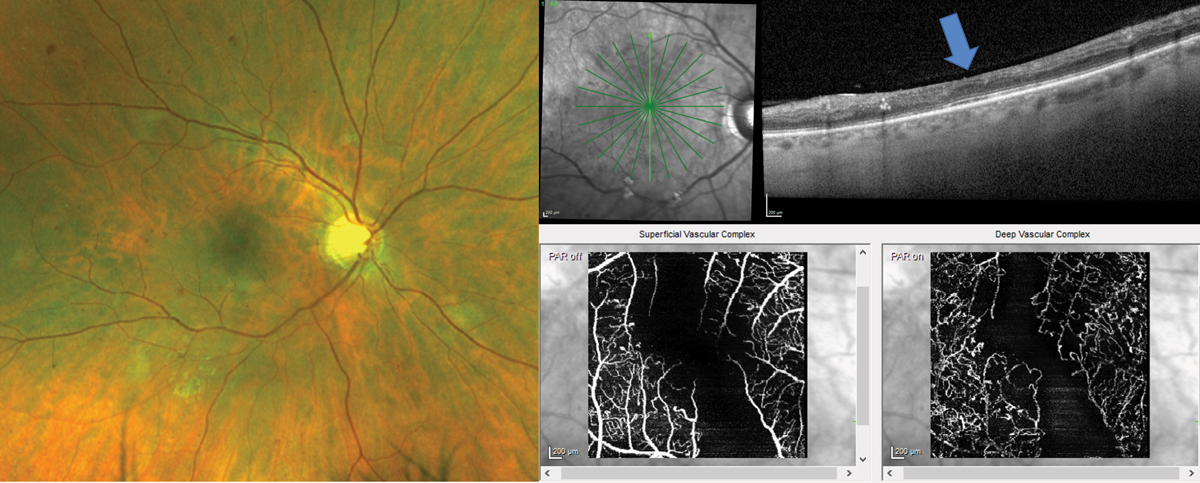
Fig. 4. Patient with clinically visible moderate nonproliferative DR with intraretinal hemorrhages, microaneurysms and cotton wool spots has diffuse inner retina thinning on the OCT cross-section scan (blue arrow shows position of the fovea). OCT-A confirms significant macular ischemia both in the superficial and deep capillary plexi that feed the inner retina. Click image to enlarge. |
 |
|
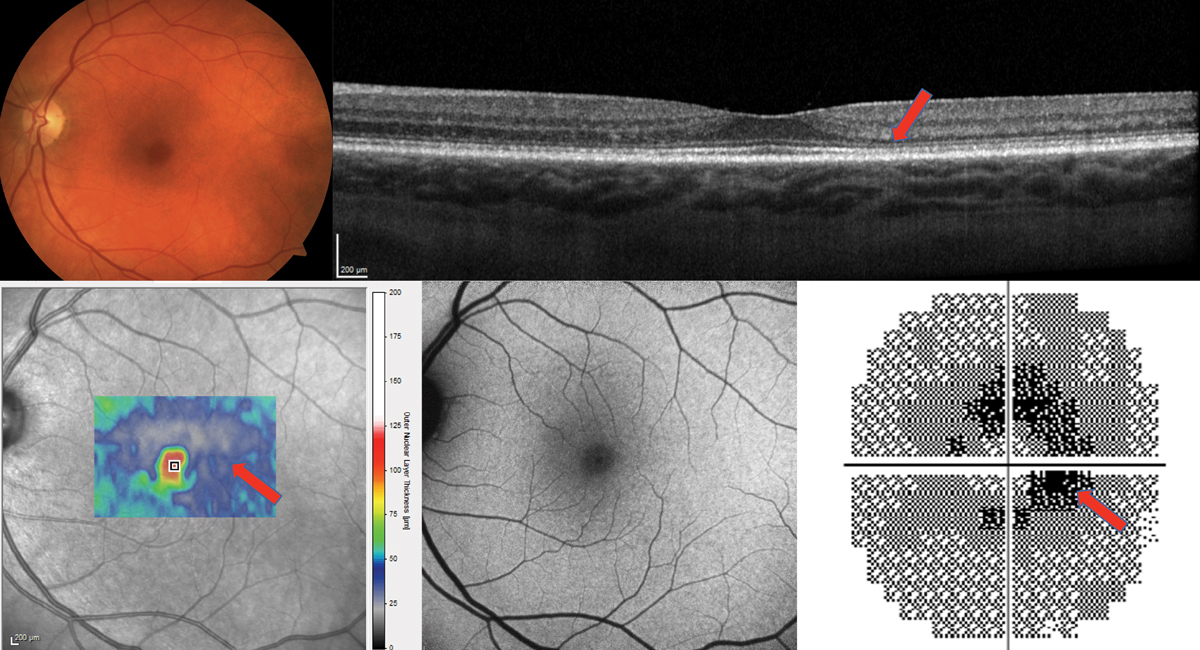
Fig. 5. The cross-section OCT shows a very thin outer nuclear layer, especially temporally (red arrow) but no frank loss of the photoreceptor integrity line. The thickness map of the ONL only also appears very thin (bottom left). The FAF is essentially normal. The 10-2 visual field shows a ring scotoma most dense nasally and is highly suggestive of plaquenil maculopathy. Findings were bilateral. Click image to enlarge. |
Stages of DR
DR, like AMD, is classically staged based on clinical examination.9,10 In addition, clinically significant macular edema, an essentially outdated term, judged presence of macular edema based on clinically visible thickening of the retina. Since these categorizations, OCT and OCT-A have been developed and give us a wealth of information regarding diabetic retinopathy that cannot be visualized with fundus exam alone.
For example, patients may have presence of diabetic macular edema on OCT that is not visible clinically. OCT cross-section scans may also show regions of inner retinal thinning suggestive of capillary non-perfusion.11 OCT-A may show microvascular alterations that are not detected clinically, including macular ischemia, and can be helpful to distinguish intraretinal microvascular abnormalities from retinal neovascularization.12
 |
|
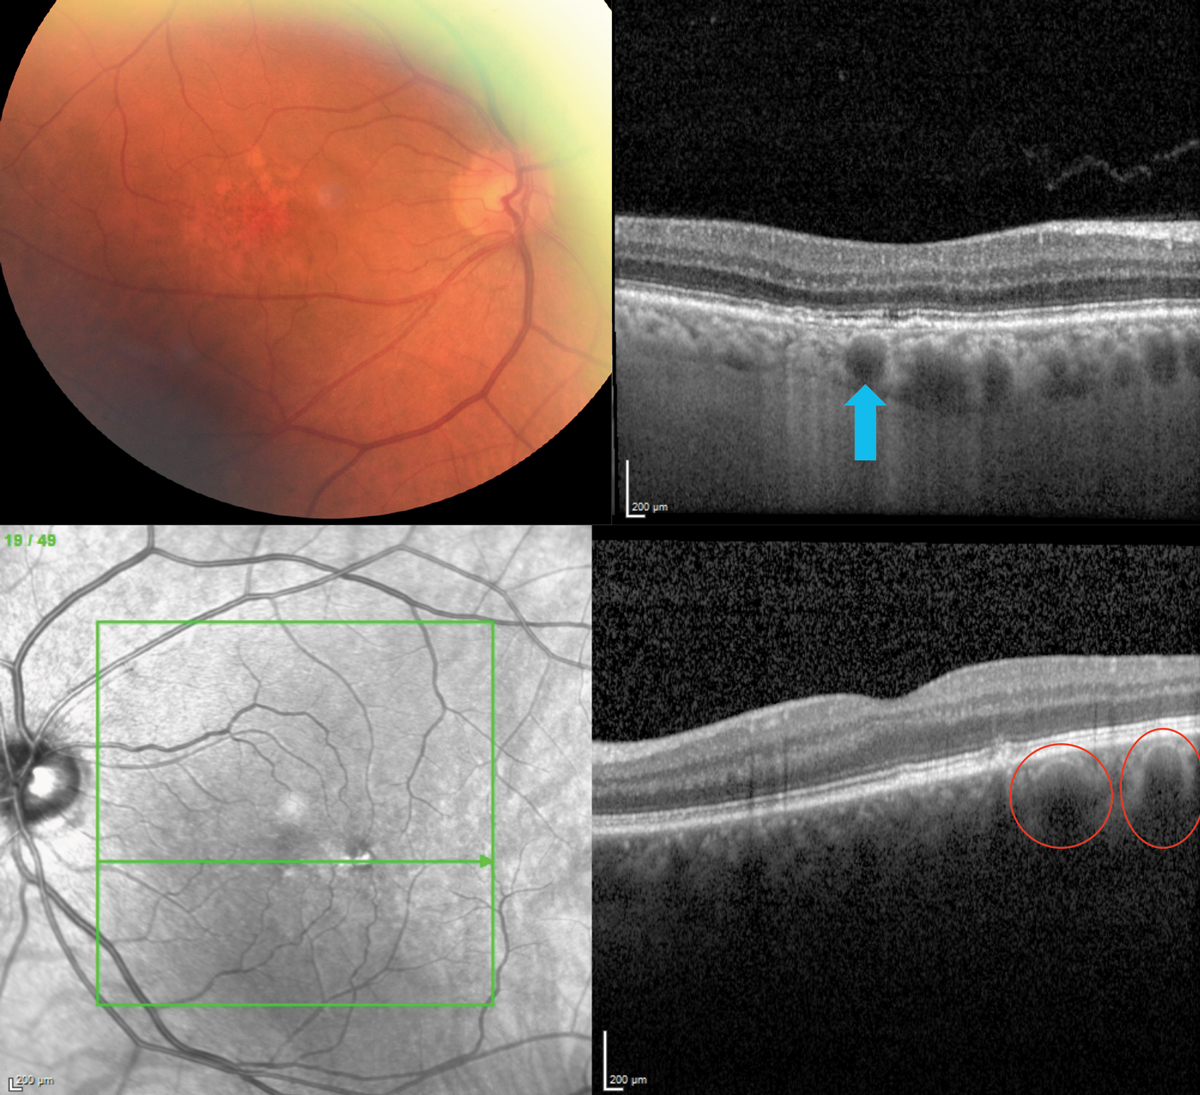
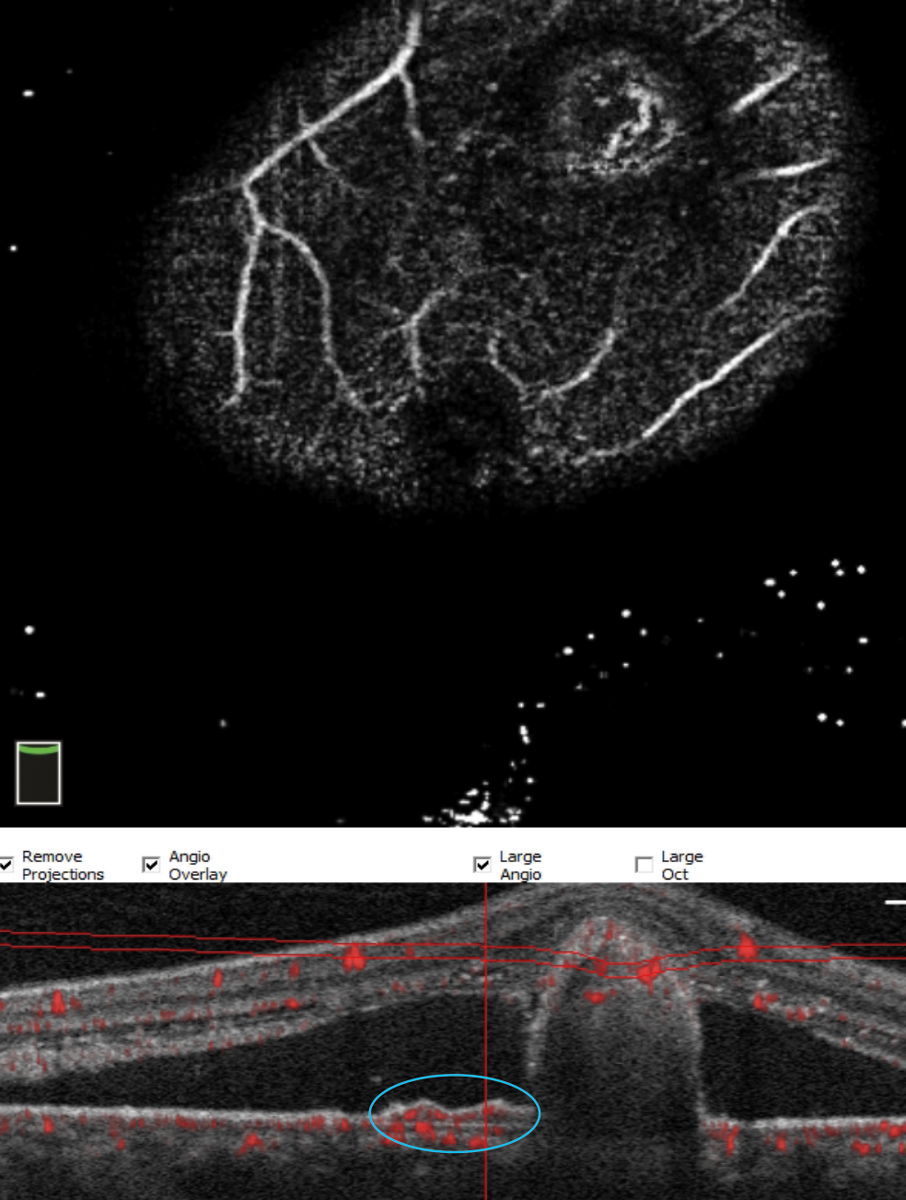
Fig. 6. A well-delineated pachyvessel (top; blue arrow) and several adjacent ones in a patient with RPE disruption mimicking AMD (bottom), a 72-year-old Caucasian on AREDS2 for AMD. Note the thickened choroid (which should be thinner in AMD) and two pachyvessels (red circles), one of which is just below the RPE disruption. Click image to enlarge. |
OCT and OCT-A were of great use in diabetic retinal vascular damage in a 37-year-old male type 2 diabetic for 10 years who funduscopically presented with moderate nonproliferative DR with presence of intraretinal hemorrhages, cotton wool spots and microaneurysms (Figure 4). The patient had poor blood sugar control with a most recent A1c of 10%. The patient complained of blurry vision OD even with his new glasses and was correctable to only 20/30 OD.
A 12-line radial OCT without EDI was performed showing significant inner retinal thinning, especially in the vertical meridian (Figure 4). Inner retinal atrophy on OCT in a diabetic patient should raise alarm for potential macular ischemia.11 A 10º x 10º OCT-A was taken to evaluate the central macula vasculature confirming significant atrophy of both the deep and superficial vascular plexus.12 These findings could not be visualized clinically and suggest more advanced and significant disease. The level of ischemia is likely the cause of the patient’s reduced visual acuity and symptoms. The patient was counselled regarding the finding and need for strict blood sugar control. In addition, the patient should be followed more closely for potential complications, such as retinal or iris neovascularization. It was recommended for the patient to have a widefield FA to evaluate peripheral retinal nonperfusion and rule out presence of clinically undetectable retinal neovascularization.
 |
|
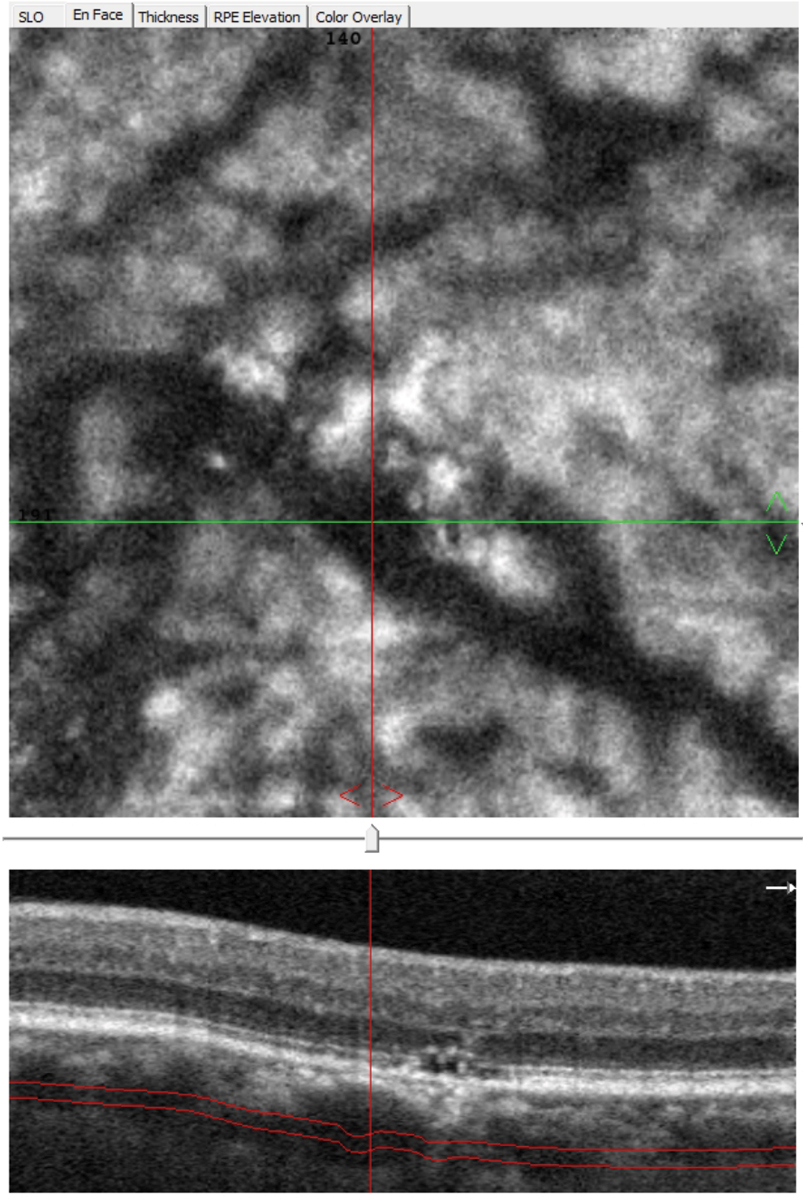
Fig. 7. En face OCT-A allows viewing at different depths and can highlight pathologically dilated choroidal vessels (pachyvessels), which typically show an abrupt termination vs. gradually tapering. Click image to enlarge. |
Keeping it Old School
With new technologies such as OCT, OCT-A and FAF that can give us a plethora of information in a few short minutes or even seconds, we sometimes fail to acknowledge when older technologies such as visual field testing can still be useful.
Patients who take hydroxychloroquine (HCQ) must be monitored for macular toxicity, and current guidelines from the American Academy of Ophthalmology still recommend that patients have annual testing with both SD-OCT and visual field annually after five years of medication use.13 Patients with increased risk for toxicity should be seen annually following initiation of HCQ. Adjunct tests such as FAF and multifocal electrogram may also be considered. Classically 10-2 visual field testing has been recommended either with white or red stimuli, but recently it is recommended that those of Asian descent have 24-2 visual field testing as findings may present more peripherally and not in the parafoveal region.13
Figure 5 shows the importance of continued visual field testing for a 172lb female patient who had been taking HCQ 200mg BID for 20 years for rheumatoid arthritis. She had no history of kidney or liver disease. OCT showed no frank loss of the photoreceptor integrity line but was suspicious for parafoveal outer nuclear layer thinning. Is this toxicity or a variation of normal? FAF was essentially normal with no red flags raised. The most convincing evidence for toxicity was the 10-2 visual field that showed repeatable bilateral ring scotomas. This along with the OCT finding and the high risk for toxicity at 20 years of medication use made it a must to advise the rheumatologist to discontinue the medication.
 |
|
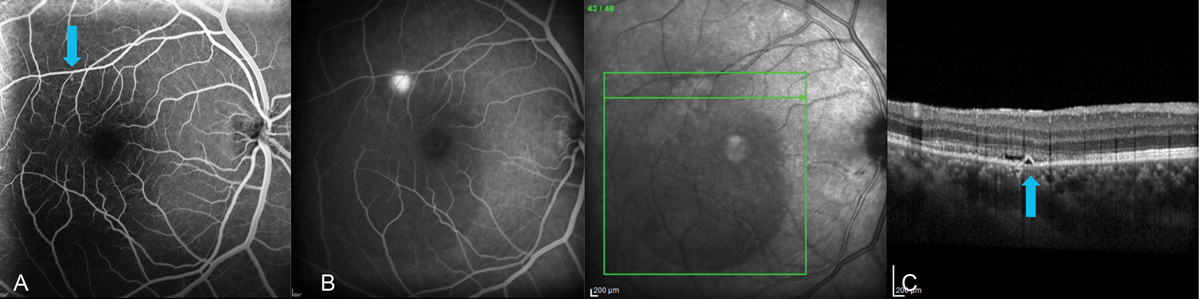
Fig. 8. Multimodal imaging of a 34-year-old male with CSC. (A) FA in the early phase highlights the triangular-shaped PED found on spectral-domain OCT (blue arrows). (B) Late-phase FA shows leakage from this area, confirming an RPE microrip. Note the centrally diminished choroidal fluorescence in late phase due to the large serous RD. (C) EDI SD-OCT (Spectralis, Heidelberg) showed choroidal thickness of about 500µm with a triangular-shaped PED and neurosensory RD, the latter of which increased as it got closer to the fovea. Multimodal testing altered the initial treatment plan of observation to one of referral for laser treatment. FA allows for visualization of the area of leakage that can be targeted with laser treatment. This cannot be seen with OCT or OCT-A. Click image to enlarge. |
 |
|
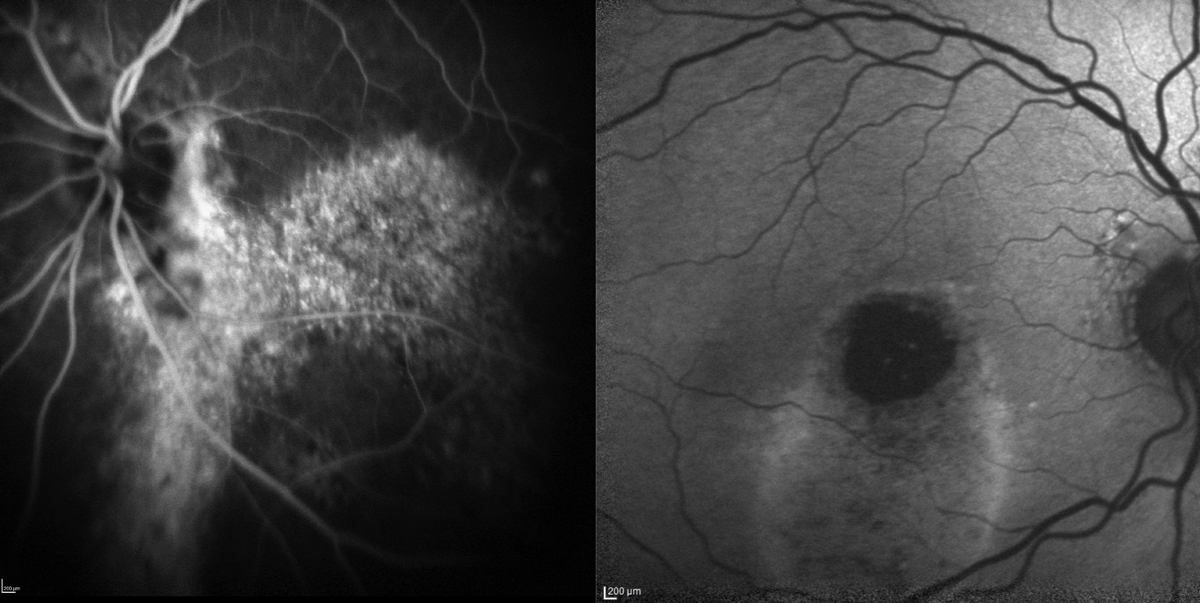
Fig. 9. Chronic serous detachment from CSC leading to RPE disruption shown by FA (left) and FAF (right) in two different patients. FAF is very useful with CSC patients and can shed some light on the condition’s chronicity with the discovery of gravitational tracts due to shifting subretinal fluid. Click image to enlarge. |
 |
|
Fig. 10. FA doesn’t give a detailed view of choroidal pathology (left) due to the molecule’s small size and ability to seep through choriocapillaris fenestrations, as well as a shorter excitation wavelength that gets blocked by the RPE. ICGA (right) employs a larger molecule that is protein-bound and excites in the infrared range, therefore reaching the deeper structure. In this patient with polypoidal choroidal vasculopathy, or aneurysmal type 1 neovascularization, the BNVs can be seen with a dendritic-like pattern (red circle). The “hot-spot” (blue arrow), which is pathognomonic for PCV, denotes the condition’s polyp. These findings are not well-visualized with FA (left). Click image to enlarge. |
The Plot Thickens
For years, the B-scan ophthalmic ultrasound offered the only multimodal glimpse of the choroid, albeit a low resolution one. Because of this, separating it from the surrounding retina and sclera was impossible. This, of course, changed with the availability of OCT, and more specifically, the 2008 description of EDI.14 By focusing the instrument forward, the researchers captured inverted but detailed high resolution images of the choroid.
 |
|
Fig. 11. With significant pathology, OCT-A sometimes has trouble segmenting. Here, manual manipulation of the scan identifies the polyp. These represent further growth of the BVN under the shallow RPE detachment (double layer sign, blue circle) and continuing to proliferate on the undersurface of the RPE detachment. Click image to enlarge. |
Using this technique provided a fresh look at this structure and led to one publication on pachychoroid pigment epitheliopathy (PPE) and an introduction of the “pachychoroid spectrum.”15 The article’s title represented the first entity, followed by central serous choroidopathy (CSC), pachychoroid neovasculopathy (PNV) and finally polypoidal choroidal vasculopathy (PCV), also known as aneurysmal type 1 neovascularization. Later, focal choroidal excavation and peripapillary pachychoroid syndrome (PPS) were added to the spectrum. The pachychoroid phenotype is not completely understood. It may result from choroidal vascular hyperpermeability, which leads to choroidal thickening, compression of the choriocapillaris and subsequent ischemic damage to the RPE and outer retina.
But even after several years, some practitioners have yet to embrace and properly vet the spectrum, leaving them vulnerable to misdiagnosing conditions such as AMD and placing patients on costly, unneeded supplements.
This occurred with two patients who were previously diagnosed with AMD and prescribed AREDS2 (Figure 6). In both cases, an EDI-OCT (Spectralis, Heidelberg Engineering) revealed a thickened choroid with pachyvessels, which are pathologically dilated structures that can also be seen with OCT-A (Figure 7). RPE and outer retinal damage typically occur just above the pachyvessel. These presentations are consistent with PPE.
Persistent damage can disrupt the RPE barrier and allow fluid to seep into the subretinal space which causes a serous retinal damage and signifies CSC (Figure 8). Chronic serous detachments can lead to advanced RPE disruption (Figure 9). PNV consists of a type 1 neovascularization and a shallow RPE detachment known as the “double-layer” sign (Figure 10). PNV lacks extensive hemorrhage and exudate, unlike PCV, which has branching vascular networks (BVNs) and polyp formation on the undersurface of a much larger RPE detachment (Figures 10 and 11).
 |
|
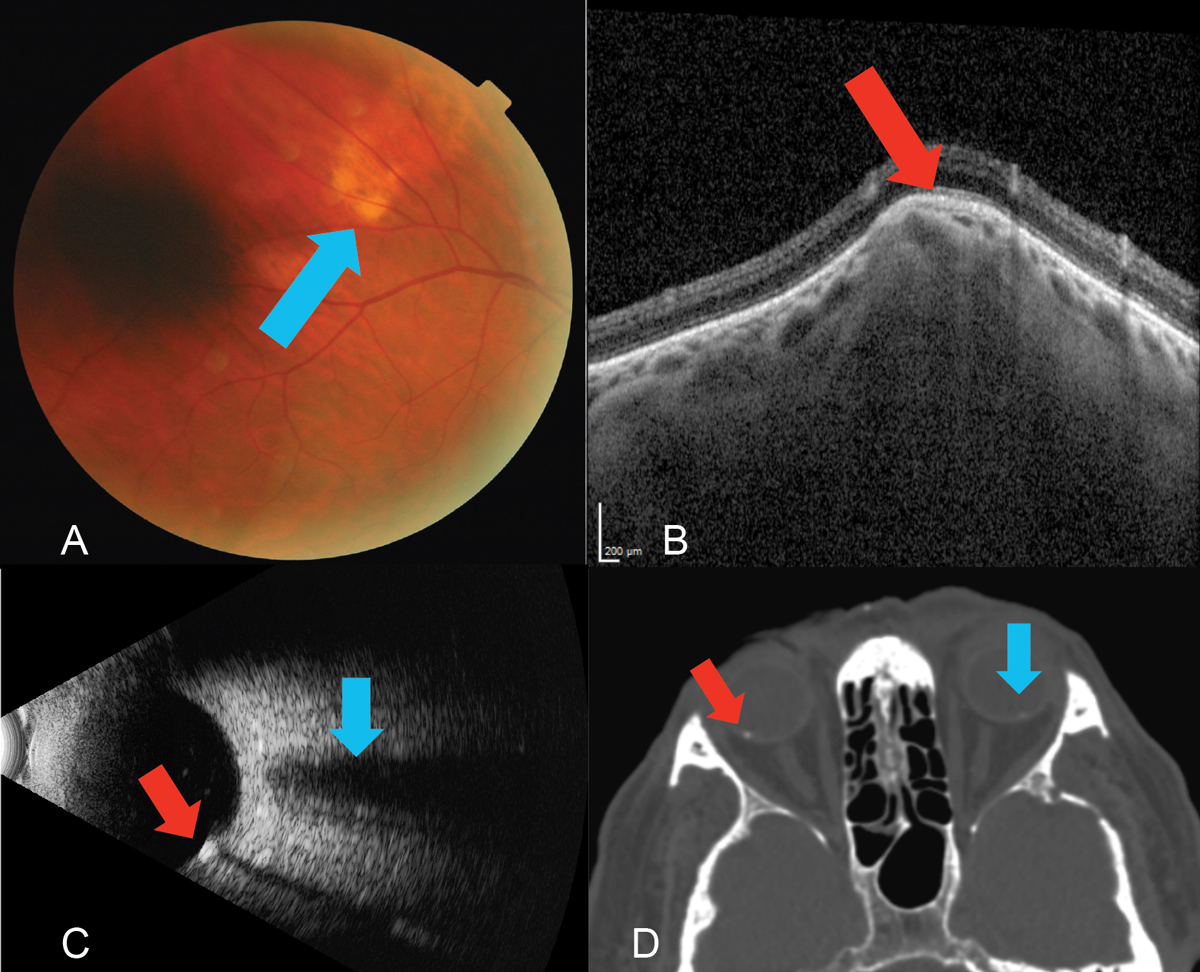
Fig. 12. (A) Fundus photo of the yellow, subretinal lesion (blue arrow) located in the superior temporal quadrant of the right eye. (B) EDI-OCT (Spectralis, Heidelberg) through the SCC reveals a type 2 “rolling” lesion. Note the choroidal thinning above the lesion (red arrow). (C) B-scan ultrasound using the 10MHz probe highlights the echo-dense SCC (red arrow) with acoustic orbital shadowing which appears much smaller but similar to the optic nerve which is shown above this area (blue arrow). A choroidal melanoma would demonstrate low to medium internal echoes. (D) A previously ordered CT scan on a patient with SCC of the right eye (red arrow) and a subtle one in the left (blue arrow), which was not visible on clinical exam. Though not necessary in this case, sometimes radiological testing can be a form of multimodal imaging. Click image to enlarge. |
 |
|
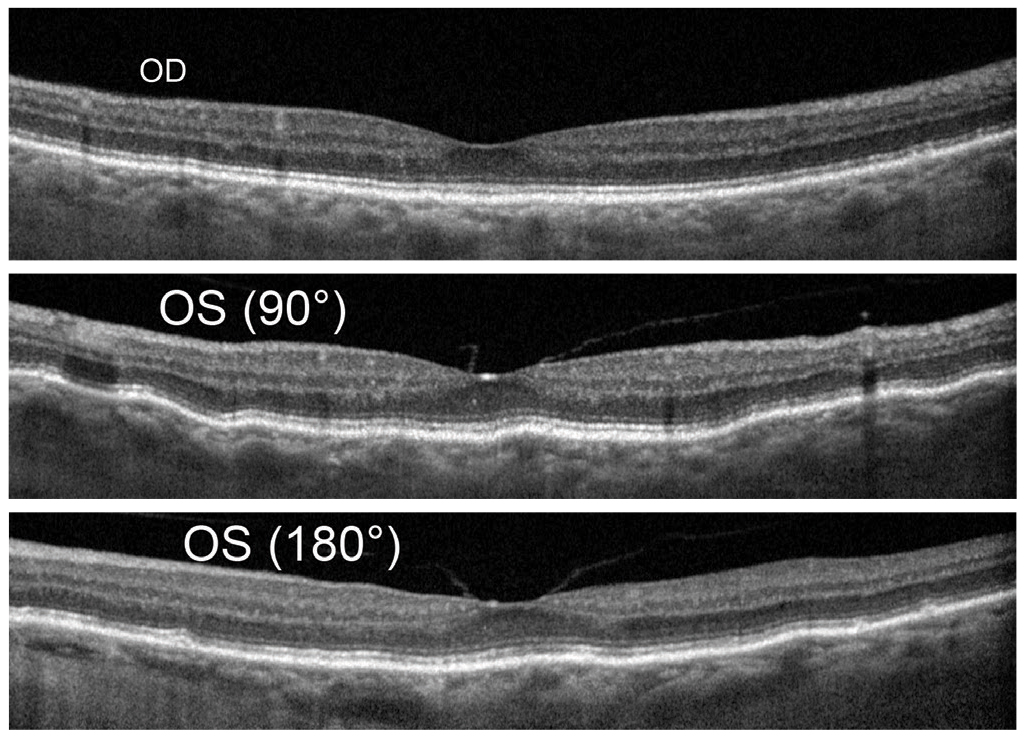
Fig. 13. Baseline OCT shows OD (top) mild disruption of the RPE however normal macular contour and choroidal thickness. OS (middle and bottom) shows mild choroidal folds that are typically more visible in vertical scan line as seen here. Mild flattening of foveal pit by vitreomachular adhesion and traction and similar choroidal thickness as compared with OD. Click image to enlarge. |
The B-side of Multimodal Imaging
For those who practiced in the pre-OCT era, the B-scan ophthalmic ultrasound represented one of the only—and possibly earliest—forms of multimodal imaging. A choroidal melanoma, for instance, possesses distinct ultrasonographic properties, including acoustic hollowness with low to medium internal reflectivity.16 Knowing this allows the practitioner to differentiate between a suspicious finding and something more benign.
 |
|
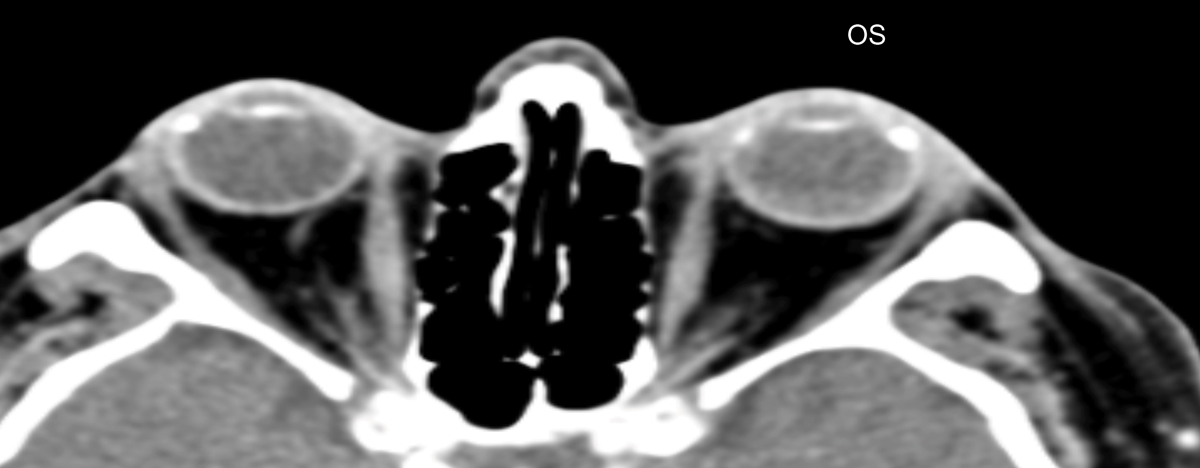
Fig. 14. Previously performed CT scan shows normal orbit and globe OU. Click image to enlarge. |
In this case, a 69-year-old Caucasian male presented with an elevated, yellow, subretinal lesion outside the superior temporal arcade OD (Figure 12A). An EDI-OCT through the area demonstrated choroidal thinning above the lesion (Figure 12B). B-scan ultrasonography highlighted an echo-dense placoid mass with acoustic orbital shadowing resembling the presence of two optic nerves (Figure 12C).
Sclerochoroidal calcification (SCC) is a deposition of calcium within the sclera. They present as single or multiple, round focal lesions along the superior temporal arcades most commonly seen in the elderly as an incidental finding. SCCs appear pale yellow, white or orange and can be flat or up to 6mm in height.17 One study analyzed 179 eyes of 118 patients with SCC and found the vast majority to occur in Caucasians (98%) with a mean age of 69 (32 to 95 range) and a 60:40 female-to-male ratio.18 The worst statistic, however, was the abysmal rate of practitioners who diagnosed the condition correctly (5%).18 Interestingly, these can be picked up on computed tomography (CT) imaging (Figure 12D).
 |
|
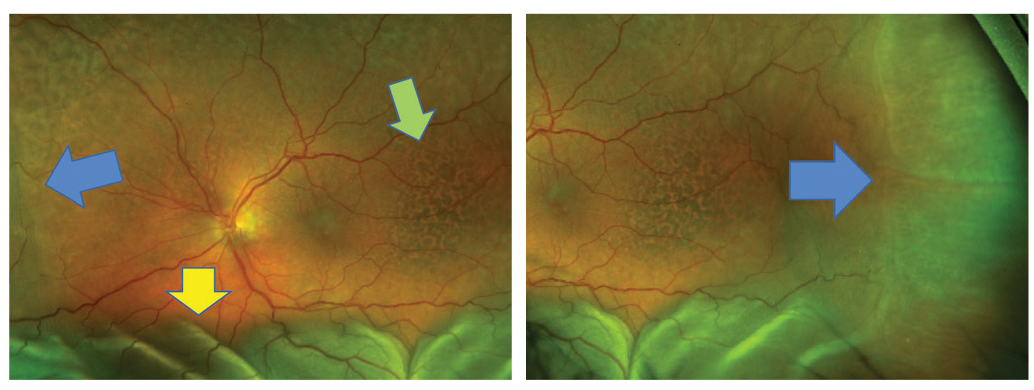
Fig. 15. Choroidal detachment in the left eye (blue arrow). Serous RD (yellow arrow) and pigmentary changes (green arrow) are also shown. Click image to enlarge. |
A Diagnosis of Exclusion
When discussing imaging technologies, many should also consider the utility of non-ophthalmic procedures that might help determine a patient’s diagnosis or etiologic factors of their conditions. Examples include carotid ultrasound or magnetic resonance imaging (MRI)/CT imaging, cardiac imaging and neuroimaging by CT or MRI.
The final diagnosis of this case was made by an MRI of the orbit. A 79-year-old white female returned with recent vision loss of her left eye. Her ocular history was remarkable for asymptomatic unilateral choroidal folds OS, which were detected four years ago and had been stable until her recent presentation (Figure 13). No underlying etiology was discovered for the choroidal folds, and due to the stability and asymptomatic nature including a “normal” CT, no further investigation was pursued (Figure 14).
 |
|
Fig. 16. Widefield FAF shows extensive pigmentary alteration of the left eye. Click image to enlarge. |
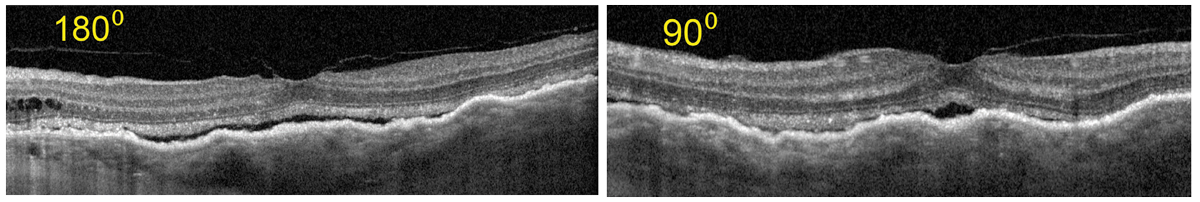 |
|
Fig. 17. OCT shows Increased choroidal thickness and folds as compared with the baseline OCT. Also, subretinal fluid as the result of serous RD is notable. Click image to enlarge. |
 |
|
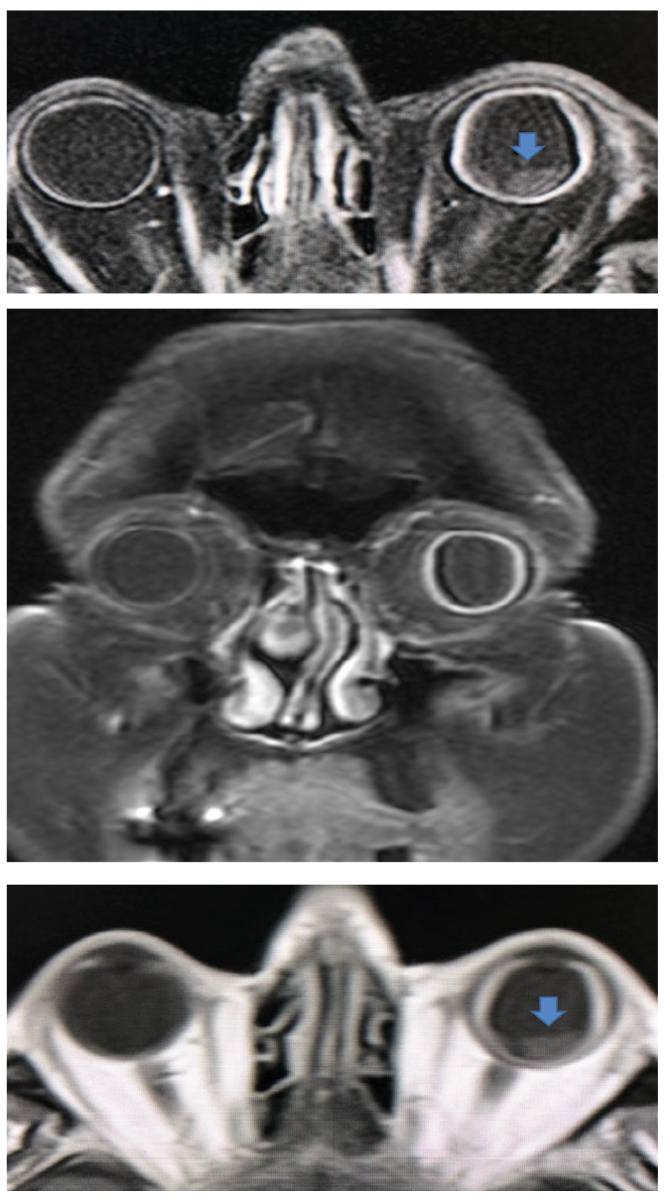
Fig. 18. Coronal (middle) and sagittal (top and bottom) with and without enhancement shows a difference in scleral thickness of the left vs the right eye. In the sagittal views, the presence of detached areas can be seen (blue arrow). Click image to enlarge. |
On this visit, her visual acuity OS had dropped from 20/20 to 20/70. Her intraocular pressures (IOPs) were 16mm Hg OU which was in the range of prior visits. All entrance testing and anterior segment findings were normal, but the left eye fundus exam had drastically changed. There was evidence of choroidal and serous retinal detachment (RD), (Figure 15) and an unusual pigmentary presentation seen more drastically by widefield FAF (Figure 16). OCT also revealed drastic changes as compared with the baseline examination (Figure 17).
Concerned with a neoplastic association or causation, the care team ordered a thin-slice MRI of the orbit, which then showed absence of neoplasm. However, an extremely thick scleral wall of the left eye as compared with the normal right eye (Figure 18). This finding lead to the diagnosis of uveal effusion syndrome (UES).
UES is a rare syndrome with no specific risk factors, usually found in otherwise healthy adults and is essentially a diagnosis of exclusion. There are three forms of the disease. Type 1 seen in nanopthalmic eyes (short axial length and usually hyperopic), type 2 seen with normal axial length and clinically abnormal sclera and type 3 with normal axial length and clinically normal sclera. Types 2 and 3 are thought to be the result of congenital scleral anatomy or abnormality.
Associated signs and symptoms are blurred vision, normal to elevated IOP, detachment of the choroid and ciliary body, serous RD with no or minimal inflammatory findings and localized areas of hypertrophy or hyperplasia of the RPE known as “leopard spots.”19,20 Ultrasound biomicroscopy and MRI are useful in diagnosis by measuring the scleral thickness.21 The patient underwent typical surgical management known as sclerectomy or scleral window.22 This resulted in resolution of the choroidal folds and detachment as well as the serous RD and vision improvement to 20/25 (Figure 19).
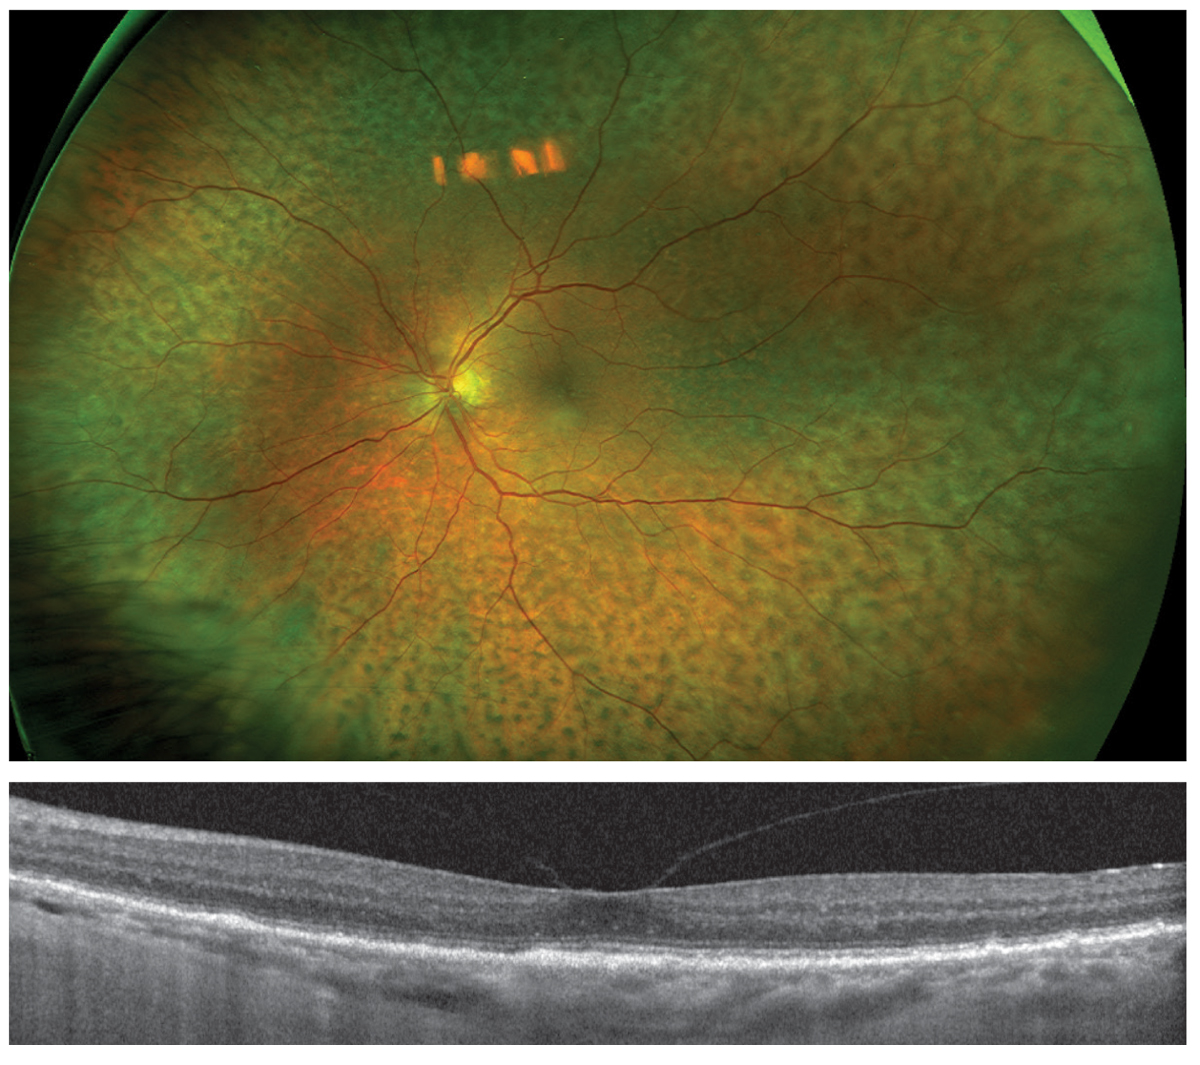 |
|
Fig. 19. One year post-op, fundus photography (top) shows persistent pigmentary change but complete resolution of choroidal and retinal detachments. OCT (bottom) shows resolution of subretinal fluid, normalized choroidal thickness and absence of choroidal folds. Click image to enlarge. |
Conclusions
Each technology available provides a unique insight into retinal structure and function. Multimodal imaging and use of ancillary tests of visual function may paint a clearer picture of the pathological process. More difficult cases may require extensive testing to rule out potential differentials and arrive at the correct diagnosis. It is crucial for the provider to be aware of the benefits of each technology to best diagnose and manage posterior segment disease.
Dr. Haynes is a consultative optometrist at the Charles Retina Institute in Germantown, TN and consulting faculty at Southern College of Optometry in Memphis, TN. She is a paid speaker for Heidelberg Engineering and a consultant for Notal Vision.
Dr. Williamson is the residency supervisor at the Memphis VA Medical Center and consulting faculty at Southern College of Optometry. He has no financial disclosures.
Dr. Rafieetary is a consultative optometric physician at the Charles Retina Institute. He is on advisory boards for Heidelberg Engineering, Optos, Regeneron, Notal Vision and Spark Therapeutics.
1. Ferris FL, Davis MD, Clemons TE, et al. A simplified severity scale for age-related macular degeneration. Arch Ophthalmol. 2005;123(11):1570. 2. Age-Related Eye Disease Study Research Group A-REDSR. A randomized, placebo-controlled, clinical trial of high-dose supplementation with vitamins C and E, beta carotene and zinc for age-related macular degeneration and vision loss: AREDS report no. 8. Arch Ophthalmol. 2001;119(10):1417-36. 3. Bailey ST, Thaware O, Wang J, et al. Detection of nonexudative choroidal neovascularization and progression to exudative choroidal neovascularization using OCT angiography. Ophthalmol Retin. 2019;3(8):629-36. 4. Ly A, Nivison-Smith L, Assaad N, Kalloniatis M. Fundus autofluorescence in age-related macular degeneration. Optom Vis Sci. 2017;94(2):246-59. 5. Joachim N, Mitchell P, Rochtchina E, Tan AG, Wang JJ. Incidence and progression of reticular drusen in age-related macular degeneration: findings from an older Australian cohort. Ophthalmology. 2014;121(4):917-25. 6. Gil JQ, Marques JP, Hogg R, et al. Clinical features and long-term progression of reticular pseudodrusen in age-related macular degeneration: findings from a multicenter cohort. Eye (Lond). 2017;31(3):364-71. 7. Ooto S, Ellabban AA, Ueda-Arakawa N, et al. Reduction of retinal sensitivity in eyes with reticular pseudodrusen. Am J Ophthalmol. 2013;156(6):1184. 8. Querques G, Massamba N, Srour M, Boulanger E, Georges A, Souied EH. Impact of reticular pseudodrusen on macular function. Retina. 2014;34(2):321-9. 9. Wu L, Fernandez-Loaiza P, Sauma J, Hernandez-Bogantes E, Masis M. Classification of diabetic retinopathy and diabetic macular edema. World J Diabetes. 2013;4(6):290-4. 10. Wong TY, Sun J, Kawasaki R, et al. Guidelines on diabetic eye care: the international council of ophthalmology recommendations for screening, follow-up, referral and treatment based on resource settings. Ophthalmology. 2018;125(10):1608-22. 11. Sim DA, Keane PA, Fung S, et al. Quantitative Analysis of diabetic macular ischemia using optical coherence tomography. Invest Opthalmol Vis Sci. 2014;55(1):417. 12. Khadamy J, Abri Aghdam K, Falavarjani KG. An update on optical coherence tomography angiography in diabetic retinopathy. J Ophthalmic Vis Res. 2018;13(4):487-97. 13. Recommendations on screening for chloroquine and hydroxychloroquine retinopathy (2016 Revision). Ophthalmology. 2016;123(6):1386-94. 14. Spaide R, Koizumi H, Pozonni M. Enhanced depth imaging spectral-domain optical coherence tomography. Am J Ophthalmol. 2008;146(4):496-500. 15. Warrow D, Hoang Q, Freund B. Pachychoroid pigment epithelopathy. Retina. 2013;33(8):1659-72. 16. Shields C, Lim L, Dalvin L. Shields J. Small choroidal melanoma: Detection with multimodal imaging and management with plaque radiotherapy or AU-011 nanoparticle therapy. Curr Opin Ophthalmol. 2019;30(3):206-14. 17. Wong CM, Kawasaki BS. Idiopathic sclerochoroidal calcification. Optom Vis Sci. 2014;91(2):32-7. 18. Shields C, Hasanreisoglu M, Saktanasate J, et al. Sclerochoroidal calcification: clinical features, outcomes and relationship with hypercalcemia and parathyroid adenoma in 179 eyes. Retina. 2015;35:547-54. 19. Gass JD, Jallow S. Idiopathic serous detachment of the choroid, ciliary body and retina (uveal effusion syndrome). Ophthalmology. 1982;89(9):1018-32. 20. Elagouz M, Stanescu-Segall D, Jackson TL. Uveal effusion syndrome. Surv Ophthalmol. 2010;55(2):134-45. 21. Lam A, Sambursky RP, Maguire JI. Measurement of scleral thickness in uveal effusion syndrome. Am J Ophthalmol. 2005 Aug; 140(2):329-33. 22. Bondar Z, Mruthyunjaya P. Management of uveal effusion syndrome. Retina Today. Sept 2018:18-22. |