Take Charge of GlaucomaFollow the links below to read other articles from our four-part glaucoma series: |
Today’s diagnostic technology is growing rapidly; not long ago, time-domain optical coherence tomography (TD-OCT) revolutionized the way we looked at certain ocular conditions such as glaucoma. Now, affordable high-resolution spectral-domain OCT (SD-OCT) performs everything from retinal nerve fiber (RNFL) to ganglion cell analysis (GCA), and even non-contact pachymetry and anterior segment angle evaluation, depending on the instrument. Here’s a look at traditional and innovative glaucoma diagnostics and how to incorporate them into daily clinical practice.
 |
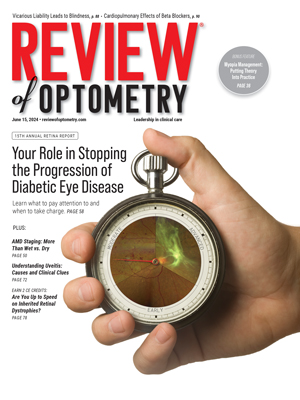
| Fig. 1. Color fundus photo (A) of the right optic nerve shows mild superior thinning, while the left (B) shows noticeable superior, temporal and inferior thinning. Red-free photos show loss of the bright RNFL pattern superiorly in the right (C) and both superiorly and inferiorly, extending temporal, in the left (D). Click images to enlarge. |
A Timeless Triad
Visual field testing, Goldmann applanation tonometry (GAT) and systematic optic nerve evaluation are the three classic tests that synergistically help diagnose primary open-angle glaucoma (POAG) early and detect glaucomatous progression.
Pressure
POAG care continues to be based on the concept that higher intraocular pressures (IOPs) are a significant risk factor for both the development and the progression of the disease. Several population-based studies show the prevalence of POAG increases as IOP increases and reducing IOP lowers the rate and incidence of glaucomatous progression.1-6 Nonetheless, an IOP greater than 21mm Hg is a relatively arbitrary measure and is a poor screener for diagnosing glaucoma on its own.
Clinicians should take several IOP measurements, especially in patients with normal tension glaucoma, as each measurement is a brief snapshot of the overall diurnal IOP range and likely does not fully represent the peak pressures often found during the nighttime hours and while in the supine position.7 Repeat IOP measurements will help the clinician to better understand the patient’s potential risk for progression.8-10
Despite IOP’s utility in glaucoma management, as many as 50% of patients within the “normal” 10mm Hg to 21mm Hg range have glaucoma.11 One study more aptly describes glaucoma as “a group of progressive optic neuropathies characterized by degeneration of retinal ganglion cells and resulting changes in the optic nerve head.”12 This broader understanding calls for an equally broader approach to glaucoma evaluation that includes not only IOP, but also optic nerve head (ONH) and visual field testing.13
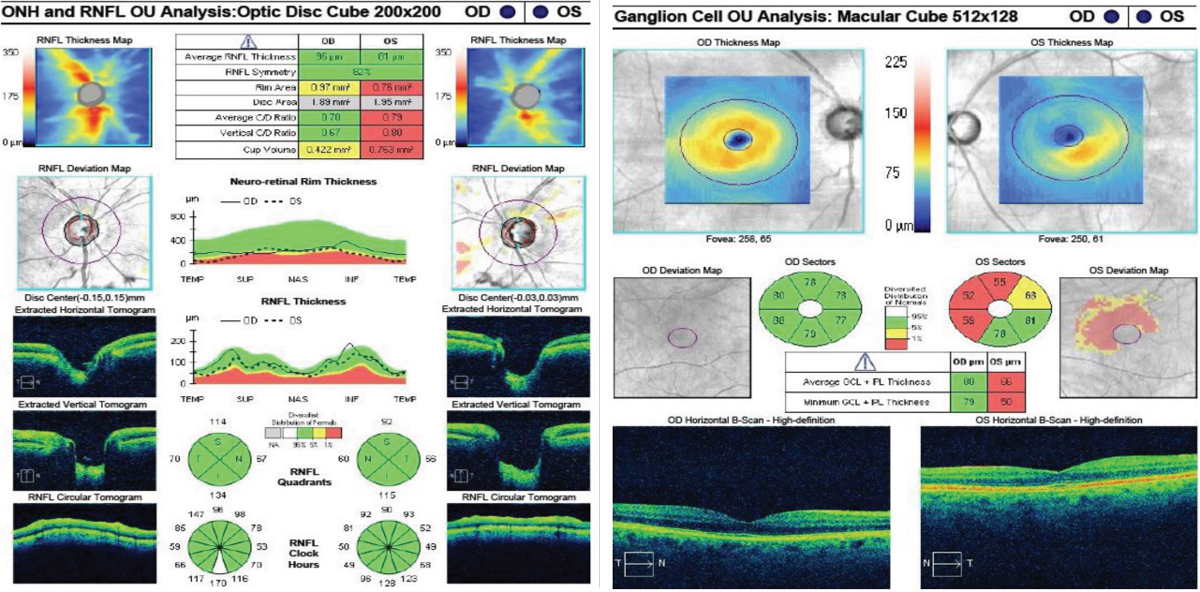 |
| Fig. 2. At left, the RNFL thickness map shows mild superior thinning in the right eye, and notable superior and inferior thinning in the left. The deviation map shows focal superior and temporal thinning in the right. The left is significantly thinner compared with the right average thickness and the superior, inferior and temporal quadrants and wedges. Despite the RNFL showing green in these sections, structural thinning is evident. In the GCC at right, the right eye is within normal limits, whereas the left shows notable thinning to the average GCL thickness, minimum GCL thickness and to the inferior nasal, superior nasal and superior sectors. There is also mild thinning in the superior temporal sector. Click images to enlarge. |
Structure
Research has identified several key quantitative and qualitative optic nerve features that clinicians should systematically evaluate with dilated fundus photography.14-20 Some of the most significant of these morphological features include:
Optic disc and cup. The size of the optic disc correlates directly with the size of the optic cup and the neuroretinal area—thus, a large cup in a large disc may be normal, while an average cup in a small disc may suggest glaucomatous damage.21,22 Optic disc size is also affected by racial differences: people of African descent are known to have larger nerves, followed by Asians and Hispanics, with Caucasians having relatively smaller nerve sizes.21,22
The normal shape of the optic disc is a slightly vertical oval (the vertical disc diameter is about 7% to 10% larger than the horizontal diameter) while the normal shape of the optic cup is horizontally oval, making the normal neuroretinal rim usually the broadest in the inferior and superior disc regions. When considered as a single variable, glaucoma susceptibility is mostly independent of the optic disc shape, but the ISNT rule (optic nerves typically show a larger rim width inferior, superior, nasal and then temporal) can help differentiate pseudo glaucomatous nerves from early glaucoma.22,23
Neuroretinal rim. There is preferential loss of neuroretinal rim in the inferior and superior optic disc regions in early glaucoma, temporal rim loss in moderate glaucoma and nasal inferior then nasal superior in advanced glaucoma.22 The sequence of this preferential neuroretinal sector rim loss correlates with the progression of visual field defects. In addition, neuroretinal rim pallor is a common clinical endpoint of several different non-glaucomatous optic neuropathies and neurological diseases. In cases where the pallor extends beyond the cupping, additional bloodwork, imaging or both may be necessary.24-26
Optic disc hemorrhages. These subtle, transient and easily missed findings are an important risk factor for the development of glaucoma in patients with ocular hypertension, are a risk factor for glaucoma progression and are a significant predictor of visual field loss, with a faster rate of visual field progression.5,27-30
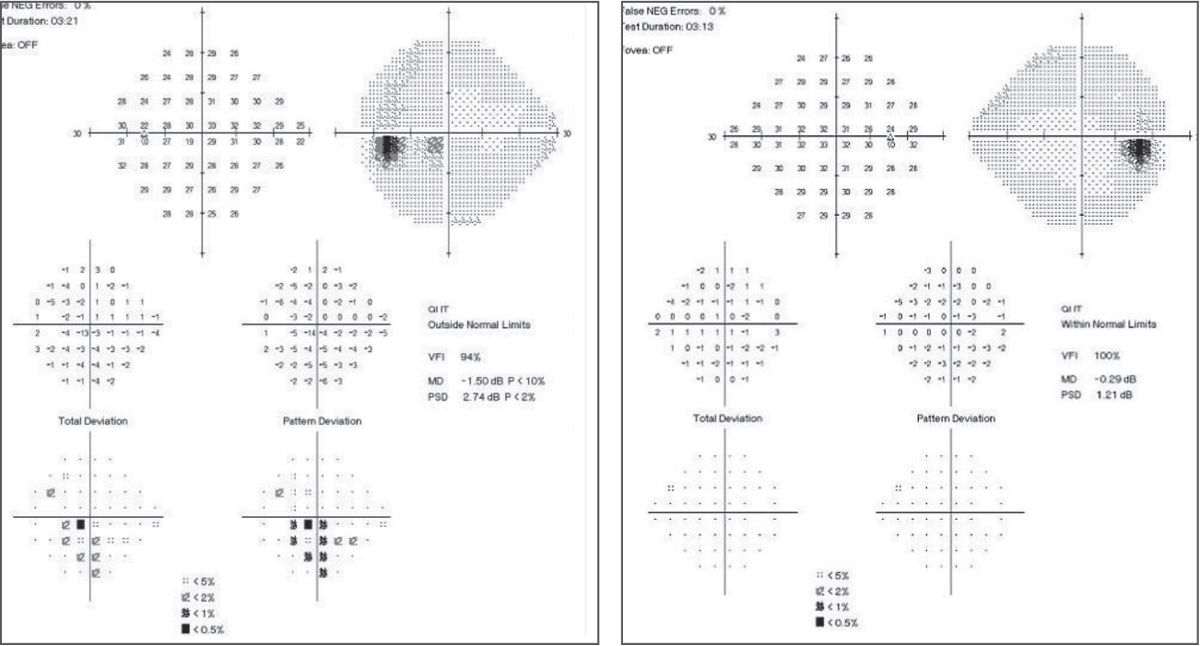 |
| Fig. 3. In the baseline 24-2 SAP, the left eye shows an inferior arcuate close to fixation with central involvement. The right eye shows a normal baseline SAP 24-2. Click images to enlarge. |
Retinal nerve fiber layer (RNFL). Defects in this layer are some of the earliest signs of glaucoma and are most commonly found in the inferior temporal and superior temporal sectors of the optic nerve.22,31 Research shows a seven- to eight-fold greater risk of future visual field loss if glaucomatous RNFL defects are noted at baseline.32
Function
Reliable baseline visual field testing, traditionally captured with standard automated perimetry (SAP), is essential to monitor for any functional glaucomatous progression, and clinicians should obtain at least two reliable visual fields in the first six months, or three if the patient exhibits a high lifetime risk of visual disability.33,34 One study suggests six visual fields in the first two years can help to rule out rapid progression and establish baseline data.35 The American Optometric Association clinical guidelines and the American Academy of Ophthalmology Preferred Practice Patterns are both consistent with these recommendations, while also highlighting the importance of customized visual field testing frequency for each patient.36,37
Follow-up should be based on the risk of progression and, if progression is noted, the estimated rate of progression, in addition to risk factors for further progression, stage of disease and life expectancy.34
Clinicians should also consider 10-2 visual field testing in all stages of the disease—especially with normal tension glaucoma—to more frequently detect glaucomatous macular involvement that is often undiagnosed (or underestimated) with standard 24-2 or 30-2 testing.38-41
The 24-2 threshold visual field pattern tests a total of 54 points, each of which are each six degrees apart. Twelve of the points tested are within the central 10 degrees, and only four of these points are tested within the macular region, which accounts for more than 30% of the total retinal ganglion cells (RGCs) and more than 60% of the visual cortex area.42 By comparison, the 10-2 threshold visual field pattern tests 68 points that are all two degrees apart and one degree from either side of the horizontal and vertical meridians.38
Technologies on the HorizonMany new tools finding their way into research are providing novel metrics for understanding glaucomatous damage and progression: OCT angiography (OCT-A). This noninvasive imaging technology analyzes retinal, macular and ONH microcirculation. Evidence suggests reduced blood supply in the optic nerve and peripapillary region of glaucoma patients, and a correlation may exist between the severity of the disease and the degree of the reduced blood flow.1-3 The most common test parameters used in glaucoma patients include vascular density within the ONH, peripapillary retina and macula, as well as flow index of the optic disc.1,4-6 Currently, most platforms currently in use do not have a normative database to compare these parameters. One of the largest OCT-A studies found peripapillary and disc vascular densities were significantly lower in open-angle glaucoma than suspects and healthy eyes.7 Other researchers show lower total and temporal ONH vessel densities in glaucomatous eyes. These reduced densities strongly correlated with OCT, visual field mean deviation (MD) and visual field index (VFI).3,8 Corneal hysteresis (CH). This represents the cornea’s ability to bend, flex and absorb biomechanical stress from applied pressure. Several studies show that increased CH (>9mm Hg), measured with the Ocular Response Analyzer (Reichert), allowed the cornea to absorb intraocular stresses caused by high-low diurnal IOP fluctuations.9,10 At times when CH is >9mm Hg, mechanical stress is reduced at the level of the lamina cribrosa and optic nerve, and less glaucomatous neuropathy was seen in these patients.9,10 In contrast, study participants who possessed low CH (<9mm Hg) were at increased risk for developing glaucomatous optic neuropathy.9,11-13 Factors that contribute to low CH include thin CCT, age, elevated IOP and increased HbA1C.9,14 Although research has a long way to go in better understanding CH’s role in glaucoma, clinicians may one day measure CH as part of routine glaucoma care and follow up.15 Electroretinogram (ERG). Three types of ERG exist: full-field (ffERG), multifocal (mfERG) and pattern (pERG). ffERG tests the entire retina, including all rod and cone function; mfERG provides a topographic map of cone function; and pERG evaluates RGC function, as does the photopic negative response (PhNR).16-18 Studies agree that PhNR correlates with GCC thickness, but has lower diagnostic ability than that of GCC OCT.18-22 PhNR and pERG are the most common ERG techniques used in glaucoma diagnostics, but pERG has been more established in clinical research.19,20 Studies investigating pERG in glaucoma suspects agree that it was beneficial in early stage disease, but less in moderate-to-advanced stages due to amplitude saturation. Other research shows a severe reduction in amplitude before structural RNFL thinning occurred. They also detected glaucomatous changes four years before it was confirmed on SAP.20-21 Before implementing ERG into clinical practice, clinicians must weigh the cost and benefit of the test, especially considering current literature suggests OCT still overtakes ERG in diagnostics.16-24
|
Overlooked Techniques
Gonioscopy, an oft-ignored yet vital skill, helps clinicians determine the type of glaucoma and individualize the treatment plan, particularly for the one-in-four patients with secondary glaucoma.43
In addition, measuring a patient’s central corneal thickness (CCT) can help inform the treatment plan as well, considering the Ocular Hypertension Treatment Study revealed, independent of IOP, a strong correlation between CCT in ocular hypertensive patients and conversion to open-angle glaucoma. The researchers found subjects in the thinnest CCT subgroup (<558µm) were three times more likely to convert to glaucoma than those within the thickest CCT subgroup (≥588µm).44 Therefore, patients with CCT <558µm are at the greatest risk of conversion and should be monitored closely.
The Advanced Toolbox
As our understanding of glaucoma grows, so do the technologies we can use to detect and manage it. While not a part of the traditional triad, OCT can help assess for longitudinal structural change in all stages, especially in early and pre-perimetric glaucoma. It also provides quantitative and noninvasive objective measurements of the macular ganglion cell complex (GCC), peripapillary RNFL and ONH parameters. One study found RNFL OCT detected damage in approximately one-third of glaucoma patients up to five years before the appearance of the earliest visual field defects.45
 |
| Fig. 4. Repeat SAP 24-2 of the left eye show a deep central defect close to fixation within the central 10 degrees. |
 |
| Fig. 5. Baseline 10-2 SAP of the left eye shows a deep central scotoma spatially correlating to the focal defect seen on 24-2. |
RNFL OCT. Studies suggest the age-related rate of change for average RNFL thickness ranges between -0.16µm/year and -0.44µm/year.46 One particular study showed an average RNFL loss of -0.52µm/year: -1.35µm/year in the superior quadrant and -1.25µm/year in the inferior quadrant.46 When greater than these values, or when noticeable changes are seen on the RNFL thickness map, clinicians must determine if the change is due to inter-visit glaucomatous structural loss or intrasession noise or test-retest variability.46,47 The most reliable approach to address RNFL loss is to examine serial changes and rate of change.46 The RNFL OCT has a guided progression analysis (GPA) option, providing a longitudinal analysis of average, inferior and superior RNFL thickness measurements. Furthermore, a rate of change option is measured in µm/year. For baseline images, we recommend taking two RNFL OCTs on the initial visit to complete the GPA and rate of change analysis on follow up.
RNFL results should supplement the evaluation of the optic nerve and is not meant to replace functional SAP testing. OCT technology has its limitations, including each machine’s limited normative database, intrasession noise causing reduced signal strength, inaccurate test-retest variability and artifacts.47 OCT longitudinal monitoring and serial testing is the best way to monitor these patients.
GCC OCT. The macular region is another confirmed site for initial glaucomatous damage.48-51 RGCs and axons constitute 30% to 35% of retinal macular thickness and almost 50% of RGCs are within the macula.42,46,48 This indicates using GCC OCT for monitoring all stages of glaucoma, ocular hypertension and suspects. GCC becomes essential in moderate-advanced glaucoma, when RNFL thickness reaches its floor effect (around 50µm), as it can’t detect structural change in these stages. Likewise, GCC is useful in cases of anomalous ONH, high myopia or both.52 Studies show GCC OCT’s diagnostic ability in glaucoma is comparable with that of RNFL thickness.46,48-51 Furthermore, other studies show GCC OCT of glaucoma suspects and pre-perimetric glaucoma participants detected thinning before functional loss.53-55
Putting it All Together: a Teaching Case
A 70-year-old white male presented for a routine new patient eye exam with no vision or health complaints. He provided little detail of any ocular history, but he denied a family history of glaucoma. His medical history was normal and he denied taking medications. His best-corrected visual acuity was 20/20 OD and OS, pupils were equally round and reactive to light with no afferent pupillary defect, confrontation visual fields were full to finger count and extraocular muscles were unrestricted in all gazes.
IOPs were 19mm Hg OD and 20mm Hg OS. Anterior segment evaluation was unremarkable. The anterior chamber was deep and quiet, and the anterior chamber angles were 4/4 by Van Herick. On dilated exam, the media of the lens showed trace nuclear sclerosis and no pseudoexfoliation.
Fundus examination revealed a clear vitreous, macula that was flat with even pigment, an arterial-venous ratio of 2/3 and a peripheral retina that was flat and intact with no pathology noted.
The optic nerves had a cup-to-disc ratio of 0.55 OD and 0.75 with peripapillary atrophy OS (Figure 1). There was mild superior neuroretinal rim thinning OD and notable superior, temporal and inferior thinning OS. No Drance hemorrhage, pallor, spontaneous venous pulsation (SVP) or loss of perfusion was seen. A higher risk for glaucoma exists when no SVP is observed.56 The optic nerves were 1.9mm OD and 2.0mm OS, and the optic disc and cup had normal shape. The central retinal vessel trunk was centered OD and decentered superior nasal OS, which has a strong correlation to central visual field loss for all glaucoma severities.57
RNFL and GCC OCT findings (Figure 2) supplemented and agreed with the clinical findings of superior thinning OD and advanced superior and inferior thinning OS.
We chose to obtain additional IOP measurements and baseline visual fields before initiating treatment. Upon follow up one month later for 24-2 SAP testing, gonioscopy, IOP and pachymetry, the patient brought his old eye exam records, which showed an untreated maximum IOP of 25mm Hg OD and 27mm Hg OS. The patient stated he hadn’t returned for follow-up care. At this visit, IOP was 22mm Hg OU, and gonioscopy was open to ciliary body 360 degrees, had normal pigment and no angle recession, peripheral anterior synechiae or neovascularization of the angle. Pachymetry was 520µm OD and 510µm OS. With these clinical findings, the patient was diagnosed with POAG.
On baseline SAP 24-2 baseline, the glaucoma hemifield test (GHT) was within normal limits OD and outside normal limits OS (Figure 3). All findings had a strong structure-function relationship with previous evaluations and testing. Based on these findings, treatment was initiated with latanoprost QHS OS, and the patient was scheduled to return in six weeks for repeat visual field testing and IOP check.
The patient returned with untreated IOP of 19mm Hg OD and treated IOP of 14mm Hg OS. On repeat 24-2 testing, OS showed improvement from baseline and the GHT was borderline (Figure 4). Due to a depressed central defect, a 10-2 SAP of the OS was acquired (Figure 5), which show a deep central scotoma involving fixation. Here, 24-2 SAP greatly underestimated the depth of this central scotoma, and performing 10-2 SAP exposed the depth of this functional deficit.
The patient was followed closely, and we initiated treatment in the right eye six months later due to a repeatable inferior nasal step, which correlated to the superior thinning on baseline.
Drs. Fisher, Lifferth and Carter are attending optometrists at The Villages VA Outpatient Clinic, in The Villages, Fla. Dr. Stursma is an attending optometrist at the Ocala Community Based VA Outpatient Clinic in Ocala, Fla.
1. Sommer A, Tielsch JM, et al. Relationship between intraocular pressure and primary open angle glaucoma among white and black Americans: the Baltimore Eye Survey. Arch Ophthalmol. 1991;109:1090-5. |