41st Annual Technology ReportFollow the links below to read other articles from annual update on technology: Retool Your Office Tech to Boost Efficiency Reality Check: Protecting Ocular Health from Headset Hazards |
Optical coherence tomography angiography (OCT-A) is a relatively new, noninvasive imaging technique that obtains images in rapid succession and evaluates for changes to examine retinal and choroidal blood flow. The technology also captures retinal and choroidal structure as well as vascular function and, when superimposed, allows more direct clinical correlation. This information can help clinicians diagnose and treat many retinal conditions such as age-related macular degeneration (AMD), diabetic retinopathy, vein occlusions and other retinal vascular diseases. Here’s a look at how this new diagnostic technology can augment your clinical acumen.
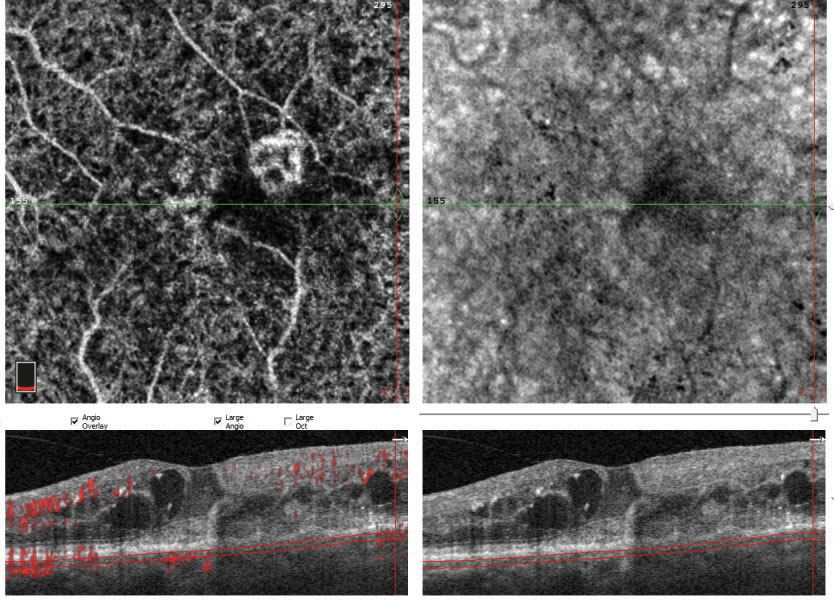 |
| Fig. 1. This patient’s initial lesion (above) regressed substantially after three injections (below) but more injections were recommended to see if it could be reduced even further. |
 |
AMD
This condition is currently the leading cause of irreversible vision loss in adults older than age 50, and approximately 11 million people are currently diagnosed with AMD in the United States alone. With increased life expectancy, this number is expected to double by 2050.1 Although only roughly 10% are the wet—or exudative—form, these account for the vast majority of severe vision loss and legal blindness.1
For years, the standard for evaluation of AMD and associated choroidal neovascular membranes (CNVM) has been fluorescein angiography (FA). However, this only provides a two-dimensional resolution of the retinal and choroidal vasculature and does not visualize underlying vasculature obscured by fluid, hemorrhage, retinal pigment epithelium (RPE) detachments or other areas of hyperfluorescence.2 In addition, the modality itself can present a similar problem: the leakage of dye in an FA may obscure underlying vasculature; the dye can also pool, as in a pigment epithelial detachment, leading lead to an obscured view as well.
Traditional FA poorly visualizes the choroidal vasculature, as the hyperfluoresence is blocked by RPE pigment. Further, the procedure involves injection of a dye that may have adverse effects ranging from nausea and vomiting to anaphylactic reactions and, rarely, death.
OCT-A is easier and faster to acquire than FA, does not require injections and provides cross-sectional and en face images of retinal as well as choroidal features, allowing three-dimensional visualization of choroidal neovascular lesions.
Diagnosis. OCT-A technology allows us to evaluate not only the size of the CNVM lesion, but also its relative depth in the retina. With this new knowledge, we now know that not all CNVMs are the same. Three primary subtypes exist. Type 1 lesions arise from the choroid, penetrate Bruch’s membrane and invade the RPE. Type 2 lesions also originate from the choroid but infiltrate between the RPE and the retina. Type 3 lesions, also called retinal angiomatous proliferation lesions, likely arise from downward proliferation of the deep plexus layer of retina vessels to the RPE. Each of these may respond better or worse to treatment, depending on its morphologic features. Improved imaging of these lesions with OCT-A may soon lead to a better understanding of the best treatment patterns based on morphologic features.3
 |
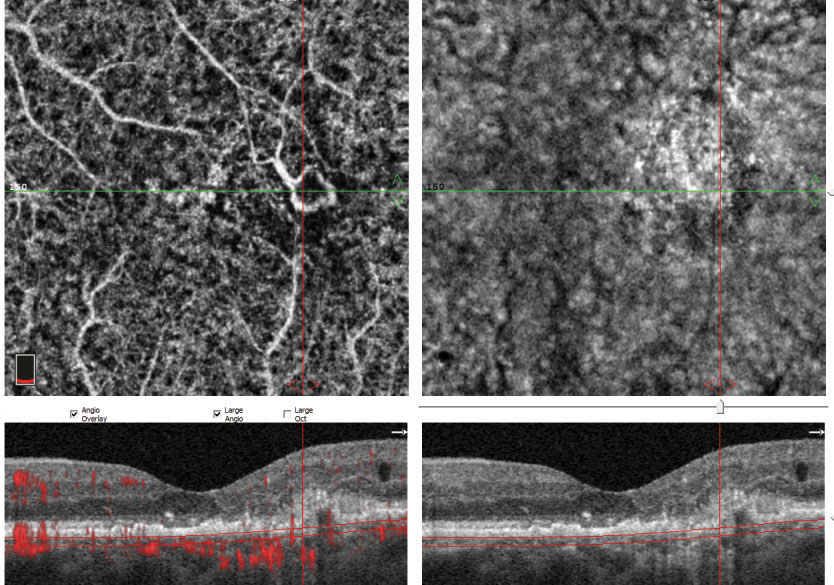
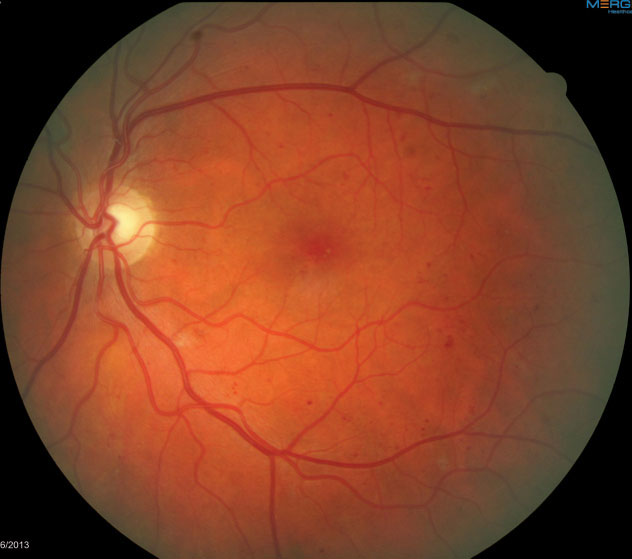
Fig. 2. The apparent hemes in this patient’s right macula (left) are suggestive of new-onset CNVM. Several small, scattered drusen are present in the left macula (right). |
Type 1 CNVM lesions can be further broken down based on OCT-A appearance. One study described two clinical distinctions: a “medusa” form, representing about 55% of all lesions, where vessels radiate in all directions from a large feeder vessel; and a “sea-fan” form, about 25% of all presentations, where the majority of smaller vessels radiate from one large feeder vessel. The rest of the membranes did not have smaller vessels. However, the study found these different morphologic patterns were not predictive of the rate of RPE detachments, atrophy or the number of injections needed to treat.4
Type 2 CNVM lesions are described as either “ medusa-shaped” or “glomerulus-shaped,” and are characterized by intertwined vessels with interspersed hypodensity.5 Currently, it is unclear whether these different morphologies noted on OCT-A will aid in treatment.
OCT-A also allows specialists to identify and diagnose subclinical CNVM, although much debate exists as to whether these inactive lesions need treatment or close monitoring until exudation appears. Patients with subclinical CNVMs were found to have a much higher rate of exudation over the course of a year—almost 15-fold higher than eyes without such lesions.6 Therefore, close monitoring of these subclinical lesions is a must to treat at the first sign of true exudation.
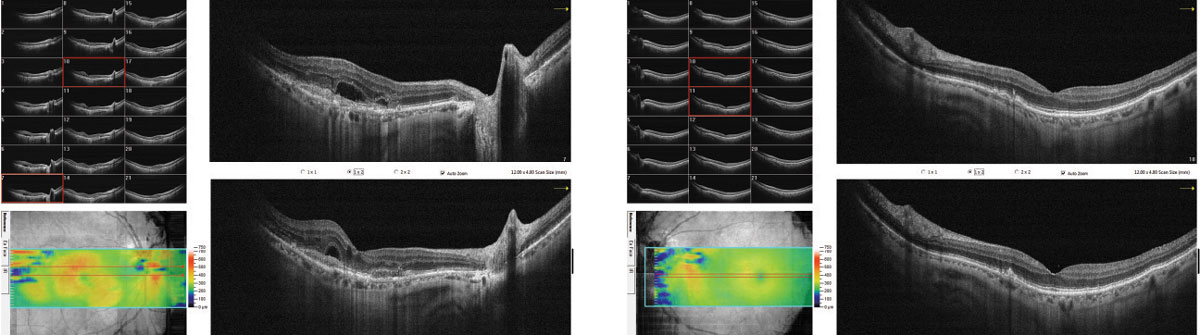 |
| Fig. 3. The patient’s raster OCT shows subretinal fluid and apparent CNVM in the right eye and drusen and RPE disruption without subretinal fluid in the left. |
Treatment. OCT-A can be useful beyond diagnosis and may be integral to monitoring response to treatment. Repeat OCT-A after a series of anti-vascular endothelial growth factor (VEGF) injections can provide useful information and help clinicians decide if additional treatment is warranted (Figure 1).
OCT-A can be useful in differentiating exudative AMD from masquerading conditions such as central serous retinopathy (CSR) and polypoidal choroidal vasculopathy. The presence or absence of a CNVM deep in the choroidal space is instrumental in the differential diagnosis between CSR and wet AMD, as the clinical course carries a far different visual prognosis for the patient.7
Case example. An 81-year-old Hispanic male presented to the clinic reporting a black spot in the right eye for about a month. The patient had been to the clinic nine months prior and diagnosed with Stage 2 dry AMD, with 20/25 OU acuity. He was counseled on the importance of supplementation—advice he did not take, for unclear reasons. The patient also has Type 2 diabetes with no retinopathy. Upon examination the second time, his vision was reduced to 20/150 in the right eye.
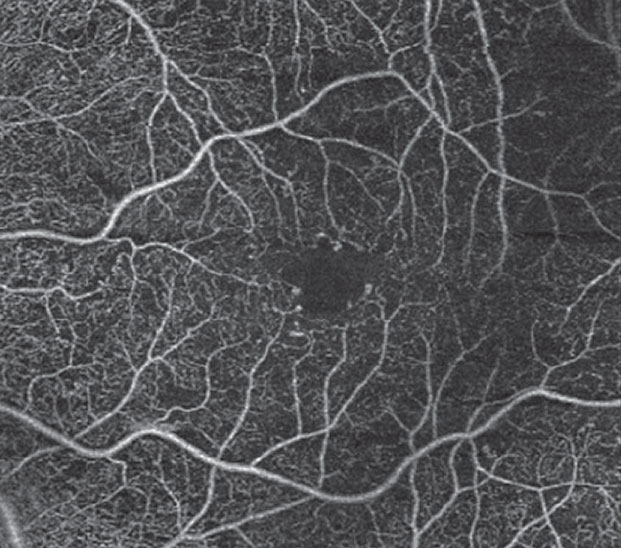
Fundus photos revealed a hemorrhage in the right eye suspicious for exudative AMD (Figure 2). The left eye revealed multiple small drusen, consistent with stage 2 dry AMD. Spectral domain (SD) OCT revealed subretinal fluid (SRF) overlying a RPE lesion, suggestive of a CNVM in the right eye and multiple drusen and RPE disruption without any SRF in the left eye (Figure 3). OCT-A of the right eye further revealed a large almost 3x3mm sea-fan like lesion in the outer retina and the choroid, consistent with a large Type 1 CNVM (Figure 4). The patient was referred to the retinal service for anti-VEGF injections.
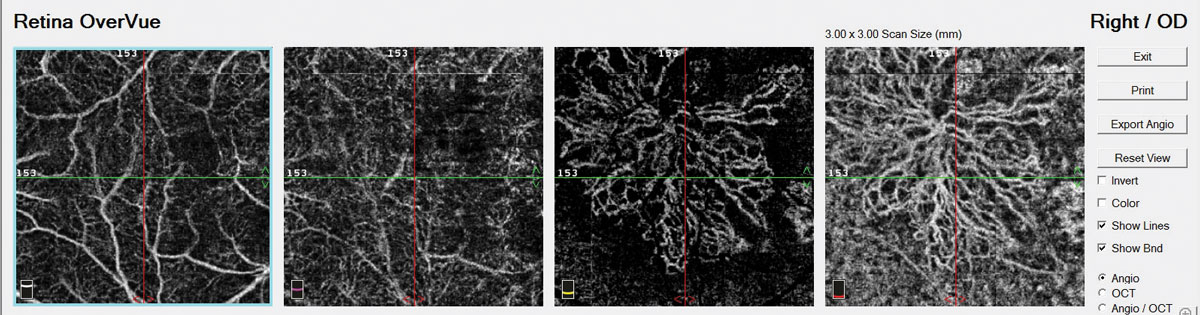 |
| Fig. 4. OCT-A reveals a large CNVM in the right eye, prompting an immediate referral. Click to enlarge. |
Diabetes
OCT-A also plays a powerful role in evaluating and following diabetic retinopathy (DR) and macular ischemia. Diabetes is the leading cause of functional vision loss in the working population and second only to AMD as the leading cause of vision loss in adults.8 Approximately 347 million people worldwide have diabetes mellitus (DM), and the prevalence is expected to rise to 430 million by the year 2030.8,9
Vein OcclusionsOCT-A can be helpful in determining ischemia in a number of retinal conditions, such as vascular occlusive disease. Knowledge of ischemia, as well as its extent, may be useful in the prognosis and treatment options available to these patients.
This OCT-A demonstrates a patient with an ischemic branch retinal vein occlusion in the left eye with macular edema. The area of ischemia is most pronounced in the superficial retina superior to the macula. |

ODs must remain proactive in the fight against blindness from diabetes, and OCT-A is an important diagnostic tool to catch signs of DR as early as possible.
The early complications of DM first occur in the capillary plexus of the deep retina, which is better evaluated with OCT-A than traditional FA. DR is characterized by microaneurysmal lesions, capillary nonperfusion and ischemia. The majority of vision loss is secondary to diabetic macular edema and ischemic maculopathy, the latter of which is associated with functional retinal damage and vision loss and can be a predictive factor in DR progression.10 Treatment for these complications is vital for preserving functional vision in patients with DM.
 |
| Fig. 5. This fundus image shows scattered dot/blot hemorrhages in the left eye consistent with mild NPDR. |
Diagnosis. Traditional FA and SD-OCT have been the standard diagnostic tests for evaluating the complications of DM, most notably ischemia and macular edema. However, traditional FA may fall short when evaluating the subclinical stages of retinopathy that can be difficult to catch with slit lamp biomicroscopy or retinal photography.
OCT-A allows the clinician to evaluate the retina’s microvascular system in much greater detail than traditional angiography. With the ability to see subclinical microaneurysmal lesions and early ischemic changes in the retina, clinicians can be more proactive in discussing better systemic glucose control to slow retinopathy progression. Earlier intervention for those with early capillary drop is associated with a better long-term prognosis, as more aggressive anti-VEGF therapy can help prevent progression of ischemia.
Treatment. Evaluating the retinal vasculature is a vital part of following patients with DM, and a noninvasive diagnostic test such as OCT-A can help follow the patient more frequently without the cumbersome process and risk of traditional intravenous FA. In addition, some patients with later stages of DM will have poor venous access, making FA more difficult. OCT-A allows the clinician to follow progression in ischemic retinal disease without the need for venous access.
 |
| Fig. 6. OCT-A of the left eye reveals microaneurysms with early alteration of the FAZ. |
In a clinical setting, OCT-A gives us a better estimation of ischemic retinal changes (non-perfusion) compared with intravenous angiography due to the ability to image the capillary plexus of the deep retina, which is not visualized with traditional FA.
New software will one day allow the clinician to monitor and track the progression of non-perfusion by comparing serial images over time and measuring the area of non-perfusion present in a particular location of the fundus (similar to the RNFL and GCC progression used in our glaucoma patients with traditional SD-OCT thickness scans). This may prove beneficial for patients receiving intravitreal anti-VEGF therapy and may help the clinician titrate a maintenance dosage of anti-VEGF usage for the degree of ischemia and rate of progression.
Case example 1. A 57-year-old female with a 12-year history of Type 2 diabetes presented for her annual dilated retinal examination. Her visual acuity measured 20/20 in each eye, and she had no subjective symptoms. The dilated retinal examination revealed a few dot hemorrhages in the posterior pole of the left eye (Figure 5) consistent with mild nonproliferative DR. OCT imaging revealed normal macular thickness and foveal contour compared with normative data. OCT-A, however, clearly showed more aneurysmal lesions in the parafoveal region, as well as a disruption of the foveal avascular zone (FAZ) consistent with early ischemic maculopathy (Figure 6).
Because ischemic retinal changes are indicative of a more rapid progression in retinopathy, she was considered at a higher risk for vision loss than you might expect with a diagnosis of mild nonproliferative DR. Because of the OCT-A findings, this patient is being followed more closely.
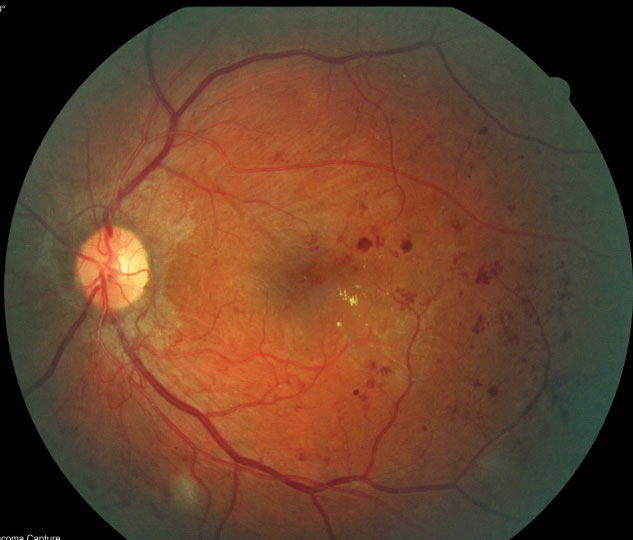 |
| Fig. 7. Scattered dot-blot hemorrhages, retinal exudates and neovascularization inferior to the optic nerve head in the left eye. |
Case example 2. A 32-year-old man with a 27-year history of Type 1 DM was referred for a retinal evaluation by his primary care physician, although he had no symptoms of visual loss and his visual acuity was 20/20 OU. Dilated fundus examination revealed dot-blot hemorrhages with hard exudate in the posterior pole area of the left eye, as well as irregular vessels inferior to the optic nerve head suspicious for neovascularization (Figure 7). OCT-A confirmed a large frond of neovascularization of the disc consistent with proliferative DR of the left eye (Figure 8). Traditional FA confirmed the presence of neovascularization with leakage of dye in the later phases of the angiogram. He was treated with intravitreal bevacizumab and panretinal photocoagulation. The neovascularization regressed over time, stabilizing his retinopathy.
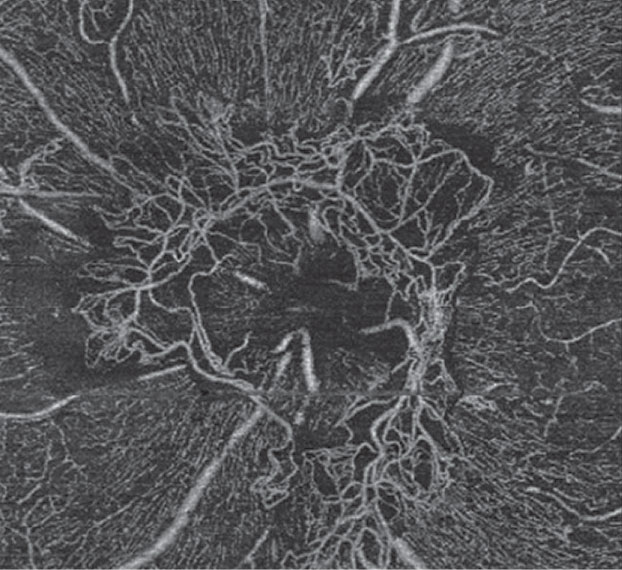 |
| Fig. 8. This OCT-A scan confirms neovascularization in the left eye consistent with proliferative DR. |
Glaucoma Care and OCT-A: A Promising PairBy Carolyn E. Majcher, OD
Researchers have long thought that vascular perfusion compromise and dysfunction of vascular autoregulation play a pivotal role in the pathogenesis of glaucomatous optic neuropathy. Now, with the advent of OCT-A to noninvasively assess ocular blood flow and capillary density, studies confirm the presence of decreased papillary, peripapillary and macular perfusion in glaucoma eyes compared with normal eyes.1-4 Until recently, the main factor limiting OCT-A in glaucoma management was a lack of quantitative perfusion measures. Without it, clinicians had to visually detect and monitor perfusion abnormalities over time. But the FDA’s recent approval of OptoVue’s AngioAnalytics now provides clinicians with quantitative peripapillary and macular vessel density data—another objective quantitative measure to monitor progression over time, in addition to nerve fiber layer (NFL) and optic nerve head morphology OCT analysis.5 Using this software, researchers demonstrate significantly reduced OCT-A radial peripapillary capillary density in all peripapillay sectors in glaucomatous eyes compared with normal eyes.6The peripapillary vessel density was highly correlated with glaucoma severity, as determined by ganglion cell complex (GCC), NFL and rim area measures.6Others who investigated the performance of OCT-A AngioAnalytics vessel density measurements compared with conventional OCT NFL thickness found the two are similar in their ability to discriminate glaucomatous from healthy eyes.4Their research also suggests that OCT-A vessel density measures are not significantly influenced by disc size, a factor known to affect NFL and optic nerve head morphologic results.4
In Your Clinic OCT-A may prove clinically useful in demonstrating short-term perfusion improvement upon initiation of glaucoma therapy.7Whether these effects are due to vasoactive properties of the medications themselves or increased perfusion as an indirect result of IOP lowering is yet to be determined.
The verdict is out on whether OCT-A detected perfusion abnormality is the cause or consequence of glaucomatous structural loss. One study shows progressive decrease of macular vessel density occurs in primary open-angle glaucoma (POAG) eyes; however, it was not accompanied by progressive GCC thinning, suggesting vascular dysfunction may precede, and is not a consequence of, structural loss.8 Vascular compromise likely plays a more substantial role in glaucoma development for some individuals then others, particular those with normal tension forms of the condition. In the future, OCT-A may allow clinicians to identify and customize care for patients with significant perfusion dysfunction by selecting IOP-lowering medications that favorably influence retinal or optic nerve perfusion. Dr. Majcher is an assistant clinical professor at Rosenberg School of Optometry, University of the Incarnate Word in San Antonio, Texas.
|


Advances on the Way
Although OCT-A is still an emerging technology in the clinic, it’s already improving with several newer innovations, each with useful applications for certain disease types:
AMD. AngioVue, a new technology by Optovue, recently gained FDA approval to assess flow area. Users can manually measure an area of abnormal flow by outlining a region for vessel detection corresponding to a CNVM or another lesion. The flow area is monitored precisely to see if a lesion is increasing with time, requiring additional treatment, or if an existing lesion is decreasing with treatment, a true measure of treatment response. New software will allow for custom segmentation and propagation, which will enhance the removal of artifacts from the OCT-A analysis and make it easier to quantify changes throughout the retina and choroid.11
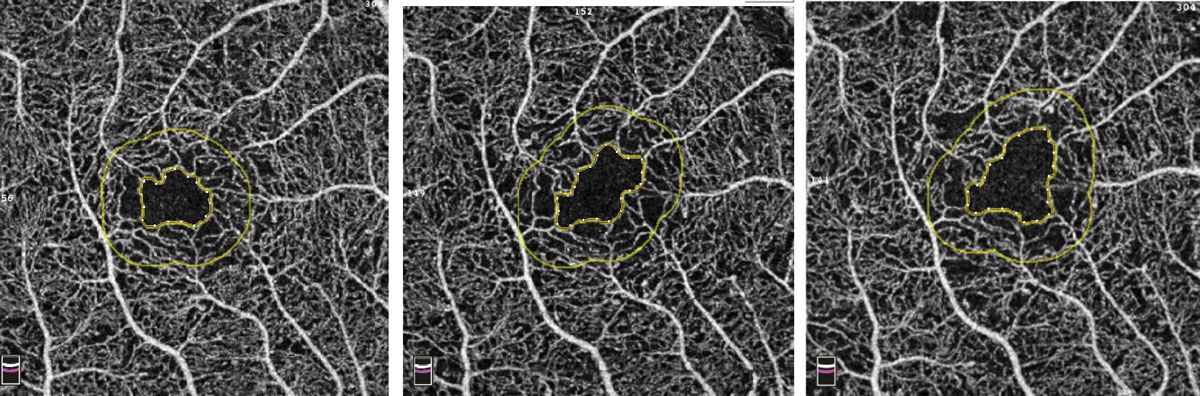 |
| Fig. 9. Example of increasing FAZ over three visits in a patient with diabetes. Photo: Bernard Szirth, OD. Click to enlarge. |
Diabetes. The primary disadvantage of OCT-A for this patient population is its limited ability to image the midperipheral retina; however, the initial scan dimension of 3x3mm has grown to 6x6mm and even 8x8mm in size. An 8x8mm scan will capture the optic nerve, central macula and the posterior pole out to the vascular arcades in a single scan. Shifting patient fixation and acquiring a series of images has allowed for an evaluation of the midperiphery, and newer OCT-A technology includes internal fixation and montage software to stitch multiple images together much like we currently have with retinal photography and OCT imaging, although current OCT software only includes one internal fixation and must be moved manually to gain off-center images.
OptoVue’s AngioVue will also allow for an objective, qualitative analysis of the vascular structure of the retina and choroid and may be instrumental in following our patients with diabetes. FAZ tools will be available to accurately measure the area of the FAZ in square millimeters. This area can then be followed sequentially over time for changes, indicating worsening retinal damage (Figure 9). Vessel density mapping will calculate the percent of the total area in and around the macula occupied by vessels. As capillary dropout increases, the vessel density will decrease, signifying increasing ischemia and potential need for intervention (Figure 10).
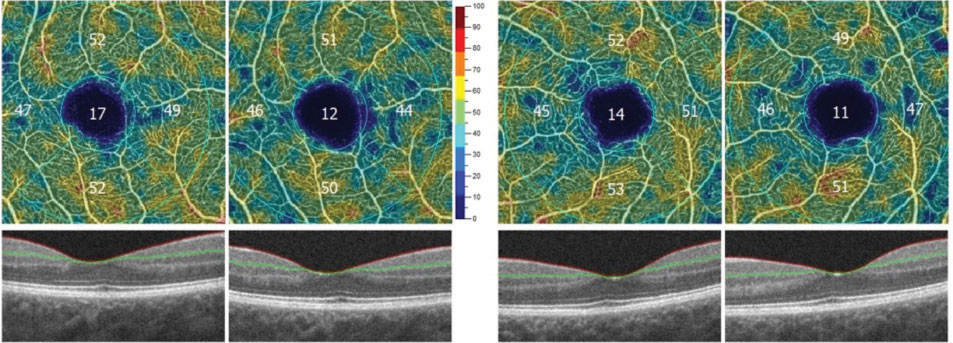 |
| Fig. 10. Decreasing vessel density in both eyes over two sequential visits, associated with increasing ischemia. Image: Bernard Szirth, OD. |
In addition to the current imaging capabilities available on the Cirrus OCT-A (Carl Zeiss Meditec), a new software version will provide montage capabilities to obtain a wider field of view. A 14x14mm image is a software montage of five separate 6x6mm images captured by a technician (Figure 11). The PlexElite swept-source OCT (Carl Zeiss Meditec) with scanning speeds of 100,000 A-scans per second is available for research purposes and will also allow for wider scanning abilities without needing montage software. Such improvements in software and montage capabilities will allow clinicians to use OCT-A to image the midperipheral fundus without the risk of adverse reactions to sodium fluorescein.
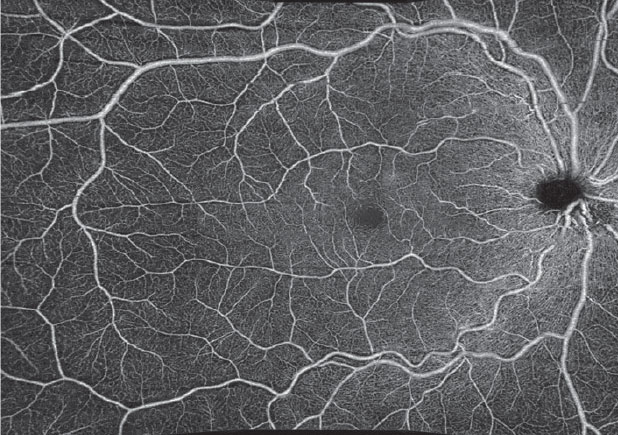 |
Fig. 11. A 14x14mm montaged image of five individual 6x6mm images captured on the Cirrus 5000. |
OCT-A is an exciting technology that may become instrumental in caring for patients with retinal disease. It already provides the data necessary to diagnose conversion to wet AMD before traditional FA, identify subclinical CNVM before retinal fluid is seen on OCT or a subjective symptom of blurred vision or metamorphopsia and evaluate patients with early retinopathy and ischemia—yet future advances show even more promise. Newer models may provide larger scan dimensions, montage software and software to track ischemic progression.
OCT-A moves optometry one step closer to a proactive profession that identifies disease and intervenes before visual loss. This, in the end, could potentially reduce the visual threat from AMD, DM and other retinal vascular diseases in our clinical population.
Dr. Ferrucci is chief of optometry at the US Department of Veterans Affairs in North Hills, Calif., and is a professor at the Southern California College of Optometry at Marshall B. Ketchum University in Fullerton, CA.
Dr. Haynie is in private practice in Washington state.
1. Rein DB, John S. Wittenborn JS, Zhang X; Vision Health Cost-Effectiveness Study Group. Forecasting age-related macular degeneration through the year 2050—the potential impact of new treatments. Arch Ophthalmol. 2009;127(4):533-40. 2. Cole ED, Novais EA, Louzada RN, Waheed NK. Contemporary retinal imaging techniques in diabetic retinopathy: a review. Clin Exp Ophthlamol. 2016;44:289-99. 3. Ma J, Desai R, Nesper P, et al. Optical coherence tomographic angiography imaging in age-related macular degeneration. Ophthalmology and Eye Diseases. 2017 Mar 20;9:1179172116686075. 4. Kuehlewein L, Bansal M, Lenis TL, et al. Optical coherence tomography of type 1 neovascularization in age-related macular degeneration. AM J Ophthalmol. 2015; 160:739.-748. 5. El Ameen A, Cohen SY, Semoun O, et al. Type 2 neovascularization secondary to age related macular degeneration imaged buy optical coherence tomography angiography. Retina. 2015;35:2212-8. 6. de Oliveira Dias JR, Zhang Q, Garcia JMB, et al. Natural history of subclinical neovascularization in nonexudative age-related macular degeneration using swept-source oct angiography. Ophthalmology. 2018;125(2):255-66. 7. Bonini Filho MA, Talisa E, Ferrara D, et al. Association of choroidal neovascularization and central serous chorioretinopathy with optical coherence tomography angiography. JAMA Ophthalmol. 2015;133(8):899-906. 8. Korobelnik JF, Do DV, Schmidt-Erfurth U, et al. Intravitreal aflibercept for diabetic macular edema. Ophthalmology. 2014;121(11):2247-54. 9. Varma R, Bressler NM, Doan QV, et al. Prevalence of and risk factors for diabetic macular edema in the United States. JAMA Ophthalmol. 2014;132(11):1334-40. 10. Lee R, Wong TY, Sabanayagam C. Epidemiology of diabetic retinopathy, diabetic macular edema and related vision loss. Eye Vis (Lond). 2015;2:17. 11. Optovue. Optovue receives FDA clearance for AngioAnalytics – the world’s first OCT angiography metrics. June 11, 2018. |