43rd Annual Technology ReportCheck out the other feature articles in this month's report:- Is OCT-A Right for My Practice? - The Many Uses of Orbital Ultrasonography - Tighten Your Testing Protocols to Pass an Audit |
All optometrists know what we’re up against in glaucoma: retinal ganglion cell (RGC) death, retinal nerve fiber layer (RNFL) thinning and neuroretinal rim loss conspire to produce visual field (VF) defects—and our only means of intervention does nothing to turn back the tide. Intraocular pressure (IOP) reduction merely slows down the process; adding insult to injury, the weapons at our disposal to do so are difficult to wield with any precision.
Because glaucoma care is a years- or decades-long endeavor, it’s critical for us to have a thorough sense of each patient’s starting point so that we can carefully monitor for progression. Historically, the battery of tests in a baseline assessment has included funduscopy, fundus photography, tonometry, gonioscopy and perimetry. With the advent of newer technologies—chief among them optical coherence tomography (OCT)—requirements now include tests that provide more objective and quantitative information about both structure and function. Here, we review the necessary steps of every baseline glaucoma exam.
Funduscopy
Foundationally, the designation of glaucoma suspect or the diagnosis of glaucomatous optic neuropathy comes from conducting a detailed analysis of the optic nerve head (ONH) by assessing it stereoscopically behind the slit lamp. A systematic approach to evaluating the ONH is compulsory, and attention to the structure’s morphological aspects and surrounding tissues outweighs simply judging a cup-to-disc (C/D) ratio.1
There are several templates that emphasize comprehensive evaluation of the optic nerve head. Three popular ones are:
- Focusing Ophthalmology on Reframing Glaucoma Evaluation (FORGE)
- Glaucomatous Optic Neuropathy Evaluation (GONE)
- Disc Damage Likelihood Scale (DDLS)
All are reproducible systems that can improve practitioner accuracy during baseline funduscopy. Specifically, FORGE employs five rules by evaluating neuroretinal rim size and shape, RNFL thickness and the scleral ring to determine disc size and monitoring for the presence of parapapillary atrophy and optic disc hemorrhages.2 GONE is a standardized, internet-based system that underlines the importance of focusing on more than C/D ratios when determining glaucoma likelihood to improve risk assessment.3 DDLS emphasizes the clinical evaluation of the narrowest width of the rim (called the rim/disc ratio) and incorporates disc size into its assessment of damage.4
Other resources include instructional videos that help both trainees and experienced clinicians visualize ONH assessment. A particularly helpful video by Peter Lalle, OD, can be accessed at https://vimeo.com/373647096.
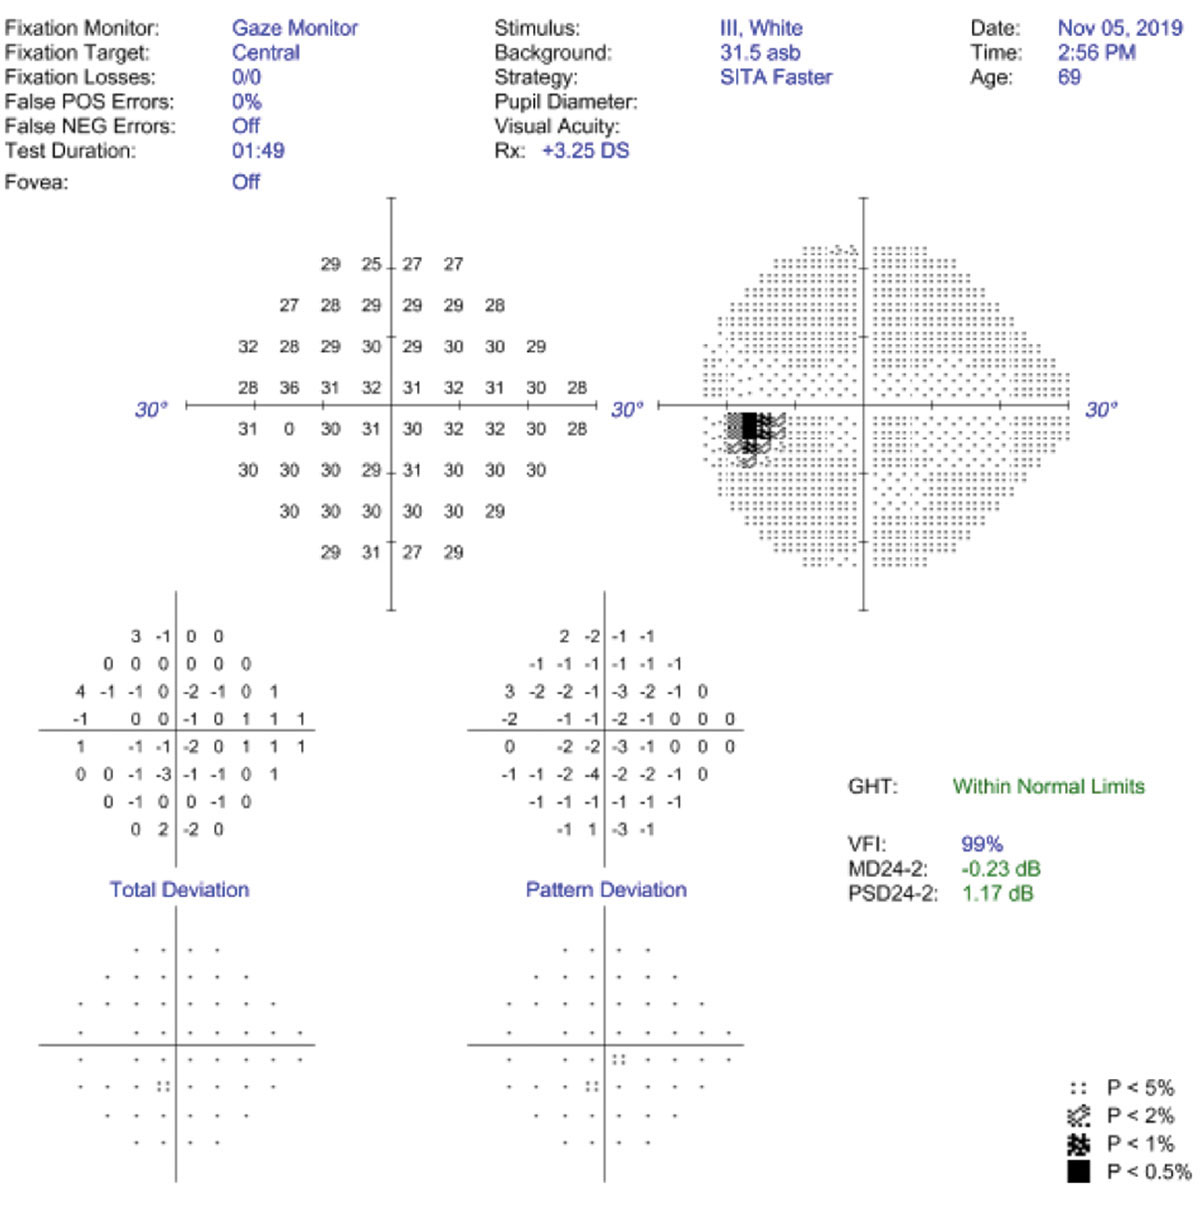 |
| False positives and gaze tracking are the best ways to assess VF reliability. Click image to enlarge. |
Fundus Photography
Imaging of the ONH and surrounding RNFL is a valuable tool in capturing a patient’s baseline. Photos provide documentation of the nerve at any given point, the ability to scrutinize the qualitative details of the tissue that can be affected by glaucoma without time constraints or limited field-of-view and a historical record to assess change.5 They complement funduscopy and other imaging techniques to provide a comprehensive overview of each patient’s case.
The Ocular Hypertension Treatment Study (OHTS), published in 2002, highlighted the disconnect between clinical examination and photography, finding that 84% of disc hemorrhages that were missed clinically were detected on photographs.6
Stereoscopic photography of the disc, consisting of photographic pairs of an optic disc separated slightly so they can be fused binocularly to provide the appearance of a three-dimensional image, is considered most appropriate. Also, red-free photography can enhance the detail of the RNFL and highlight its brightness and texture, facilitating the identification of RNFL defects.7 While photographs are imperfect and require an astute review, they aren’t biased, replaceable or confounded.
Gonioscopy
Although primary open-angle glaucoma (POAG) is the most common form, numerous others exist under the disease’s umbrella, many of which are more aggressive and potentially more vision-threatening.8,9 Failure to determine the appropriate form of glaucoma can lead to a lack of understanding on the practitioner’s part and subsequently increase the risk of mismanagement.
Gonioscopy is, in spite of newer technologies that assess the anterior chamber angle, the only technique available that provides comprehensive, dynamic and qualitative information about the angle in vivo.10 Despite its importance in accurate classification of glaucoma, studies indicate that gonioscopy is not performed, or at least not documented, by the majority of frontline eye care providers, regardless of their degree or practice modality.11-15 Optometry and ophthalmology have been shown to employ gonioscopy just 50% of the time.11-15
Gonioscopy has been considered the standard of care in baseline and chronic glaucoma care in both optometry and ophthalmology for more than 30 years.16,17 Knowing this, all practitioners should make an effort to incorporate gonioscopy into their glaucoma baseline screening. Many resources are available to help practitioners enhance their skillset and become more proficient with gonioscopy for the best chance of success, most notably those at gonioscopy.org.
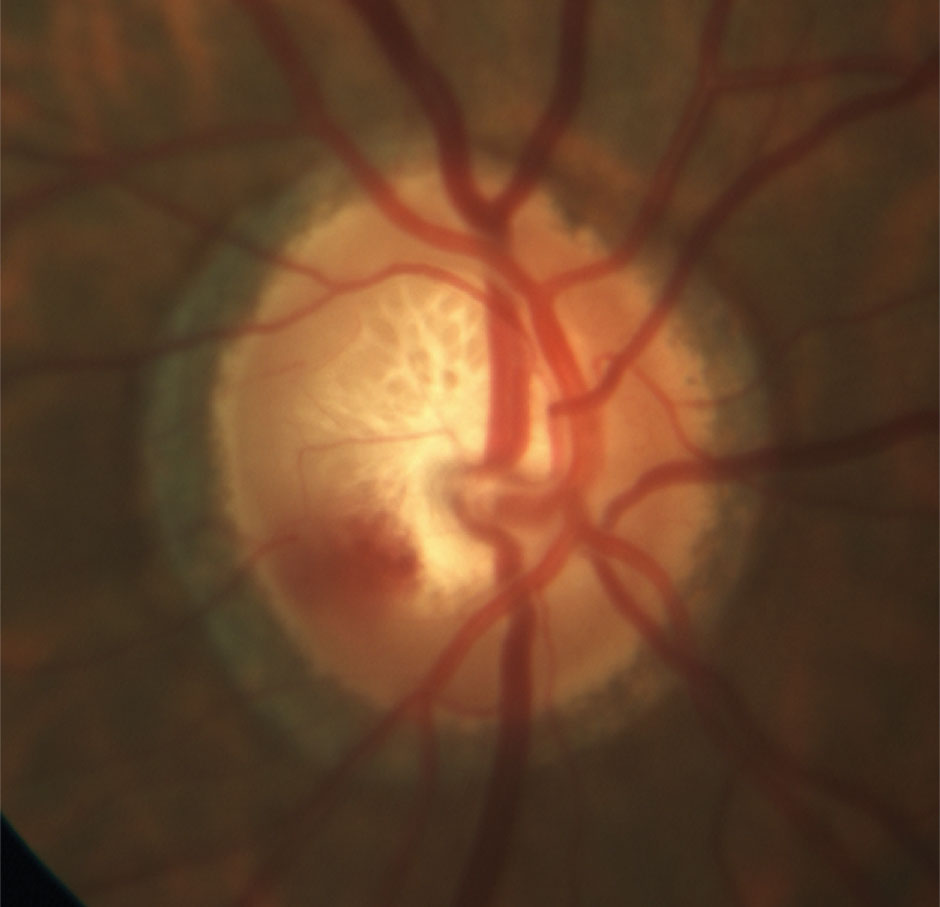 |
| Quality ONH photography can supplement slit lamp assessment and provides a permanent historical record for future comparison. Click image to enlarge. |
Tonometry
One of the most frequently expressed and wholly accurate statements in the world of glaucoma is that IOP is currently the only modifiable risk factor. This renders IOP as arguably the most important factor in glaucoma management. The literature supports the widely held belief that patients with higher IOP levels are, on average, at a higher risk of both developing glaucoma and experiencing disease progression.18-21
Minimally, the primary objective of current medical and surgical treatment is to reduce IOP. From baseline IOP values, we’re able to establish an initial target IOP and assess treatment efficacy. The difficulty lies in both the physiological characteristics of IOP and the accuracy of the instrumentation used to capture it and the time at which it is captured, as IOP is a dynamic parameter. To further complicate matters, past research has implicated IOP fluctuation as an independent risk factor for disease progression; whereas, more recently, peak IOP has been reported as the most problematic. It is likely that diurnal mean IOP, peak IOP and fluctuation in IOP all influence the disease process, suggesting that a comprehensive understanding of each patient’s IOP is essential in our risk assessment.22,23
Often, practitioners only take one IOP measurement during office hours once every three to four months. By doing so, they have at least a 75% chance of missing the peak of the diurnal curve.24 Additionally, 24-hour sleep studies show, on average, a peak in IOP occurring nocturnally as patients shift from an upright awake position to a nocturnal, supine sleep position.25 In early glaucoma, supine IOP tends to increase around the time that patients wake up, which does not occur in healthy patients.26 This means that clinicians are missing both nocturnal and waking IOP.
The ability to conveniently capture IOP over 24 hours would be ideal and potentially capture greater peaks and wider fluctuations. Currently, there are two devices that are FDA-approved for at-home IOP monitoring, Triggerfish (Sensimed) and iCare Home (iCare). However, only iCare Home is commercially available in the United States. Unfortunately, a low percentage of ODs are currently using these devices, and most still have insufficient knowledge of their patients’ IOP behavior, and treatment decisions are often made based on incomplete data.27
Acquiring IOP over a 24-hour period may not be feasible or realistic in some cases. A practical, but admittedly imperfect, option is to capture four to five IOP readings every two hours in-office over the course of a day from 8am to 4pm.28 One of these readings should be taken in the supine position, as an in-office supine reading is a good estimate of peak nocturnal IOP.29 This creates a modified diurnal tension curve (mDTC), which may improve risk assessment compared with a single IOP reading. Studies on the reproducibility of mDTC from day-to-day are, however, conflicting, so one day of mDTC may not reflect true diurnal IOP characteristics.30
An additional option is to use the average of the in-office mDTC to estimate peak nocturnal IOP. A recent study found a correlation between average mDTC and peak nocturnal IOP acquired during 24-hour IOP testing. This correlation was more significant than it was with a single IOP reading.31 Notably, although studies on correlation between 24-hour peak and in-office IOP are conflicting, this finding was stronger in untreated patients, indicating that taking IOP in-office at the very least does have value.31
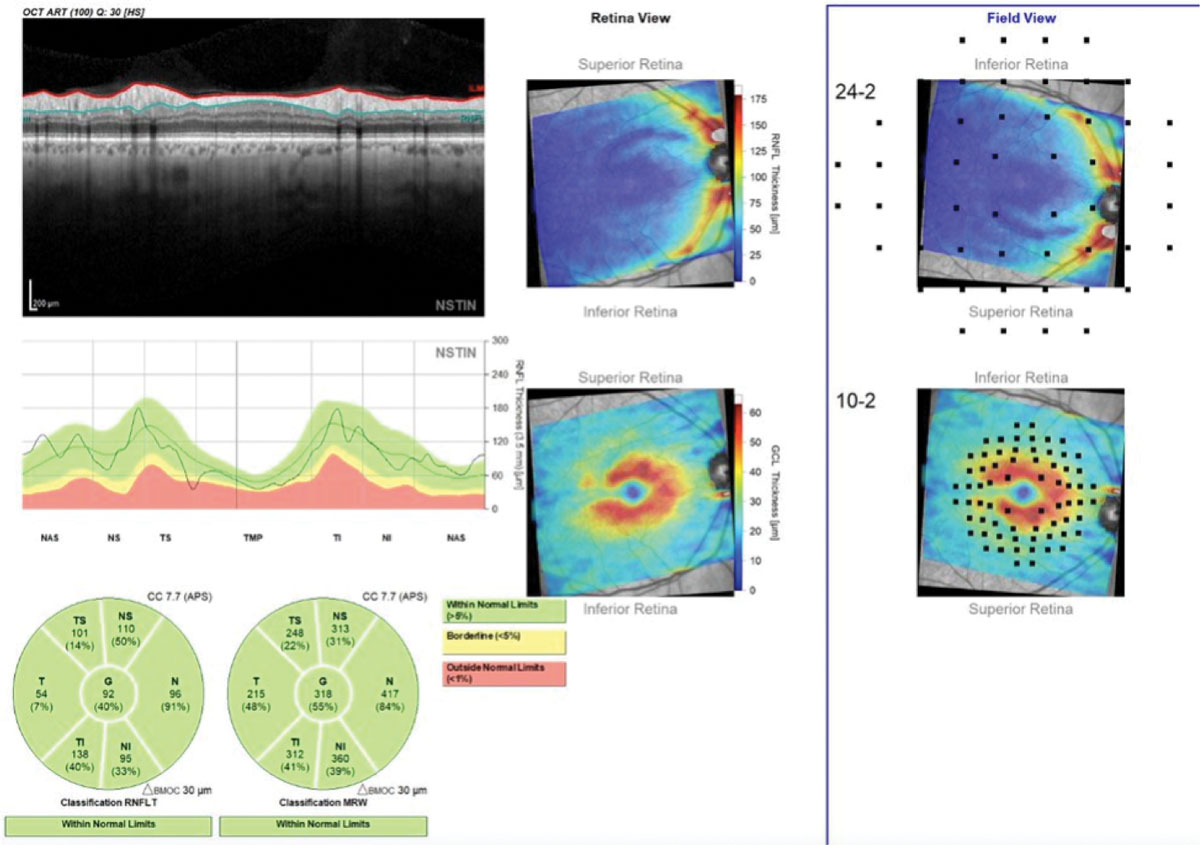 |
| This Hood Report of a patient with a superior arcuate RNFL defect provides a comprehensive baseline that integrates RNFL, minimum rim width, GC-IPL and projected 10-2 and 24-2 VFs. Click image to enlarge. |
Given that the capture of IOP is integral to the baseline process, the technology we use to measure IOP is equally important and must be as accurate as possible. Although multiple forms of tonometry exist, including applanation, indentation and rebound, Goldmann applanation tonometry (GAT) remains the standard of care.32,33 This was recently reinforced in a survey showing that 89% of responding optometrists and 82% of responding glaucoma specialists consider GAT to be the most accurate form of tonometry.34 Although GAT is useful for monitoring IOP changes, it is not an accurate representation of the pressure within the eye; rather, it reflects the pressure difference across the cornea, known as transcorneal pressure difference, and inherently does so with multiple sources of error, most significantly error created by the biomechanics of the cornea.35,36
True IOP is measured intracamerally using a pressure transducer. Studies comparing GAT to intracameral applications consistently show that GAT underestimates true IOP in both living and cadaver eyes.37 Dynamic contour tonometry (DCT), the Corvis ST (Oculus) and, most recently, a modified Goldmann prism with a correcting applanation tonometry surface (CATS) can more closely approximate true IOP.38,39 The CATS device is arguably the most convenient of the three, as it is placed in a standard Goldmann tonometry mount, simply replacing the older-generation prism. DCT requires a switch in tonometry mounts and the Corvis ST is a stand-alone instrument. All three are promising but have not influenced a paradigm shift away from GAT.
Pachymetry
Central corneal thickness (CCT) is an independent risk factor for the conversion from ocular hypertension (OHTN) to POAG.20 Further study also shows that CCT is inversely related to both the progression and severity of glaucoma.40 The OHTS divided participants by CCT into thick, intermediate and thin subgroups.20 The thin subgroup (average 530.8µm) was more than three times more likely to develop glaucoma over five years than the thick subgroup (average 613.5µm).20 When OHTS data was pooled with data from the European Glaucoma Prevention Study (EGPS), every 40µm decrease in CCT from the thickest subgroup was associated with at least a twofold risk of developing glaucoma over five years.41
Pachymetry has long been considered a routine part of baseline testing in glaucoma suspects and patients with OHTN.40 Many technologies measure pachymetry (i.e., OCT, optical biometry, confocal microscopy, corneal topography and specular microscopy), but the standard for evaluating risk in glaucoma patients is ultrasound pachymetry, which was the technique used in OHTS, EGPS and the Early Manifest Glaucoma Treatment Study.40,42 Studies show that these technologies are not directly interchangeable, so clinicians should rely on ultrasound pachymetry for the sake of consistency and accuracy.40
Recent studies show that the relationship between the cornea and glaucoma involves more than just corneal thickness, which is merely a dimension, not a biomechanical property, and is therefore unlikely to indicate how the eye adapts to the forces to which it is exposed.40,43 Corneal hysteresis (CH), however, reflects the cornea’s ability to absorb and release energy created by applanation forces during measurement. Research suggests that CH could actually be a surrogate measure for the globe’s ability to resist deformation from various confounding pressures.44-46
CH is now known to have a more significant association with both the presence and rate of glaucoma progression than previously thought.47 Essentially, high CH may confer a protective effect, whereas low CH increases the eye’s susceptibility to glaucomatous damage.43 To highlight this point, a study comparing patients with glaucoma with their non-glaucoma counterparts reported an average CH of 8.95±1.27mm Hg in the disease group and an average CH of 10.97±1.59mm Hg in the control group.48
CH is directly influenced by CCT and inversely influenced by IOP.49 Thus, both relationships should be considered when interpreting CH. Ultimately, assessing CCT and CH in combination, rather than isolation, improves the sensitivity of diagnosis.49
 |
| Gonioscopy shows an unremarkable anterior chamber angle. Click image to enlarge. |
OCT
The evolution of OCT has given us the ability to consistently gauge the structure of neural tissue damaged by glaucoma. Early in the disease state, OCT is often favored over visual fields, and multiple studies support its superiority over standard automated perimetry (SAP).50 OCT is, in fact, able to detect glaucomatous change on RNFL scans up to eight years prior to detection by VFs.51
With reference to glaucoma, OCT measures the ganglion cell–inner plexiform layer (GC-IPL), which houses RGC bodies and their dendrites, the RNFL filled with ganglion cell axons before they enter the optic nerve and neuroretinal rim.52 Tissue thickness indicates glaucomatous damage, with the assumption that thinner tissue equates to a worse disease state and thicker tissue is indicative of good tissue health. The various commercially available OCT devices each employ their own capture algorithms, scanning protocols and reference databases.53 However, all capture tissue thickness and display it as normal, borderline or abnormal.
Maximal scan quality and reflectivity is critical in diagnostic and management decisions. The World Glaucoma Association (WGA) recommends that the managing physician vet each image prior to proceeding any further. They must be aware of possible patient, operator and machine errors.54,55
Clinicians should capture multiple high quality OCT images of the GC-IPL, RNFL and neuroretinal rim at regular intervals following baseline screening to confirm accuracy and gauge progression.56 Although studies found that, in isolation, the sensitivities of macular, RNFL and optic disc parameters are comparable in their diagnostic abilities, evaluating all tissues affected by glaucoma is recommended at baseline and maximizes outcomes.57 The combined analysis of the GC-IPL and circumpapillary RNFL performs better diagnostically than each individual parameter in early glaucoma cases.58
Available OCT analyses include the Cirrus PanoMap Analysis (Zeiss), which combines RNFL, GC-IPL and ONH data, and the Hood Report (Heidelberg and Topcon), which integrates RNFL, RGC and rim width data and relates it to function by overlying test points from both 24-2 and 10-2 VFs. In classifying an eye as glaucomatous, the Hood Report can perform as good as or better than glaucoma specialists with fundus photos, 24-2 VFs and RNFL imaging on OCT, reinforcing the necessity of capturing all tissues and streamlining their analysis at baseline.59
OCT Angiography (OCT-A)
Impaired retinal blood flow has been implicated as a factor contributing to glaucoma. Until recently, there was no noninvasive technology available to explore the microcirculation of the ONH in vivo.60 OCT-A employs motion contrast (the comparison of sequential B-scans of the same static retinal or ONH area) and uses differences in the intensities of the cross sections as a surrogate for red blood cell movement.
Studies evaluating the optic nerve head and peripapillary and macular regions using OCT-A show altered vasculatures and found that OCT-A is able to discriminate between patients with glaucoma and those without it.60,61 Additionally, OCT-A has adequate reproducibility and reliability, meaning that it can be useful in the longitudinal care of glaucoma.60,61 Although it is not presently considered part of the standard of care for glaucoma, OCT-A has potential and should be considered, if available, when screening suspects.
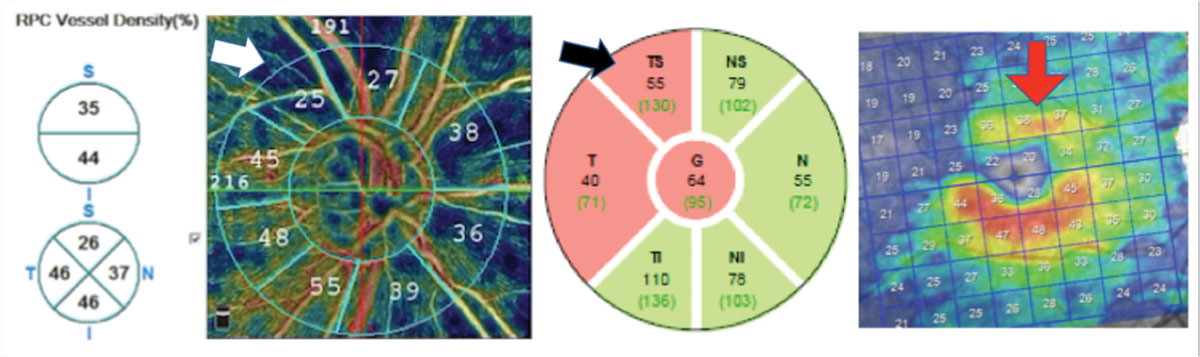 |
| This open-angle glaucoma patient has substantial reduction in vessel density (white arrow), which correlates with a superior temporal RNFL (black arrow) and GC-IPL thinning (red arrow). Note that hotter colors indicate greater vessel density than cooler colors. Click image to enlarge. |
Perimetry
Ultimately, the objective of glaucoma care is to prevent patients from losing functional vision, which is why perimetry remains an essential part of baseline exam and longitudinal management.62 Perimetry quantitatively assesses the function of RGCs at various retinal locations that are susceptible to damage. VF defects should therefore manifest as RGC function diminishes. Diagnostically, perimetry is used to find patterns of loss consistent with glaucoma, while concurrently ruling out non-glaucomatous patterns. The alignment of clinical observation with glaucomatous data on perimetry helps to ensure diagnostic accuracy.
SAP is the most commonly used method of assessing the VF.63 Multiple instruments offer SAP and all aim to capture as much RGC function as possible, while minimizing testing error. In deciding which testing algorithm to run, keep in mind that both structural and functional damage to the macular region occur across the spectrum of glaucoma, including early disease, as approximately 50% of RGCs are concentrated within the parafoveal area.64-66 It is generally accepted that a traditional 24-2 strategy (which uses a grid of 54 loci separated by 6° across the central 24° of the retina) may miss early disease that is detectable with a denser sampling through the use of a 10-2 strategy (which uses a grid of 68 loci separated by 2° across the central 10° of the retina).67-69
Given the potential lack of coverage with traditional testing, there is confusion around the best baseline approach to perimetry. Some suggest performing a 10-2 for any patient who already had a 24-2. As the clinic flow logistics of this suggestion are not ideal, researchers suggest commercial integration of alternative test patterns to better and more efficiently test the macular and perimacular regions.66,70 The Octopus G-Program (Haag-Streit) can be modified to accomplish this, and Zeiss recently developed the SITA Faster 24-2c test pattern.66 A recent study comparing the SITA Fast 24-2 and the 24-2c grids in glaucoma suspects and patients showed the 24-2c identified more clusters of central defects.71 Denser testing of the macular region with perimetry should improve alignment with OCT testing of the GC-IPL. The authors did find improved structure-function alignment with the 24-2c but noted that half of the VF test locations did not correspond with commonly used OCT macular thickness scans.71
Despite its importance as the only direct method of measuring function, perimetry is often not performed as frequently as recommended by current guidelines for newly diagnosed patients or suspects.72 A team published practical recommendations for measuring rates of VF change in glaucoma patients based on empirical data and statistical modeling. They concluded that three exams per year are required to identify an overall change in mean deviation of 4dB over two years in a patient with average VF variability.73
The WGA recommends conducting at least two reliable baseline VFs in the first six months of management and at least two additional fields over the next 18 months.56 More frequent VFs may be necessary in advanced disease to detect fast progressors (-2dB per year or faster). Accordingly, the WGA suggests taking six reliable VFs in the first two years in patients at risk for visual disability.56
Testing Indicated For Glaucoma Suspects and Early-stage Patients | ||||
| Test | Initial Visit | One-month Visit | Six-month Visit | Annual Visit |
| Funduscopy | x | suspect: no, patient: yes | x | |
| Fundus Photography* | x | x | ||
| Gonioscopy* | x | x | ||
| Tonometry | x | x | x | x |
| Pachymetry* | x | |||
| OCT* | x | x | x | |
| Perimetry* | x | x | x | x |
| *Practitioner must decide on a case-by-case basis whether to conduct at initial or one-month visit. | ||||
Reliability is key in baseline VF capture. Developers of the Humphrey Field Analyzer (Zeiss) noted that fixation loss is more indicative of technician inattention than patient gaze instability and that they prefer to turn off fixation loss catch trials in favor of gaze tracking. They have also eliminated false negative catch trials in the 24-2c, as studies show that false negatives are more indicative of glaucomatous damage than poor reliability.74,75 Gaze tracking parameters are closely related to reproducibility results and are likely—in combination with false positives—the most useful way to assess reliability.76-78 A recent study found gaze tracking to be predictive of field variability, while traditional reliability indices were not.77
Electrodiagnostics
Electroretinography, in particular the pattern-reversal electroretinogram and the full-field electroretinogram, provides an additional minimally invasive, objective tool for assessing baseline RGC function. These techniques glean functional data through full-field, focal or multifocal visual stimulation of the macula. They are sensitive to detecting RGC damage in glaucoma suspects and OHTN patients prior to detection by standard perimetry and have a significant correlation with optic disc morphology. Electroretinography may be able to detect RGC dysfunction prior to their death, making it possible to potentially reverse the disease process through early medical or surgical intervention.79-81
A recent systematic review of the literature on electrophysiology in glaucoma concluded that no current definitive indications for these tests have been established at baseline or follow-up.82 Better protocols and correspondence with conventional glaucoma testing are warranted prior to routine use.82
Glaucoma is an insidious disease that requires accurate diagnosis and vigilant monitoring to avoid loss of function and reduced quality of life for patients. Combining the proper tools for testing and interpretation with astute clinical assessment should give practitioners the foundation they need to build a stepwise approach to care.
Dr. Sanderson is an associate professor and the assistant director of residency programs at the Southern College of Optometry. She teaches in anterior and posterior segment labs and theory and method labs and is the instructor of record in a class that focuses on systemic and ocular disease. She is also a fellow of the American Academy of Optometry.
Dr. Rixon is an attending optometrist at the Memphis VA. He is also a member of the Optometric Glaucoma Society, pursuing diplomate status in glaucoma through the American Academy of Optometry; he is a consultant for Telasight.
1. Chauhan BC, Burgoyne CF. From clinical examination of the optic disc to clinical assessment of the optic nerve head: a paradigm change. Am J Ophthalmol. 2013;156(2):218-27. 2. Fingeret M, Medeiros FA, Susanna R, et al. Five rules to evaluate the optic disc and retinal nerve fiber layer for glaucoma. Optometry. 2005;76(11):661-8. 3. Kong YXG, Coote MA, O’Neill EC, et al. Glaucomatous optic neuropathy evaluation project: a standardized internet system for assessing skills in optic disc examination. Clin Exp Ophthalmol. 2011;39(4):308-17. 4 Henderer JD. Disc damage likelihood scale. Br J Ophthalmol. 2006;90(4):395-6. 5. Myers JS, Fudemberg SJ, Lee D. Evolution of optic nerve photography for glaucoma screening: a review. Clin Exp Ophthalmol. 2018;46(2):169-76. 6. Budenz DL, Anderson DR, Feuer WJ, et al. Detection and prognostic significance of optic disc hemorrhages during the Ocular Hypertension Treatment Study. Ophthalmology. 2006;113(12):2137-43. 7. Bowd C, Weinreb RN, Zangwill LM. Evaluating the optic disc and retinal nerve fiber layer in glaucoma. I: Clinical examination and photographic methods. Semin Ophthalmol. 2000;15(4):194-205. 8. Razeghinejad MR, Myers JS. Contemporary approach to the diagnosis and management of primary angle-closure disease. Surv Ophthalmol. 2018;63(6):754-68. 9. Azuara-Blanco A, Burr JM, Cochran C, et al. The effectiveness of early lens extraction with intraocular lens implantation for the treatment of primary angle-closure glaucoma (EAGLE): study protocol for a randomized controlled trial. Trials. 2011;12:133. 10. Phu J, Wang H, Khuu SK, et al. Anterior chamber angle evaluation using gonioscopy: consistency and agreement between optometrists and ophthalmologists. Optom Vis Sci. 2019;96(10):751-60. 11. Hertzog LH, Albrecht KG, LaBree L, et al. Glaucoma care and conformance with preferred practice patterns. Examination of the private, community-based ophthalmologist. Ophthalmology. 1996;103(7):1009-13. 12. Mihlstin M, Juzych MS, Kromrei HT, et al. Resident compliance with the American Academy of Ophthalmology preferred practice patterns for primary open-angle glaucoma suspect. J Glaucoma. 2016;25(12):963-7. 13. Coleman AL, Yu F, Evans SJ. Use of gonioscopy in medicare beneficiaries before glaucoma surgery. J Glaucoma. 2006;15(6):486-93. 14. Stanley J, Huisingh CE, Swain TA, et al. Compliance with primary open-angle glaucoma and primary open-angle glaucoma suspect preferred practice patterns in a retail-based eye clinic. J Glaucoma. 2018;27(12):1068-72. 15. Zebardast N, Solus JF, Quigley HA, et al. Comparison of resident and glaucoma faculty practice patterns in the care of open-angle glaucoma. BMC Ophthalmol. 2015;15:41. 16. AOA. AOA Optometric Clinical Practice Guidelines. www.aoa.org/optometrists/tools-and-resources/clinical-care-publications/clinical-practice-guidelines. Accessed July 31, 2020. 17. AAO. Primary Open-Angle Glaucoma Suspect PPP—2015. www.aao.org/preferred-practice-pattern/primary-open-angle-glaucoma-suspect-ppp-2015. Accessed July 31, 2020. 18. The Advanced Glaucoma Intervention Study (AGIS): 7. The relationship between control of intraocular pressure and visual field deterioration. The AGIS Investigators. Am J Ophthalmol. 2000;130(4):429-40. 19. Leske MC, Heijl A, Hussein M, et al. Factors for glaucoma progression and the effect of treatment: the early manifest glaucoma trial. Arch Ophthalmol. 2003;121(1):48-56. 20. Gordon MO, Beiser JA, Brandt JD, et al. The Ocular Hypertension Treatment Study: baseline factors that predict the onset of primary open-angle glaucoma. Arch Ophthalmol. 2002;120(6):714-20. 21. Lichter PR, Musch DC, Gillespie BW, et al. Interim clinical outcomes in the Collaborative Initial Glaucoma Treatment Study comparing initial treatment randomized to medications or surgery. Ophthalmology. 2001;108(11):1943-53. 22. Holló G, Kóthy P, Vargha P. Evaluation of continuous 24-hour intraocular pressure monitoring for assessment of prostaglandin-induced pressure reduction in glaucoma. J Glaucoma. 2014;23(1):e6-12. 23. Hatanaka M, Babic M, Susanna R. Reproducibility of the mean, fluctuation, and IOP peak in the diurnal tension curve. J Glaucoma. 2013;22(5):390-2. 24. Jonas JB, Budde W, Stroux A, et al. Single intraocular pressure measurements and diurnal intraocular pressure profiles. Am J Ophthalmol. 2005;139(6):1136-7. 25. Liu JH, Kripke DF, Twa MD, et al. Twenty-four-hour pattern of intraocular pressure in the aging population. Invest Ophthalmol Vis Sci. 1999;40(12):2912-7. 26. Liu JHK, Zhang X, Kripke DF, et al. Twenty-four-hour intraocular pressure pattern associated with early glaucomatous changes. Invest Ophthalmol Vis Sci. 2003;44(4):1586-90. 27. Konstas AG, Kahook MY, Araie M, et al. Diurnal and 24-h intraocular pressures in glaucoma: monitoring strategies and impact on prognosis and treatment. Adv Ther. 2018;35(11):1775-804. 28. Vasconcelos de Moraes CG, Castro Reis AS, Sano ME, et al. Intraocular pressure profile during the modified diurnal tension curve using Goldman applanation tonometry and dynamic contour tonometry. J Ocul Biol Dis Infor. 2009;2(1):29-32. 29. Mosaed S, Liu JHK, Weinreb RN. Correlation between office and peak nocturnal intraocular pressures in healthy subjects and glaucoma patients. Am J Ophthalmol. 2005;139(2):320-4. 30. Hatanaka M, Babic M, Susanna R. Twenty-four-hour repeatability of diurnal intraocular pressure patterns in glaucomatous and ocular hypertensive individuals. Clinics (San Paulo). 2011;66(7):1235-6. 31. Yang D, Liu JHK, Wang N, et al. Correlation between office-hour and peak nocturnal intraocular pressure in patients treated with prostaglandin analogs. Am J Ophthalmol. 2020;215:112-7. 32. Pearce JG, Maddess T. The clinical interpretation of changes in intraocular pressure measurements using Goldmann applanation tonometry: a review. J Glaucoma. 2019;28(4):302-6. 33. Demirci G, Erdur SK, Tanriverdi C, et al. Comparison of rebound tonometry and non-contact airpuff tonometry to Goldmann applanation tonometry. Ther Adv Ophthalmol. 2019;11:2515841419835731. 34. Junk AK, Chang TC, Vanner E, et al. Current trends in tonometry and tonometer tip disinfection. J Glaucoma. 2020;29(7):507-12. 35. Whitacre MM, Stein R. Sources of error with use of Goldmann-type tonometers. Surv Ophthalmol. 1993;38(1):1-30. 36. Sanderson J, Rixon A, Williamson J. The ins and outs of pressure gradients. Rev Optom. 2019;156(7):46-51. 37. McCafferty S, Levine J, Schwiegerling J, et al. Goldmann and error correcting tonometry prisms compared to intracameral pressure. BMC Ophthalmol. 2018;18(1):2. 38. Kniestedt C, Nee M, Stamper RL. Accuracy of dynamic contour tonometry compared with applanation tonometry in human cadaver eyes of different hydration states. Graefes Arch Clin Exp Ophthalmol. 2005;243(4):359-66. 39. McCafferty S, Lim G, Duncan W, et al. Goldmann tonometer error correcting prism: clinical evaluation. Clin Ophthalmol. 2017;11:835-40. 40. Sng CCA, Ang M, Barton K. Central corneal thickness in glaucoma. Curr Opin Ophthalmol. 2017;28(2):120-6. 41. Gordon MO, Torri V, Miglior S, et al. Validated prediction model for the development of primary open-angle glaucoma in individuals with ocular hypertension. Ophthalmology. 2007;114(1):10-9. 42. Doğan M, Ertan E. Comparison of central corneal thickness measurements with standard ultrasonic pachymetry and optical devices. Clin Exp Optom. 2019;102(2):126-30. 43. Deol M, Taylor DA, Radcliffe NM. Corneal hysteresis and its relevance to glaucoma. Curr Opin Ophthalmol. 2015;26(2):96-102. 44. Park JH, Jun RM, Choi KR. Significance of corneal biomechanical properties in patients with progressive normal-tension glaucoma. Br J Ophthalmol. 2015;99(6):746-51. 45. de Moraes CVG, Hill V, Tello C, et al. Lower corneal hysteresis is associated with more rapid glaucomatous visual field progression. J Glaucoma. 2012;21(4):209-13. 46. Wells AP, Garway-Heath DF, Poostchi A, et al. Corneal hysteresis but not corneal thickness correlates with optic nerve surface compliance in glaucoma patients. Invest Ophthalmol Vis Sci. 2008;49(8):3262-8. 47. Medeiros FA, Meira-Freitas D, Lisboa R, et al. Corneal hysteresis as a risk factor for glaucoma progression: a prospective longitudinal study. Ophthalmology. 2013;120(8):1533-40. 48. Mangouritsas G, Morphis G, Mourtzoukos S, et al. Association between corneal hysteresis and central corneal thickness in glaucomatous and non-glaucomatous eyes. Acta Ophthalmol. 2009;87(8):901-5. 49. Pensyl D, Sullivan-Mee M, Torres-Monte M, et al. Combining corneal hysteresis with central corneal thickness and intraocular pressure for glaucoma risk assessment. Eye (Lond). 2012;26(10):1349-56. 50. Zhang X, Dastiridou A, Francis BA, et al. Comparison of glaucoma progression detection by optical coherence tomography and visual field. Am J Ophthalmol. 2017;184:63-74. 51. Kuang TM, Zhang C, Zangwill LM, et al. Estimating lead time gained by optical coherence tomography in detecting glaucoma before development of visual field defects. Ophthalmology. 2015;122(10):2002-9. 52. Tan O, Chopra V, Lu ATH, et al. Detection of macular ganglion cell loss in glaucoma by Fourier-domain optical coherence tomography. Ophthalmology. 2009;116(12):2305-14. 53. Saini C, Shen LQ. Monitoring glaucoma progression with OCT. Rev Ophthalmol. 2020;27(5):48-55. 54. Chen JJ, Kardon RH. Avoiding clinical misinterpretation and artifacts of optical coherence tomography analysis of the optic nerve, retinal nerve fiber layer, and ganglion cell layer. J Neuroophthalmol. 2016;36(4):417-38. 55. Hardin JS, Taibbi G, Nelson SC, et al. Factors affecting Cirrus-HD OCT optic disc scan quality: a review with case examples. J Ophthalmol. 2015;2015:746150. 56. WGA. Consensus 8. wga.one/wga/consensus-8/. Accessed July 31, 2020. 57. Chen TC, Hoguet A, Junk AK, et al. Spectral-domain OCT: helping the clinician diagnose glaucoma: a report by the American Academy of Ophthalmology. Ophthalmology. 2018;125(11):1817-27. 58. Mwanza JC, Lee G, Budenz DL, et al. Validation of the UNC OCT Index for the diagnosis of early glaucoma. Transl Vis Sci Technol. 2018;7(2):16. 59. Hood DC. Improving our understanding, and detection, of glaucomatous damage: an approach based upon optical coherence tomography (OCT). Prog Retin Eye Res. 2017;57:46-75. 60. Bojikian KD, Chen PP, Wen JC. Optical coherence tomography angiography in glaucoma. Curr Opin Ophthalmol. 2019;30(2):110-6. 61. Moghimi S, Hou H, Rao H, et al. Optical coherence tomography angiography and glaucoma: a brief review. Asia Pac J Ophthalmol (Phila). April 4, 2019. [Epub ahead of print]. 62. Phu J, Khuu SK, Agar A, et al. Clinical evaluation of Swedish interactive thresholding algorithm-faster compared with Swedish interactive thresholding algorithm-standard in normal subjects, glaucoma suspects, and patients with glaucoma. Am J Ophthalmol. 2019;208:251-64. 63. Wu Z, Medeiros FA. Recent developments in visual field testing for glaucoma. Curr Opin Ophthalmol. 2018;29(2):141-6. 64. Mwanza JC, Oakley JD, Budenz DL, et al. Macular ganglion cell-inner plexiform layer: automated detection and thickness reproducibility with spectral domain-optical coherence tomography in glaucoma. Invest Ophthalmol Vis Sci. 2011;52(11):8323-9. 65. Hood DC, Raza AS, de Moraes CGV, et al. Glaucomatous damage of the macula. Prog Retin Eye Res. 2013;32:1-21. 66. Hood DC, de Moraes CG. Four questions for every clinician diagnosing and monitoring glaucoma. J Glaucoma. 2018;27(8):657-64. 67. Sullivan-Mee M, Karin Tran MT, Pensyl D, et al. Prevalence, features, and severity of glaucomatous visual field loss measured with the 10-2 achromatic threshold visual field test. Am J Ophthalmol. 2016;168:40-51. 68. de Moraes CG, Hood DC, Thenappan A, et al. 24-2 visual fields miss central defects shown on 10-2 tests in glaucoma suspects, ocular hypertensives, and early glaucoma. Ophthalmology. 2017;124(10):1449-56. 69. Grillo LM, Wang DL, Ramachandran R, et al. The 24-2 visual field test misses central macular damage confirmed by the 10-2 visual field test and optical coherence tomography. Transl Vis Sci Technol. 2016;5(2):15. 70. Ehrlich AC, Raza AS, Ritch R, et al. Modifying the conventional visual field test pattern to improve the detection of early glaucomatous defects in the central 10°. Transl Vis Sci Technol. 2014;3(6):6. 71. Phu J, Kalloniatis M. Ability of 24-2C and 24-2 grids in identifying central visual field defects and structure-function concordance in glaucoma and suspects. Am J Ophthalmol. July 1, 2020. [Epub ahead of print]. 72. Fung SSM, Lemer C, Russell RA, et al. Are practical recommendations practiced? A national multi-centre cross-sectional study on frequency of visual field testing in glaucoma. Br J Ophthalmol. 2013;97(7):843-7. 73. Chauhan BC, Garway-Heath DF, Goñi FJ, et al. Practical recommendations for measuring rates of visual field change in glaucoma. Br J Ophthalmol. 2008;92(4):569-73. 74. Heijl A, Patella VM, Chong LX, et al. A new SITA perimetric threshold testing algorithm: construction and a multicenter clinical study. Am J Ophthalmol. 2019;198:154-65. 75. Bengtsson B, Heijl A. False-negative responses in glaucoma perimetry: indicators of patient performance or test reliability? Invest Ophthalmol Vis Sci. 2000;41(8):2201-4. 76. Artes PH. Effective Perimetry. Zeiss Visual Field Primer, 4th Edition. Heijl, Bengtsson & Patella. 2012. 77. Ishiyama Y, Murata H, Mayama C, et al. An objective evaluation of gaze tracking in Humphrey perimetry and the relation with the reproducibility of visual fields: a pilot study in glaucoma. Invest Ophthalmol Vis Sci. 2014;55(12):8149-52. 78. Ishiyama Y, Murata H, Asaoka R. The usefulness of gaze tracking as an index of visual field reliability in glaucoma patients. Invest Ophthalmol Vis Sci. 2015;56(11):6233-6. 79. Wilsey LJ, Fortune B. Electroretinography in glaucoma diagnosis. Curr Opin Ophthalmol. 2016;27(2):118-24. 80. Turkey E, Elsanabary ZSE, Elshazly LHM, et al. Role of pattern electroretinogram in ocular hypertension and early glaucoma. J Glaucoma. 2019;28(10):871-7. 81. Jung KI, Jeon S, Shin DY, et al. Pattern electroretinograms in preperimetric and perimetric glaucoma. Am J Ophthalmol. 2020;215:118-26. 82. Senger C, Moreto R, Watanabe SES, et al. Electrophysiology in glaucoma. J Glaucoma. 2020;29(2):147-53. |