UPDATE!!!In the August 2024 issue of Review of Optometry—our 48th annual Contact Lens report—experts provide the tips and tools you need to start offering specialty lenses at your practice. In two more features, the authors deep-dive into soft lens optics and CL complications. Check out the other articles featured in this issue:
|
Geographic atrophy (GA) is the most advanced form of dry age-related macular degeneration (AMD) and can occur concomitantly with choroidal neovascular membrane (CNVM) or wet AMD. Patients with GA present with highly variable visual complaints that range from a minor impact on vision to severe visual impairment that significantly affects activities of daily living and quality of life. Not all patients with GA have decreased visual acuity, but many still suffer from deficits in visual function not often assessed with routine eye exams, including reduced contrast sensitivity, central visual field loss, reduced reading speeds and alterations in dark adaptation.1
Visual symptoms are often related to the degree of photoreceptor loss lesion number, size and locality, with respect to the fovea. Several clinical tests of retinal structure and function are available to help optometrists monitor disease progression and provide the necessary tools to improve these patients’ visual experiences.
Pathophysiology of GA
In AMD, the complex of photoreceptors, retinal pigment epithelium (RPE), Bruch’s membrane and choriocapillaris is disrupted. Large, soft drusen develop often as a precursor to GA and are an accumulation of sub-RPE waste product.2 In some patients, they continue to accumulate or coalesce and eventually may collapse, resulting in well-demarcated GA lesion(s) where photoreceptor loss, RPE atrophy and choriocapillaris thinning occur.2,3 Particular to GA, the RPE is inhibited, leading to photoreceptor dysfunction and death and, consequently, a thinned choriocapillaris in corresponding areas.4
Numerous factors may contribute to the development of AMD, including genetics, environmental stressors, oxidative stress and inflammation. Systemic diseases such as dyslipidemia and hypertension are associated with an increased risk of AMD, as is smoking.5 Concerning GA development, the complement pathway is dysregulated and many gene polymorphisms related to the complement pathway have been implicated in individuals with GA.5
 |
|
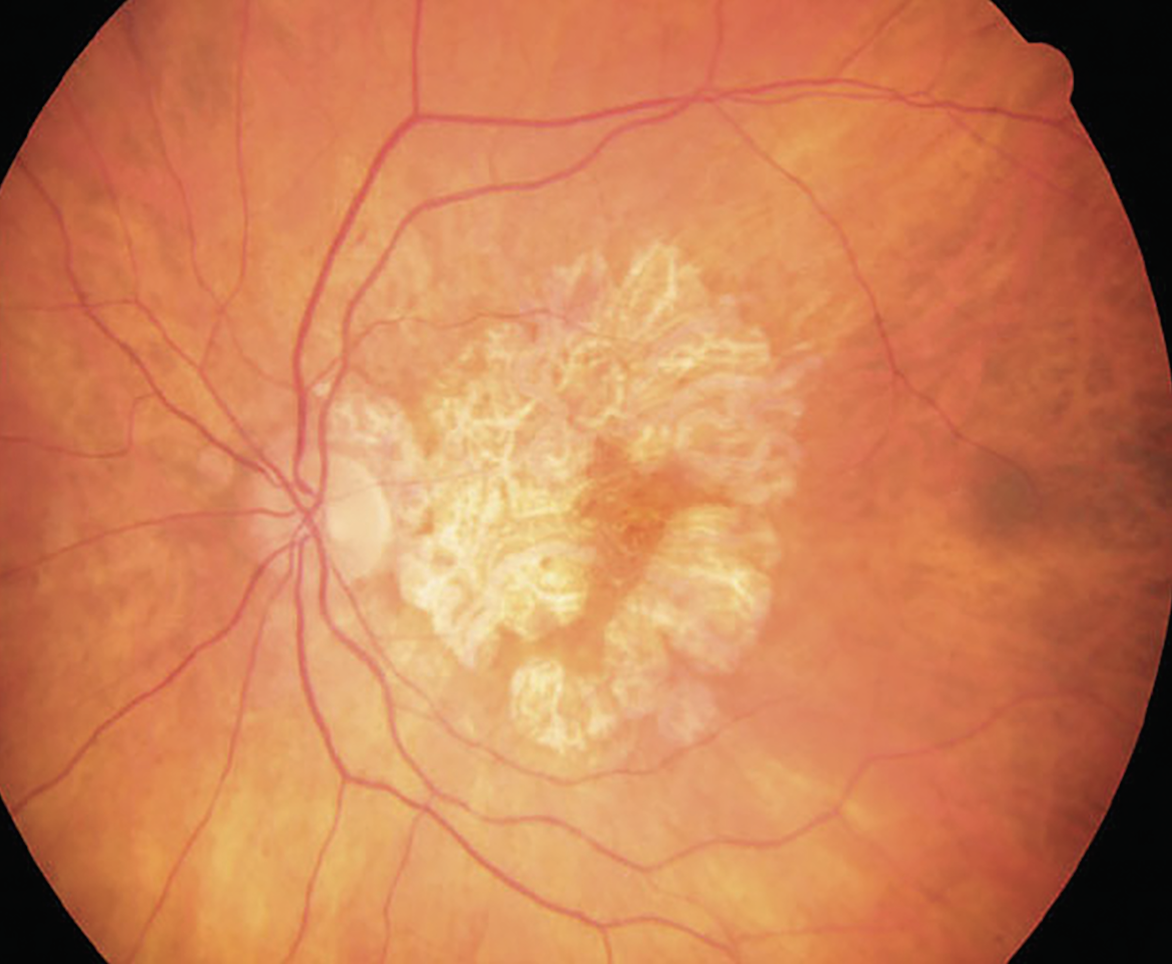
Fig. 1. GA not only impacts patients’ ability to perform daily living activities, but also their quality of life. Photo: Wendy Harrison, OD, PhD, and Joe Wheat, OD, PhD. Click image to enlarge. |
Clinical Assessment
Retinal imaging modalities in combination with a dilated fundus exam are invaluable to clinically assess GA. Optical coherence tomography (OCT) and blue fundus autofluorescence (FAF) imaging provide keys to the integrity of the outer retinal layers that are affected. OCT provides cross-sectional images of the retinal layers, allowing for assessment of the presence, absence and integrity of these layers, as well as the evaluation of biomarkers associated with GA. A recent meta-analysis identified six OCT biomarkers with a greater predictive value for late AMD than large drusen: external limiting membrane, ellipsoid zone and interdigitation zone abnormalities as well as concurrent large drusen, reticular pseudodrusen, hyporeflective drusen cores and intraretinal hyperreflective foci (IHRF).6 The latter two findings had the highest predictive value; similarly, other studies have associated IHRF with GA.6,7 IHRF may represent migrating RPE cells, activated microglia or dissagregated photoreceptors that occur with GA.7
En face OCT is also useful when monitoring patients with GA, providing clinicians a more comprehensive view of the entire macular region or posterior pole to assess the number and size of GA lesions. Many OCT systems have built-in or manual tools to view the full GA lesions and quantify their area over time.
FAF is another great clinical tool that allows us to assess RPE activity by the fluorophore A2E, which is present in lipofuscin. This lipid-based pigment is generally upregulated when there is an increase in RPE activity, and patterns of FAF may signal active RPE stress. In GA lesions, the RPE has atrophied, so no signal is generated and the lesions appear black. However, different phenotypic patterns can be observed at the borders of GA lesions. Banded and diffuse FAF patterns at the border of GA lesions are associated with increased growth of lesion size.8
Instruments such as the Spectralis OCT (Heidelberg Engineering) can capture both FAF and OCT images. The size of GA lesions identified on FAF corresponds to complete degeneration of the outer retinal layers on OCT.9 As our knowledge of OCT biomarkers and how to use them in clinical practice evolves, so must our understanding of how these may be related to visual function metrics that could be impaired in GA patients.
 |
|
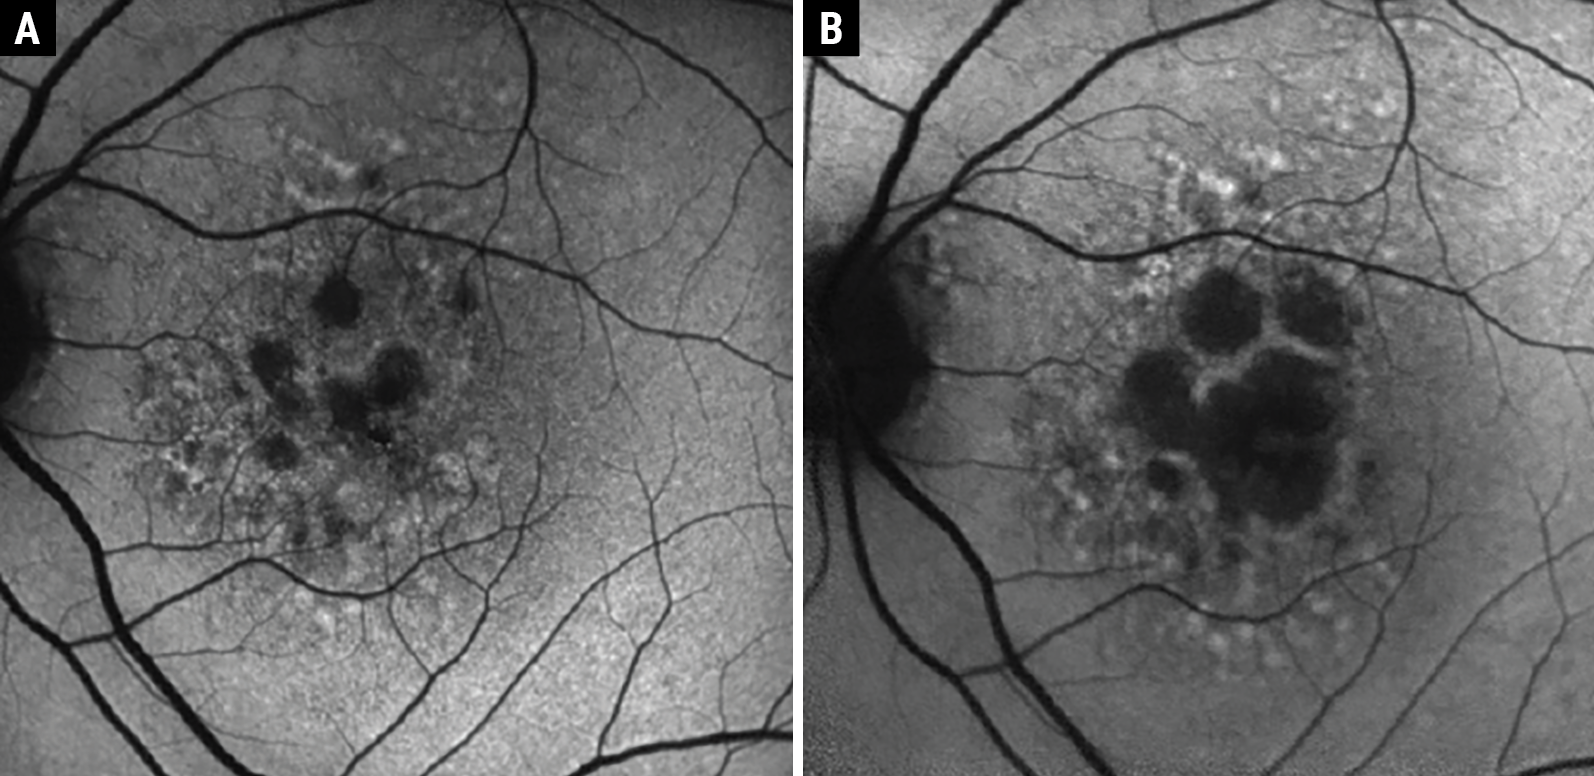
Fig. 2. Example of GA progression over two years with FAF. At baseline, the patient had numerous small atrophic lesions (A). After two years, there was significant enlargement of the GA lesions encroaching the fovea (B); however, visual acuity was maintained at 20/25. Despite good visual acuity, this patient has substantial photoreceptor loss and suffers from other deficits of visual function that should trigger a referral to a vision rehab specialist. Click image to enlarge. |
The visual function of patients with GA often depends on the number and area of GA lesions and their proximity to the fovea or foveal involvement. When monitoring GA patients, pay special attention to markers of progression on retinal imaging. This may include increases in area or number of lesions combined with photoreceptor loss detected with OCT. These findings should then be considered alongside each patient’s unique visual demands and needs. For example, Figure 2 shows the progression of a lesion over two years, but the visual acuity remained at 20/25 due to some sparing of the central fovea. However, this patient has several large GA lesions that encompass a substantial area of the macula.
Intravitreal injections that inhibit the complement pathway have been approved for GA, providing some hope for patients in slowing disease progression. However, there is still substantial debate in the retina community regarding the effectiveness of these medications. While the size of the lesion may benefit from treatment, the benefit to visual function for the patient is unclear.10 Additionally, these medications do not restore the areas of GA lost. Therefore, even when patients are treated or slowly progressing, they often require vision rehabilitation. When tasks of daily living or quality of life are impacted in patients with GA, additional functional assessments of vision are warranted even when visual acuity is maintained.
When monitoring GA patients, take the time to inquire about the visual demands of each patient to determine additional tests of visual function, like contrast sensitivity or reading speed. The results of these tests can provide the necessary tools and education needed to maintain or improve their quality of life by helping patients meet their visual demands. Findings from the examination and clinical imaging can help guide discussions with the patients about their visual deficits that may be masked by good visual acuity.
Assessing Visual Function
Functional day-to-day tasks are significantly impacted from vision impairment due to AMD, as evidenced by a review of 1,111 studies on humanistic burden using the National Eye Institute’s Visual Function Questionnaire.11 Specifically, patients with GA have lower composite and subscale scores for near and distance activities, color vision, dependency, driving, social functioning and mental health.11 Although visual acuity is often our first piece of testing, it rarely provides a full picture of the level of impairment and retinal function. To better understand the level of impairment due to GA in each patient, a handful of tests can be performed, including reading speed, contrast sensitivity, Amsler grid and microperimetry, among others.
 |
|
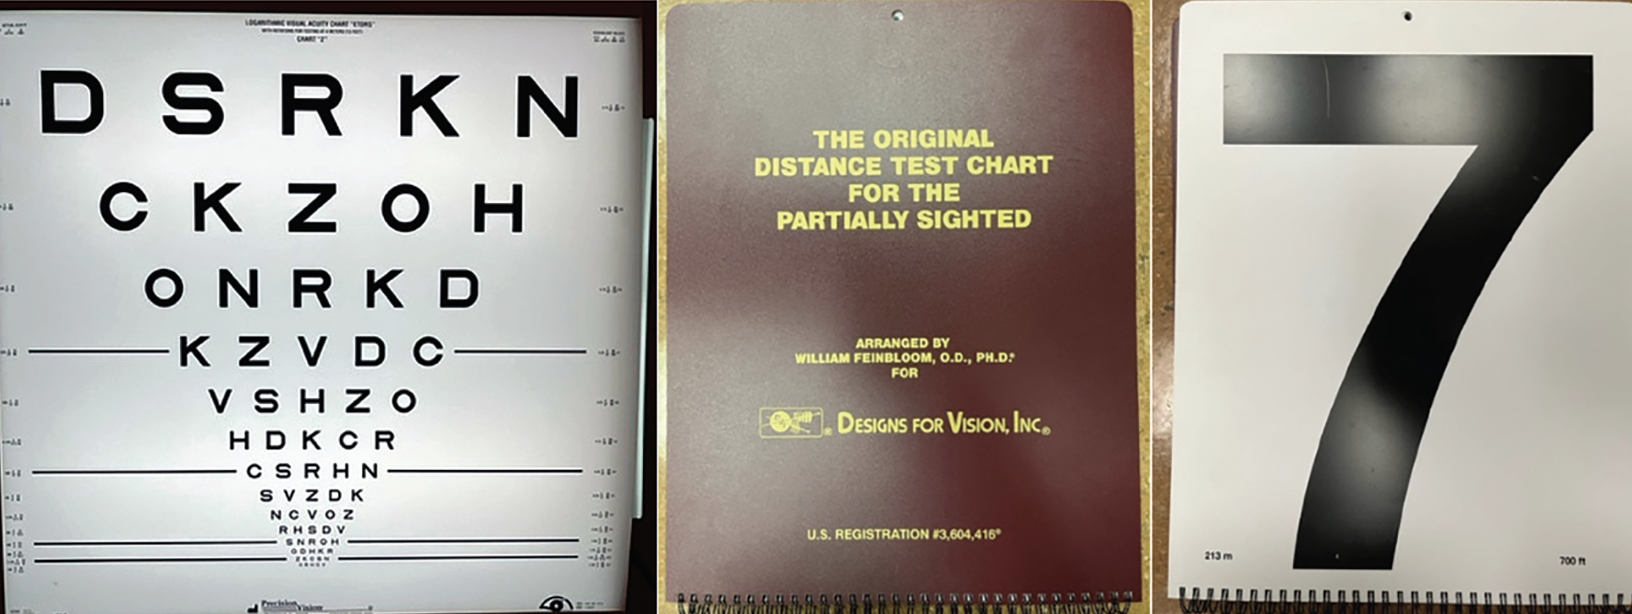
Fig. 3. The ETDRS chart (left) and Feinbloom Low Vision chart (middle/right) are useful for assessing vision in GA patients who are unable to read the largest optotypes from the standard 4m viewing distance. Click image to enlarge. |
In patients with GA, the Early Treatment Diabetic Retinopathy Study (ETDRS) chart or Feinbloom Low Vision chart allows for a more accurate assessment of vision than the traditional Snellen chart because of their smaller jumps in optotype size (Figure 3). When a low vision chart is unavailable, electronic visual acuity charts will work better than standard projector charts due to higher contrast. Depending on the extent of foveal involvement, patients can often continue to read isolated individual letters and maintain normal best-corrected visual acuity (BCVA) despite having significant symptoms. Lesion size alone does not necessarily allow for predictive visual acuity values, however, as GA progresses from nonsubfoveal to subfoveal involvement, central vision suffers. This progression takes on average 1.4 to 2.5 years.7
A meticulous refraction gives the best possible starting place for magnification. In a retrospective study of 739 patients referred to a low vision clinic for the first time, refraction improved visual acuity by two lines or more in 11% of the patients.12 Phoropters’ eye openings limit field of view and can cause contrast reduction.13 Trial frame refraction (TF) is the best technique to obtain a BCVA for a patient with reduced visual acuity from GA. TF allows for larger jumps in lens testing compared to the single 0.25D jumps seen on phoropter refraction, as the just-noticeable difference threshold will likely be different in GA patients. TF refraction also allows for different head postures due to neck and back issues and eccentric viewing, using nonfoveated areas of the retina due to scarring or atrophy at the fovea. Trial frame use allows patients to sample the new glasses prescription in more “real-world scenarios” that mimic their daily visual tasks and demands, such as at a computer, on their phone or walking around the clinic.13
Reading speed demonstrates a patient’s functional ability to read longer phrases of words or sentences rather than spotting single-target letters. This measure is quantified by the number of words correctly identified in a prescribed amount of time. As GA progresses, reading speed declines.14 Patients with GA with a BCVA of 20/50 or better read significantly slower than the average intermediate AMD patient.1 Over just two years, patients with GA in a prospective natural history study were found to decrease in reading speed from 110 words per minute (wpm) at baseline to just 51 wpm.1 Over the same two-year period, reading speed decreased from 130 wpm at baseline to 117 wpm in patients with drusen alone.1 Patients with lesions of GA larger than 10mm2 have a median reading speed of 71.1 wpm compared to the smaller lesion size of less than 10mm2 reading at a median of 150.0 wpm.15
An Amsler grid can help determine central visual field impairment and potential areas of distortion or blind spots. Ease of use is beneficial, as patients can use the chart to self-monitor their vision. Amsler grid has 67% sensitivity and 99% specificity in exudative macular degeneration. With nonexudative macular degeneration, the specificity (71%) and sensitivity (63%) are much closer, indicating that it is far less specific.16 Due to the higher sensitivity, this test is more beneficial for a new area of CNV in exudative macular degeneration. This is likely because the onset of new CNVM is acute, whereas changes due to GA may be so gradual that a patient may not notice the metamorphopsia or blind spots occurring due to adaptation.
Low-luminance visual acuity (LLVA) is a measure of visual function in low light and is performed similarly to BCVA but with a neutral density filter covering one eye to attenuate light exposure.17 The low-luminance deficit (LLD) is then calculated as the difference between a patient’s BCVA and LLVA. In addition to assessing vision in reduced illumination, LLD has potential as a robust study endpoint as it may predict lesion enlargement in GA and resultant vision loss.17 This is intuitive, as the LLVA is testing cone function in dim illumination and we know that cone function in a dark-adapted state is reduced in AMD.18 Therefore, we are likely assessing the dysfunctional cones adjacent to the GA lesions in addition to the cones we know are lost within the lesions. It is, however, important to recognize that the LLD may improve as GA progresses when foveal cones are lost and spared peripheral cones are used for eccentric fixation.18
Similar to LLVA, contrast sensitivity is an indirect measure of cone function and is measured with charts like the Pelli-Robson or Mars contrast sensitivity tests. Contrast sensitivity measures the ability to detect targets of equal size as they decrease in contrast. Compared to BCVA, LLVA and reading speed, there is a strong correlation between contrast sensitivity and retinal function as well as total area of macular GA defined by hypoautofluorescence in the central 1mm on FAF.19
Microperimetry also measures central retinal sensitivity and allows a more precise way to map areas of functional and nonfunctional retina in the macula when compared to reading charts. The test is performed similarly to most automated visual field tests by varying light intensity to stimulate the macula. Like all other visual field tests, results depend on a patient’s subjective ability to respond to a stimulus. Patients with central vision loss often use eccentric viewing to use their peripheral retina that is yet to be affected. This can influence most peripheral visual field tests, as the fixation tracker senses poor fixation and results in lower reliability.
Fortunately, with microperimeters, GA patients can still use eccentric viewing, as an infrared camera monitors the patients’ fixation point to track more accurately and map out the visual field on the fundus. This fundus map can help isolate a patient’s preferred retinal locus and allow them to use eccentric viewing to the best of their ability. Microperimetry performed in patients with GA reveals that retinal sensitivity reduction is more global in the fundus and not confined only to the GA and adjacent regions.17
Impacts on Quality of Life
This important measure can be greatly reduced in a short time in geographic atrophy patients, especially when their ability to do everyday tasks is impacted. Many patients with GA express difficulty with daily tasks such as cooking, reading and driving, as well as with hobbies like painting and crochet. Patients also complain of difficulty with facial recognition, especially once central vision is impacted, which may be isolating and cause them to avoid social situations that may bring attention to their deficit. Studies have shown this becomes a more pressing challenge in the later stages of AMD, with one finding that GA patients could identify fewer faces on average than those with early and intermediate AMD.20
It is also common for patients with GA to give up driving, which markedly impacts independence.21 A study in the UK of 1,901 patients with GA found 66.7% of those with bilateral GA who were previously eligible to drive dropped below the eligibility level (better eye visual acuity>20/40) at a mean rate of 1.6 years.22 In that same cohort, 89% of the patients who were not initially blind (n=1,693) became legally blind over a median period of 6.2 years.22 The ability to drive is not taken for granted by GA patients, as most with active driver’s licenses in one study reported mainly traveling with a partner or friend. Additionally, the main reason for giving up driving was eyesight.23
When you need to ask for help to do most things, dependence can lead to clinical depression. Patients with GA are at high risk of developing clinical depression due to a lack of independence stemming from vision loss. Interestingly, patients with blindness in one eye due to AMD are more affected by depression than those with loss in both.24 It is suggested that the fear of losing vision in the unaffected eye increases the rate of depression.24 Patients with AMD have an elevated emotional stress level similar to patients with disabling chronic illness (i.e., arthritis, acquired immunodeficiency syndrome, chronic obstructive pulmonary disease and bone marrow transplant).24
Furthermore, GA patients experiencing high levels of depression, fear, anxiety and social isolation are more likely to fall.25 In one cohort study, patients with a code of atrophic AMD (n=26,942) had an increased risk of hip fracture of 11% over four years compared to those without an AMD code (n=1,012,748).26 As many of us are aware, a hip fracture increases mortality in the year following the incident. Not only does GA increase difficulty with daily living activities, but it can also have a profound impact on mental health and potentially lead to increased mortality.
As mentioned above, new therapeutic interventions are now approved for GA. As it is unclear how substantial the benefit to visual function is for patients, there is a looming concern that the addition of frequent office visits necessary for treatment may further burden patients with GA and negatively impact their quality of life.10
Low Vision Rehabilitation
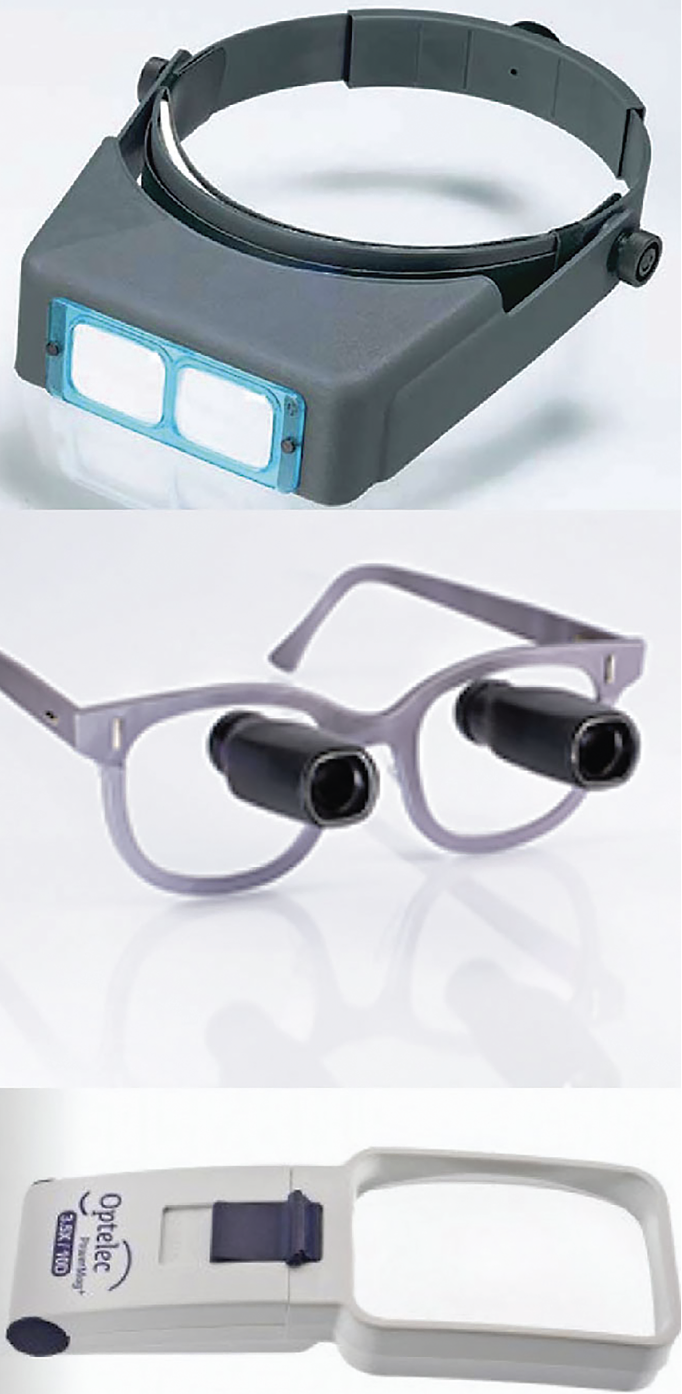 |
| Fig. 4. Three low vision aids include Optivisor (Donegan Optical Company) with light for intermediate tasks (top), spectacle-mounted telescope for distance enhancement (middle) and Optelec illuminated handheld magnifier for spot reading (bottom). Click image to enlarge. |
By helping GA patients use the vision they do have to the best of their ability, low vision rehabilitation may reduce some of the visual difficulties these individuals face. This may include magnification tools, adaptive technology, increased lighting or contrast, tints and filters or education on alternative ways to perform everyday tasks.
Magnification increases the size of the target to subtend a larger area of the retina than the area impacted by the GA. Even though the image may still not be clear, this allows the patient to distinguish the target more easily. This can allow a patient to improve character recognition and reading ability.27 The downsides are that as magnification increases, the field of view decreases, and if using optical magnification, the working distance reduces proportionally. Therefore, a “stronger is better” mantra does not work. Low vision providers choose a magnification power just large enough to pick out the targeted size while maintaining as much field of view as possible.
Depending on a patient’s vision level, target size, target distance, dexterity and financial budget, they choose a device that best works for their situation. This can include handheld, stand or spectacle-mounted for near tasks. Telescopes can be either handheld or spectacle-mounted for distance tasks and, in some cases, even driving, depending on one’s state and legal requirements (Figure 4 shows several examples of low vision aids).28,29
When optical magnification does not suit a patient’s needs, electronic magnification can often fill in the gap. Electronic magnification allows for closer imaging and a greater field of view than optical magnification. This tool often also includes increased contrast settings to help offset the decreased contrast sensitivity many patients with GA have.30 Increased contrast can be used in other settings, as well, such as bright-colored tape on the edges of stairs, differing contrast with light-colored foods on dark plates and vice versa or much brighter lighting in home or work settings. When light becomes too glaring (such as outdoors on a bright sunny day), absorptive filters and tints can help block bothersome wavelengths of light and increase overall contrast levels.13 When a patient’s ability to use magnification becomes too laborious, text-to-speech and adaptive technology options are quite useful. Audiobooks, text-to-speech on tablets, computers, phones and other electronic tools allow patients to dial back their vision demands.30
When limited time and resources restrict time with a patient’s care, referral to low vision rehabilitation can help give a patient back some independence, activities of daily living and improved mental health.13
Takeaways
Each patient with GA is unique, as are their visual function deficits. A team of eyecare providers is needed to monitor disease progression, potentially treat GA and maximize patients’ vision with education and tools. Additionally, healthcare providers from occupational and physical therapy or psychology services may be warranted for those with mobility and mental health issues due to their vision loss. In the context of GA, coordination of care is critical.
Dr. Sapoznik is a clinician scientist and assistant professor at the University of Houston College of Optometry (UHCO). At Indiana University School of Optometry (IUSO), she completed an ocular disease residency in 2014 and earned her PhD in vision science in 2021. Dr. Sapoznik is a clinical attending in the ocular diagnostic and medical eye services clinic at UHCO, where her lab uses high-resolution retinal imaging to investigate vascular changes in aging and disease.
Dr. Hable completed a residency at VA Hudson Valley Health Care System in 2016. She is an associate clinical professor at IUSO working with fourth-year optometry students in the vision rehabilitation service of the Indianapolis Eye Care Center, where she treats patients with visual impairment from ocular disease, stroke and traumatic brain injury.
1. Sunness JS, Rubin GS, Applegate CA, et al. Visual function abnormalities and prognosis in eyes with age-related geographic atrophy of the macula and good visual acuity. Ophthalmology. 1997;104(10):1677-91. 2. Boyer DS, Schmidt-Erfurth U, van Lookeren Campagne M, et al. The pathophysiology of geographic atrophy secondary to age-related macular degeneration and the complement pathway as a therapeutic target. Retina. 2017;37(5):819-35. 3. Holz FG, Strauss EC, Schmitz-Valckenberg S, van Lookeren Campagne M. Geographic atrophy: clinical features and potential therapeutic approaches. Ophthalmology. 2014;121(5):1079-91. 4. McLeod DS, Grebe R, Bhutto I, et al. Relationship between RPE and choriocapillaris in age-related macular degeneration. Invest Ophthalmol Vis Sci. 2009;50(10):4982-91. 5. Cheung CM, Wong TY. Is age-related macular degeneration a manifestation of systemic disease? New prospects for early intervention and treatment. J Intern Med. 2014;276(2):140-53. 6. Trinh M, Cheung R, Duong A, et al. OCT prognostic biomarkers for progression to late age-related macular degeneration: a systematic review and meta-analysis. Ophthalmol Retina. 2024;8(6):553-565. 7. Fragiotta S, Abdolrahimzadeh S, Dolz-Marco R, et al. Significance of hyperreflective foci as an optical coherence tomography biomarker in retinal diseases: characterization and clinical implications. J Ophthalmol. 2021;6096017. 8. Holz FG, Bindewald-Wittich A, Fleckenstein M, et al. Progression of geographic atrophy and impact of fundus autofluorescence patterns in age-related macular degeneration. Am J Ophthalmol. 2007;143(3):463-72. 9. Schmitz-Valckenberg S, Fleckenstein M, Göbel AP, et al. Optical coherence tomography and autofluorescence findings in areas with geographic atrophy due to age-related macular degeneration. Invest Ophthalmol Vis Sci. 2011;52(1):1-6. 10. Spaide RF, Vavvas DG. Complement inhibition for geographic atrophy: review of salient functional outcomes and perspective. Retina. 2023;43(7). 11. Sarda SP, Heyes A, Bektas M, et al. Humanistic and economic burden of geographic atrophy: A systematic literature review. Clin Ophthalmol. 2021;15:4629-44. 12. Sunness JS, El Annan J. Improvement of visual acuity by refraction in a low-vision population. Ophthalmology. 2010;117(7):1442-6. 13. Jamara R. Low Vision Rehabilitation. Ridgeview Publishing; 2020. 14. Fleckenstein M, Mitchell P, Freund KB, et al. The progression of geographic atrophy secondary to age-related macular degeneration. Ophthalmology. 2018;125(3):369-90. 15. Varma R, Souied EH, Tufail A, et al. Maximum reading speed in patients with geographic atrophy secondary to age-related macular degeneration. Invest Ophthalmol Vis Sci. 2018;59(4):AMD195-201. 16. Bjerager J, Schneider M, Potapenko I, et al. Diagnostic accuracy of the Amsler grid test for detecting neovascular age-related macular degeneration: a systematic review and meta-analysis. JAMA Ophthalmol. 2023;141(4):315-23. 17. Sadda SR, Chakravarthy U, Birch DG, et al. Clinical endpoints for the study of geographic atrophy secondary to age-related macular degeneration. Retina. 2016;36(10):1806-22. 18. Sunness JS, Rubin GS, Broman AM, et al. Low luminance visual dysfunction as a predictor of subsequent visual acuity loss from geographic atrophy in age-related macular degeneration. Ophthalmology. 2008;115(9):1480-8. 19. Hoffmann L, Rossouw P, Guichard MM, Hatz K. Strongest correlation between contrast sensitivity and morphological characteristics in bilateral nAMD. Front Med (Lausanne). 2020;7:622877. 20. Taylor DJ, Smith ND, Binns AM, Crabb DP. The effect of non-neovascular age-related macular degeneration on face recognition performance. Graefes Arch Clin Exp Ophthalmol. 2018;256(4):815-21. 21. Patel PJ, Ziemssen F, Ng E, et al. Burden of illness in geographic atrophy: A study of vision-related quality of life and health care resource use. Clin Ophthalmol. 2020;14:15-28. 22. Chakravarthy U, Bailey CC, Johnston RL, et al. Characterizing disease burden and progression of geographic atrophy secondary to age-related macular degeneration. Ophthalmology. 2018;125(6):842-9. 23. Choi NG, DiNitto DM. Depressive symptoms among older adults who do not drive: association with mobility resources and perceived transportation barriers. The Gerontologist. 2015;56(3):432-43. 24. Williams RA, Brody BL, Thomas RG, et al. The psychosocial impact of macular degeneration. Arch Ophthalmol. 1998;116(4):514-20. 25. Rovner BW, Casten RJ, Tasman WS. Effect of depression on vision function in age-related macular degeneration. Arch Ophthalmol. 2002;120(8):1041-4. 26. Anastasopoulos E, Yu F, Coleman AL. Age-related macular degeneration is associated with an increased risk of hip fractures in the Medicare database. Am J Ophthalmol. 2006;142(6):1081-3. 27. Nowakowski RW. Primary Low Vision Care. Appleton & Lange; 1994. 28. Mattingly WB. Advanced low vision optics. J Ophthalmic Nurs Technol. 1994;13(4):161-8. 29. Szlyk JP, Seiple W, Laderman DJ, et al. Measuring the effectiveness of bioptic telescopes for persons with central vision loss. J Rehabil Res Dev. 2000;37(1):101-8. 30. Crossland MD, Silva RS, Macedo AF. Smartphone, tablet computer and e-reader use by people with vision impairment. Ophthalmic Physiol Opt. 2014;34(5):552-7. |