Identifying glaucoma and assessing its severity in any given patient is like putting together a jigsaw puzzle without having the picture on the box in front of you. Strewn about are many different pieces of information—IOP, disc assessment, visual fields, RNFL analysis, corneal thickness, angle assessment, corneal biomechanics, age, race, family history and so on. You have to make all these pieces fit together into a coherent whole to decide whether the patient does indeed have glaucoma or ocular hypertension, is considered a suspect or gets a clean bill of health. But, lacking a completed picture to guide your efforts, you often find the pieces don’t always fit nicely together. This often happens when our diagnostic tests, amazing as they are with today’s technology, do not make sense or correlate with each other. There is also the possibility that tests produce false or inaccurate results due to other underlying factors.
 |
|
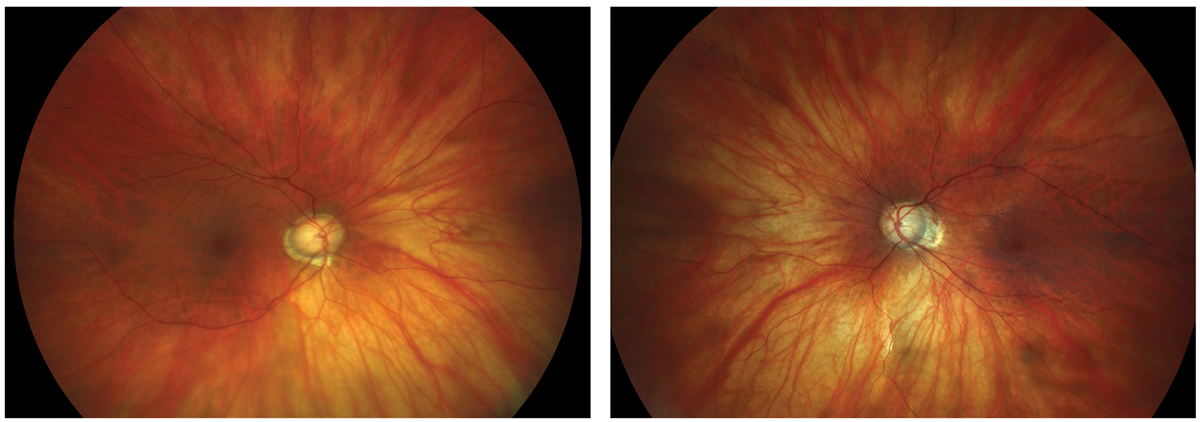
Figs. 1 and 2. Large discs and cups in a highly myopic patient. Click image to enlarge. |
When does this happen, and what can we do about it? Here are some examples of relatively common diagnostic pitfalls and how to use all the information at hand to make the best decision possible in the diagnosis and treatment of these tricky patients.
 |
|
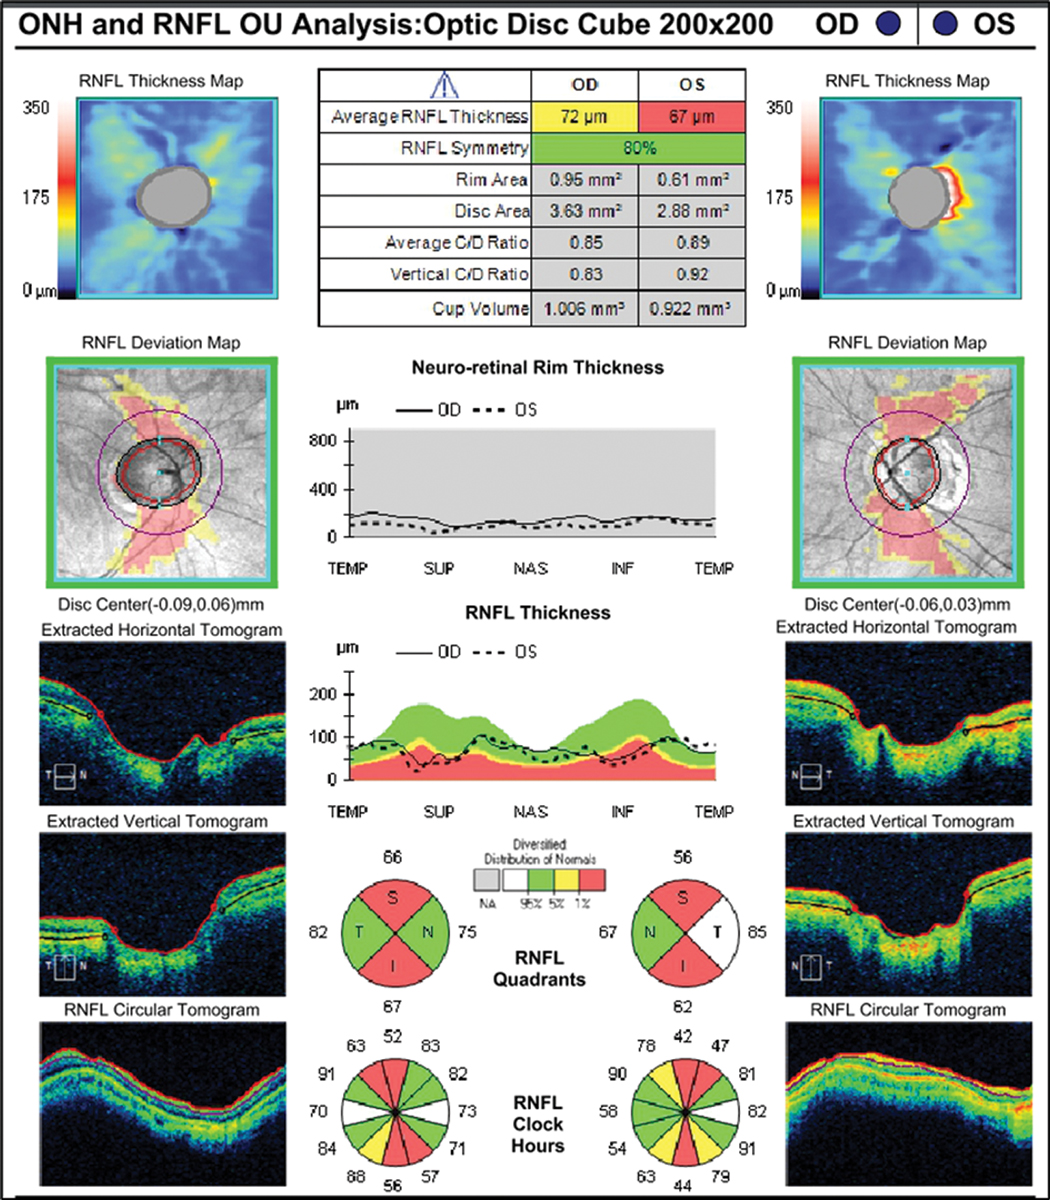
Fig. 3. RNFL analysis shows vertical thinning but confirms large disc diameter OD>OS. Click image to enlarge. |
High Myopia with Large Discs
This type of patient has the distinction of being able to demonstrate two diagnostic pitfalls at one time: high myopia and large physiological disc diameters. As shown in the color disc photos, these optic nerves appear clearly suspicious for glaucoma (Figures 1 and 2). This patient is a -12D myope with mild cataract OD, an intraocular lens OS and a history of medical treatment for glaucoma (prior to cataract surgery). Currently her IOP is 16mm Hg OU without any therapy. Is treatment necessary? Is glaucoma the correct diagnosis or is this just a suspect?
When analyzed with retinal nerve fiber layer (RNFL) OCT, there appears to be relative thinning of the RNFL superiorly and inferiorly OU. Notably, the optic disc area is very large. When evaluating myopic patients with large disc size, practitioners need to consider two possibilities: (1) the instrument correctly identifies structural damage to the RNFL (or ganglion cell complex) due to glaucoma or (2) the software “misreads” the data and signals abnormality that is only anatomic or physiological in nature, and not related to disease (Figure 3).
Part of the explanation for this is related to the reference database (unique to each OCT), upon which the report analyses are based. Reference databases have limitations and do not include sufficient representation of large, normal physiological variations in optic nerve appearance. As related to this case, we know that high myopes (up to -12D) were eligible for inclusion in the database, but based upon disc area, only 11 of 282 subjects had a disc area of >2.5mm2 for the Cirrus OCT by Carl Zeiss Meditec.1
On the RNFL report, we see that this patient has huge discs—areas of 3.63mm2 and 2.88mm2, respectively. So, although we see red flags here (literally) indicating very thin areas of RNFL, we need to be cautious due to possible presence of misinterpretation of the patient’s scan, as it falls outside of the database. This potentially could be an example of “red disease,” when non-glaucoma–related OCT findings are marked as abnormal on the color scale and mistaken as evidence for glaucoma by the clinician.
 |
|
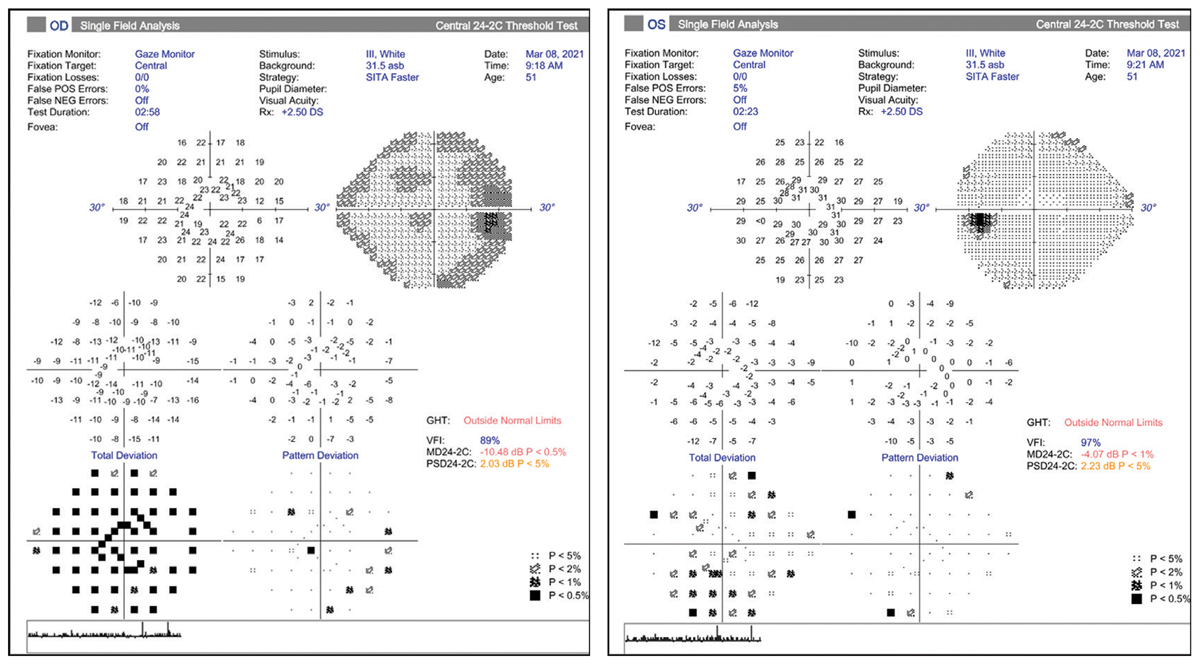
Figs. 4 and 5. Visual fields do not show loss that corresponds to RNFL loss indicated in Fig. 3. Click image to enlarge. |
To help avoid this misinterpretation, it is critical to review the visual field analysis, which tells a different story (Figures 4 and 5). For the right eye, we see a generalized depression on the total deviation plot (due to cataract) that is reduced on the pattern deviation plot. Thus, there is no glaucomatous visual field loss, defined by three or more contiguous point defects that are 3db or more outside the normal range for the patient’s age. The left eye demonstrates a relatively normal field, also without any definitive glaucomatous defects. Note again that scattered defects on the total deviation plot are mostly cleared on the pattern deviation plot.
It is crucial to compare the suspected zones of damage noted on the OCT with the corresponding points on the visual field analysis (here we would expect superior and inferior arcuate defects). This would confirm the typical structural and functional relationship that we observe in a true glaucomatous optic neuropathy.2 Since the OCT and visual field diagnostic tests do not correlate exactly, we need to consider if the OCT is showing damage in advance of the visual field, which is certainly possible, or if the visual fields more accurately demonstrate lack of glaucomatous disease.
After several follow-up visits, careful review and repeating these diagnostic tests, we elected to monitor the patient closely, despite the suspicious OCT findings. Part of our consideration was that she may have had elevated IOP in the past, which is now in the normal range post-cataract extraction. She will be monitored through follow-up visits to detect signs of progression on visual field testing and in RNFL thickness on OCT.
 |
|
Fig. 6. Visual field of left eye with high false positives and a “reverse cataract” pattern. Click image to enlarge. |
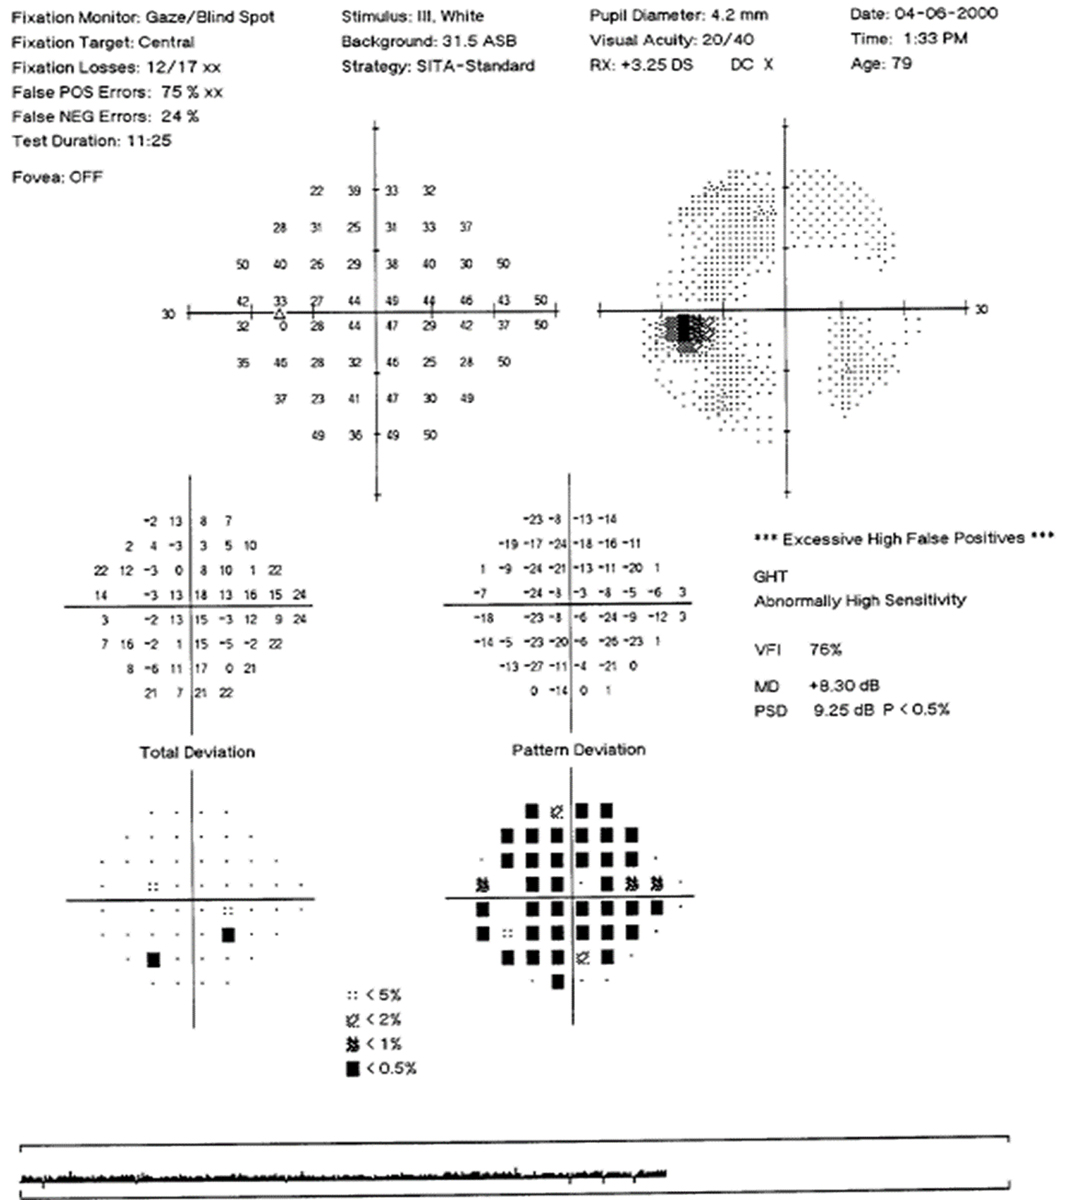
Visual Field Pitfall: False Positives
Standard automated perimetry is one of the traditional gold standards in documenting the presence and progression of glaucomatous damage, and getting a good sense of test reliability is crucial. With the newer, faster test strategies, such as SITA-Faster (Carl Zeiss Meditec), we have the opportunity for more frequent testing due to shorter test time and less patient fatigue. However, the perks of faster testing come with a risk of increased false positive rates.3
False positives are the most important of the visual field reliability indices: the machine takes a pause and does not present a stimulus, checking to see if the patient clicks anyway. The calculated percentage is based on the number of times the patient clicks when no stimulus was presented. High false positives can result in field plots that have a clear or “white” looking greyscale map, do not show any defect on the total deviation but have significant defects on the pattern deviation plot. This “reverse cataract” pattern could fool one into thinking there is a depression or scotoma present, when actually it is an indicator of unreliable testing (Figure 6).
The general guideline is that test results with false positives of 10% to 15% or higher are unreliable and should not be used. Users should note that the new SITA-Faster strategy has eliminated testing for false negatives, as they are not helpful in glaucoma and add to the overall test time.
 |
| Click image to enlarge. |
Corneal Biomechanics Confound Assessment
Sometimes we have to make decisions about glaucoma diagnosis and treatment based on reliable test results that all end up in the “borderline” category. Just imagine a mixture of findings, some indicating disease while others support an assessment of no glaucoma at present. Another scenario is a patient who does have glaucoma and additional information directs us how to best treat and manage the patient.
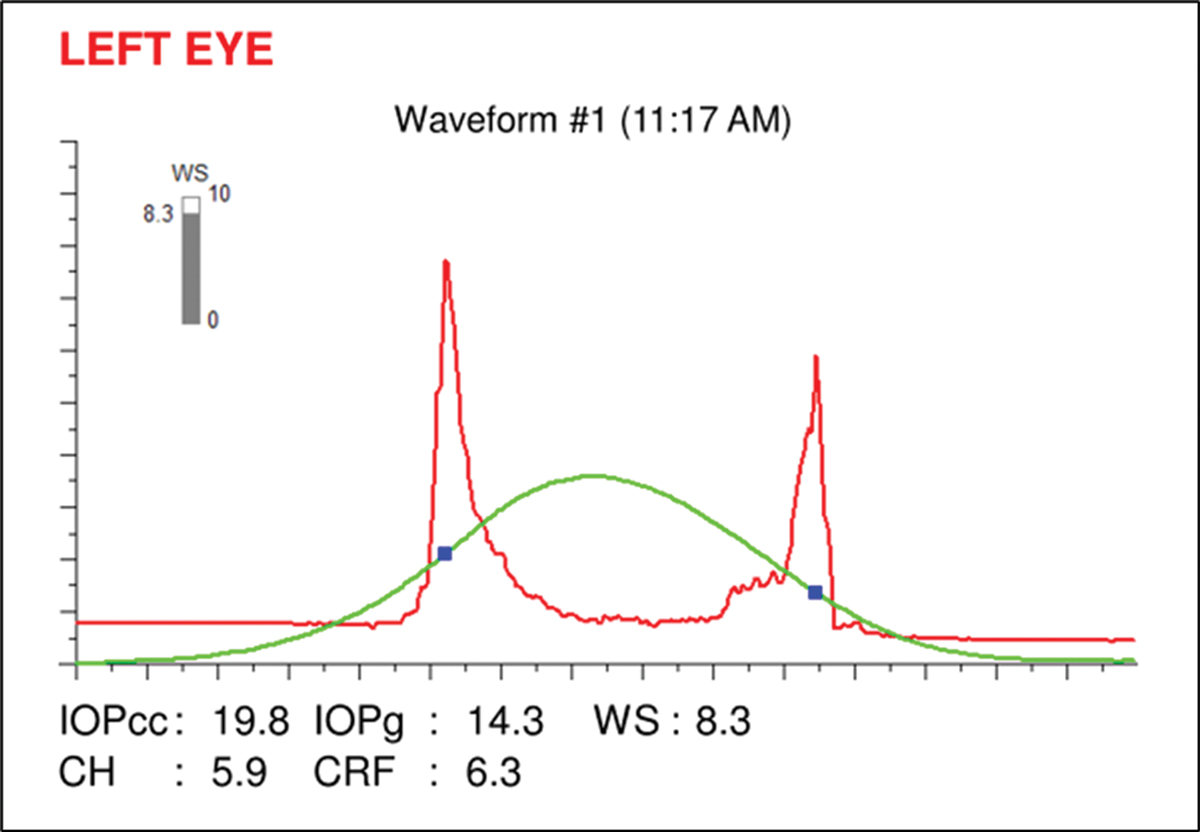
Corneal hysteresis (CH), measured by the Ocular Response Analyzer (Reichert), fills in a helpful missing piece or adds another key risk factor to the confirmation of disease based on other findings.
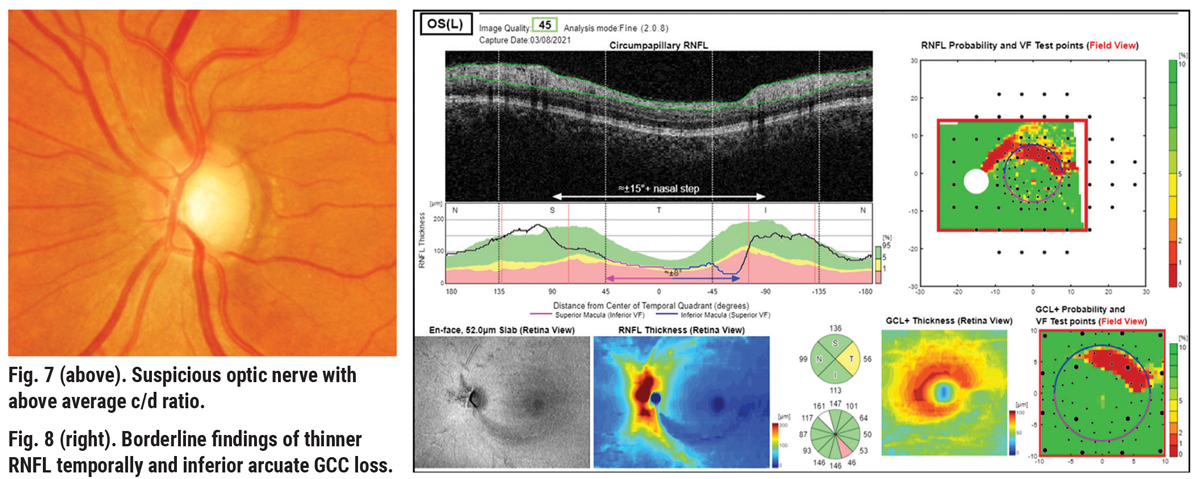
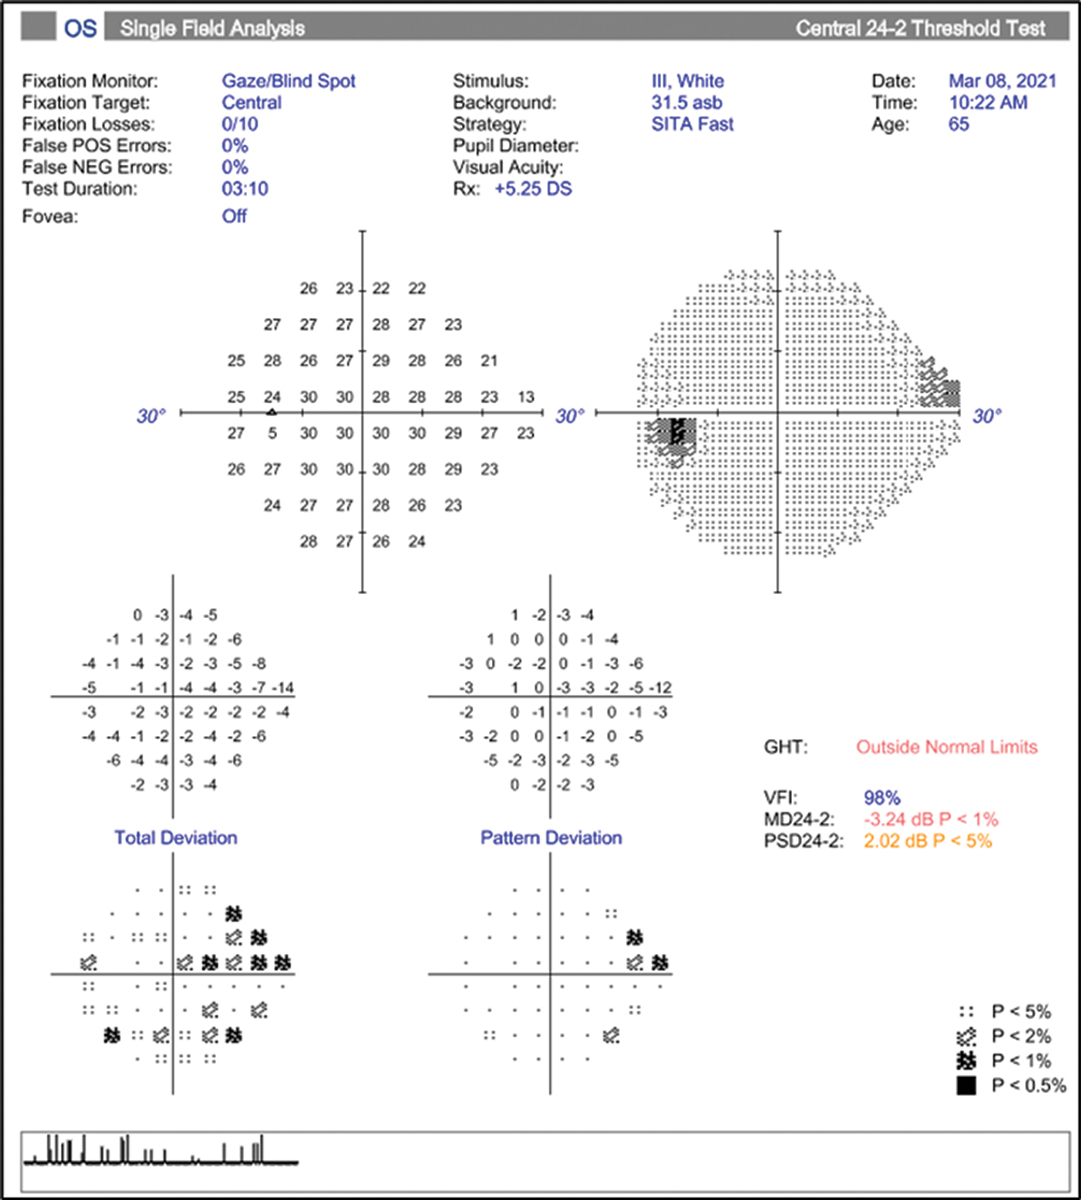
Consider a case of a 65-year-old African-American female with a maximum IOP by Goldmann tonometry of 22mm Hg in the left eye, notching to the inferior temporal rim, significant inferior arcuate defects in the RNFL and GCL+ thickness color maps (Figures 7 and 8). Visual field is reliable, with three adjacent point defects in the superior nasal quadrant, and the glaucoma hemifield test (GHT) is outside normal limits (Figure 9). Here there is good structure-function correlation.
 |
|
Fig. 9. Reliable HVF showing possible early superior nasal step in the left eye.Click image to enlarge. |
The very low corneal hysteresis measure (CH=5.9) is added confirmation to the presence of glaucoma and helps to indicate risk of future progression and thus the target IOP (Figure 10).4 Low corneal hysteresis (<9.0) has been shown to be a reliable risk factor in determining the diagnosis and progression of glaucoma and tends to be low in glaucomatous eyes independent of IOP, central corneal thickness (CCT) and other factors.
In some studies, CH has been shown to be a stronger predictor of progression than low CCT.4 In cases like this one, with the addition of the hysteresis measurement, we would set a lower IOP goal (~40% from baseline) and monitor the patient more closely than others who have a hysteresis measure in the normal range (10.5±1.5).
NTG and Diagnostic Testing Limitations
Patients with “normal” (or “low”) tension glaucoma (NTG) can be particularly difficult to identify properly when traditional diagnostic testing fails us, as often it is all we have to rely on.
 |
|
Fig. 10. Ocular Response Analyzer readout showing a corneal hysteresis measurement of 5.9, which is low. Click image to enlarge. |
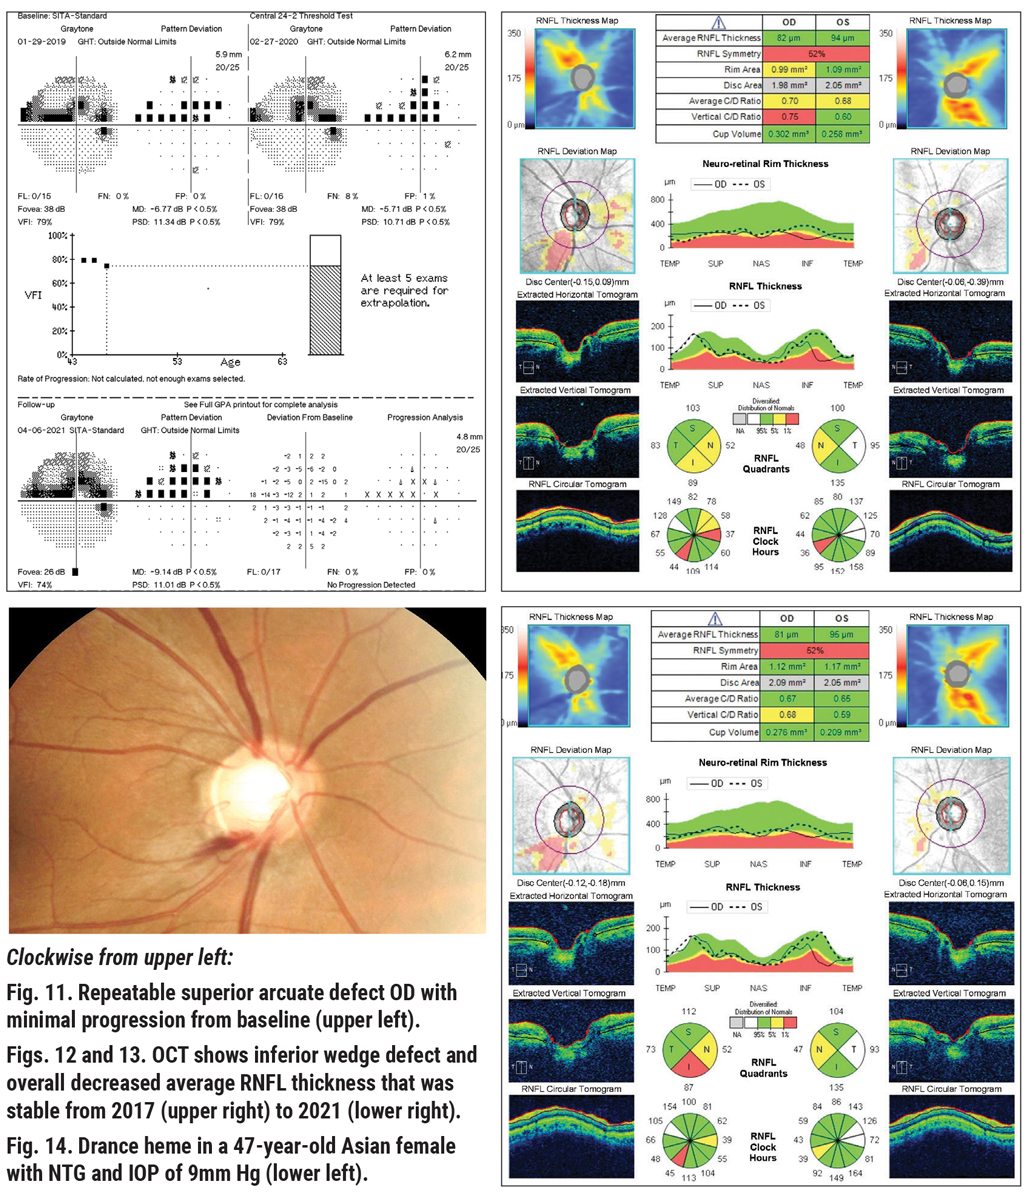
Here is an example of NTG in a 47-year-old Asian female with a history of NTG OD>OS. She had been treated with a topical prostaglandin analog for three years with excellent compliance, with an IOP range between 9mm Hg and 11mm Hg at all visits OU and a pre-treatment IOP in the mid-teens.
Looking at her diagnostic testing, all seems well. Visual field results appear to be essentially stable and reliable, with a dense superior altitudinal defect/paracentral scotoma with pattern standard deviation similar to initial testing (Figure 11). OCT of the RNFL is again very stable when looking at the nerve head compared to baseline (Figures 12 and 13). However, on dilated exam, with IOP of 9mm Hg at her last visit, her right optic nerve demonstrated a Drance hemorrhage at seven o’clock (Figure 14).
We know that although her IOP is excellent in-office and her testing appears very stable, the evidence of the disc hemorrhage tells us she may progress, with the possibility of showing additional RNFL loss in the area of the disc adjacent to the heme and then subsequent corresponding visual field loss in coming months/years.5 Considering this, additional intervention and/or closer observation must be considered.
A look into her medical history tells us that she does tend to have low blood pressure readings, with a diastolic that runs around 60, so ocular perfusion pressure may be an issue.6 Obtaining some form of diurnal IOP may be warranted, to see if there is a time of day where her IOP rises. The iCare Home tonometer (iCare) is one method of obtaining this information.
After discussing with the patient, we elected to add a second topical medication and selected the rho-kinase inhibitor netarsudil for its demonstrated efficacy in patients with intraocular pressures in the normal range.7
 |
| Click image to enlarge. |
OCT and Fields: Anatomical Artifact or Glaucoma?
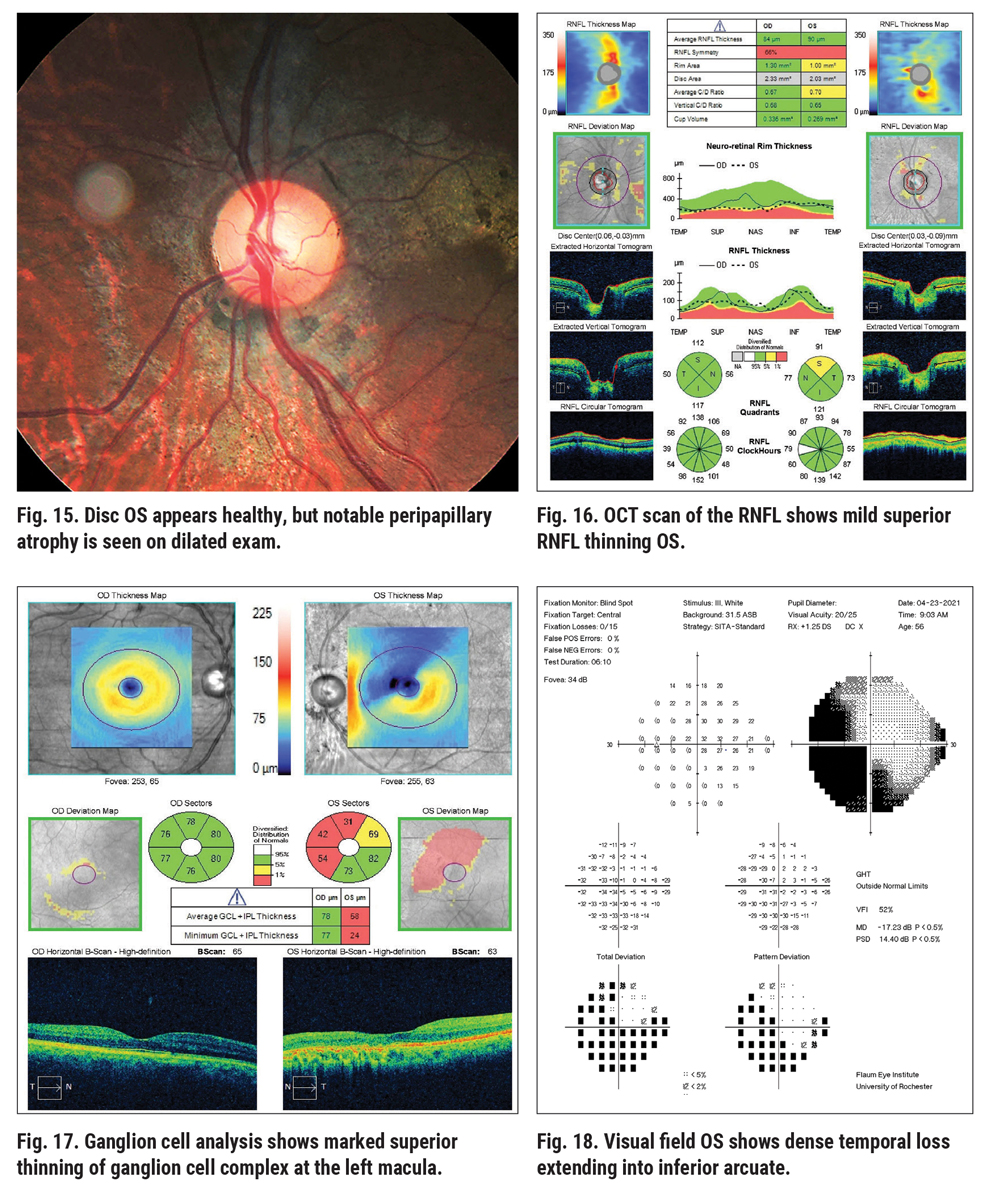
Sometimes, complicating factors such as concurrent retinal or ocular disease will interfere when we rely on testing for the diagnosis and treatment of glaucoma. This next patient, a 56-year-old African American male, presented as an outside referral for “glaucoma suspect vs. ocular hypertension.” He had a history of elevated IOP in the high 20s, with Tmax values of 28mm Hg and 34mm Hg, respectively. He had open angles with no recession, average CCT, positive family history of glaucoma (mother) and diagnostic testing findings that were confounding. The left eye disc photo shows a moderately large cup-disc ratio, while the neuroretinal rim appears intact and healthy (Figure 15).
 |
| Click image to enlarge. |
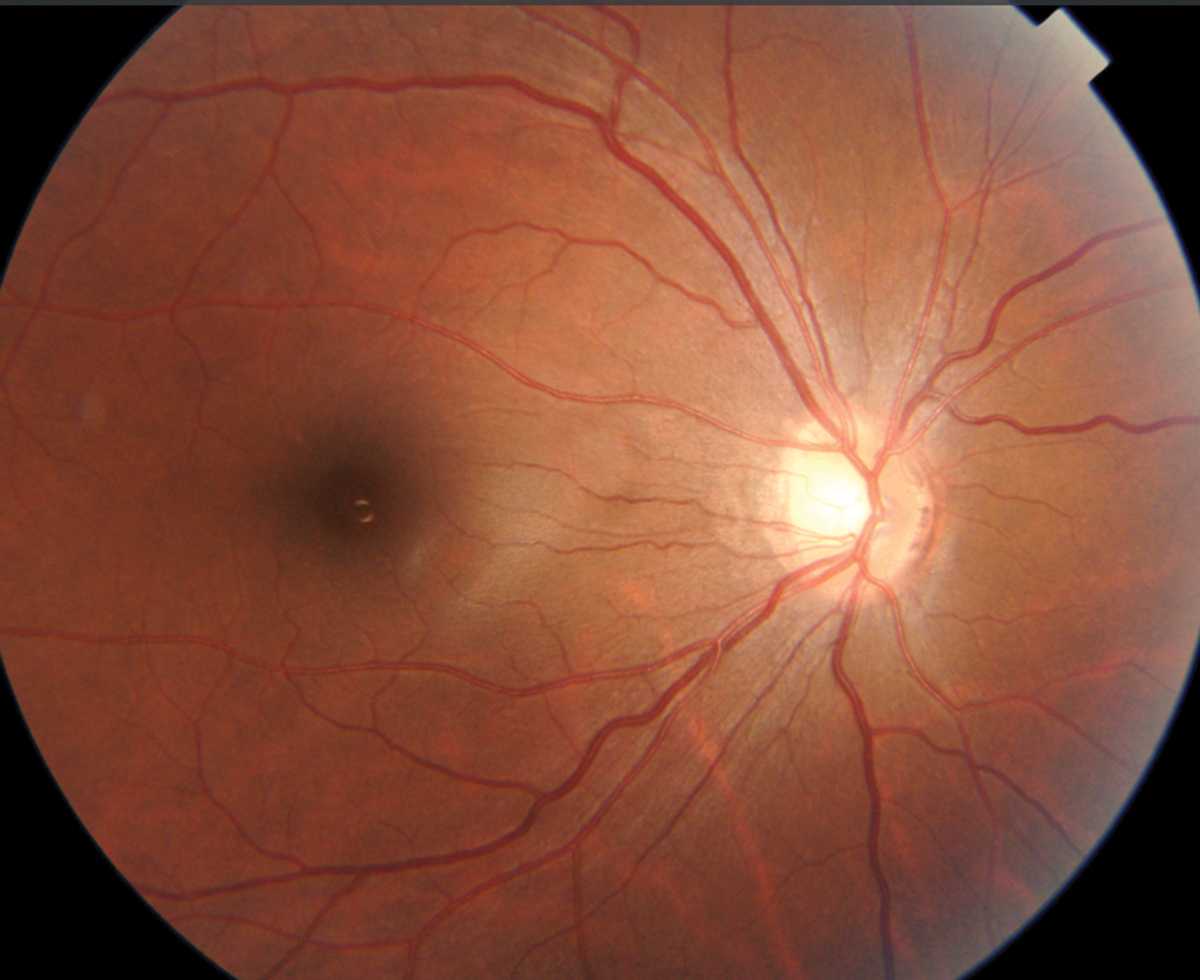 |
Fig. 19. Disc photo of high myope with large, indistinct cup. Click image to enlarge. |
Examining the left eye RNFL thickness map for signs of glaucoma damage, some diffuse superior thinning to the left eye is evident, while the ganglion cell analysis shows a large, deep defect superior nasal to the macula, an odd location for glaucoma damage (Figures 16 and 17). The left eye visual field shows a dense inferior arcuate defect with temporal loss superiorly (Figure 18), also an atypical location for glaucoma. The right eye was normal (not shown).
Initially, this clinical history and information appears highly suspicious for glaucoma, but at closer examination of the left eye disc photo, there is diffuse chorioretinal atrophy involving the disc and macular regions. Further questioning revealed a history of a gunshot wound to the head that penetrated the globe in 2005 (funny how the patient did not report that at first!). Following surgical globe repair and a lensectomy, the patient did astoundingly well, but he was left with the dense field loss in the left eye. Now with elevated IOP, the diagnosis is somewhat complicated and we have to sort out the diagnostic testing data.
 |
|
Fig. 20. RNFL analysis shows “red disease,” non-glaucomatous abnormality to the nasal disc area. Click image to enlarge. |
In this case, the OCT findings and visual fields don’t correlate with glaucomatous loss but rather with the evidence of the chorioretinal atrophy following ocular trauma. Therefore, it is most likely that the patient is only at an ocular hypertensive stage (as can best be determined). Remember, just because there is visual field loss, don’t assume that it’s always from glaucoma. We treated this patient with a prostaglandin analog, lowering the IOP to around 20mm Hg, and will monitor his OCT and visual field closely for any glaucomatous loss.
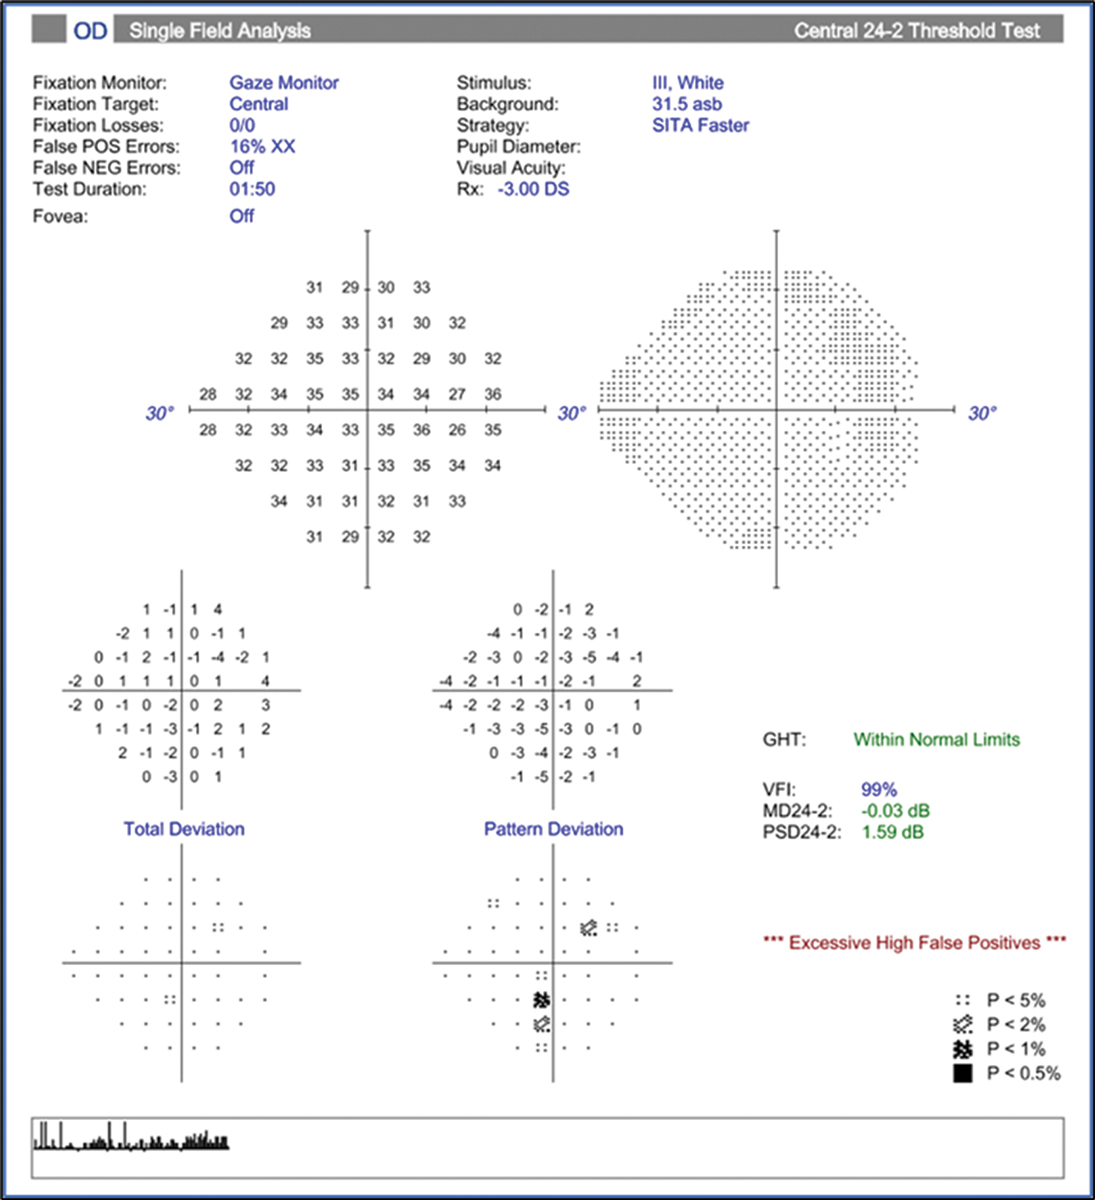 |
Fig. 21. Visual field of the same eye as Fig. 20 is clear and relatively reliable, and the GHT is within normal limits. Click image to enlarge. |
Red and Green Disease
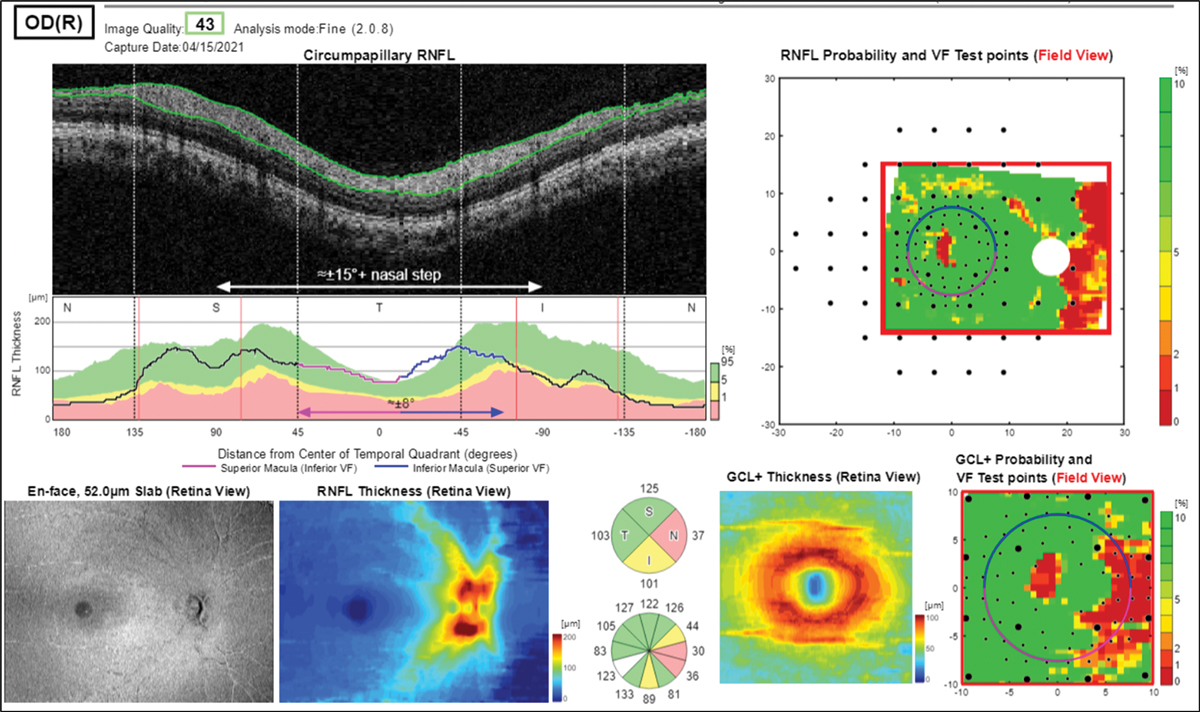
OCT is often a crucial diagnostic tool when differentiating early glaucoma from ocular hypertension in suspects where nerves look somewhat suspicious on exam. In some cases, however, the RNFL and/or the ganglion cell analysis leads us astray. In this example, we have another high myope (-9D) with a family history of glaucoma and Goldmann tonometry readings of 18mm Hg OD and OS (Figure 19). Reviewing the RNFL and GCL+ probability analyses might suggest a glaucoma diagnosis due to the prominent red areas of nasal thinning of both discs (right eye shown in Figure 20).
This intuitively should raise a red flag in the examiner’s mind, as the nasal nerve head appears normal and healthy in the photos and we know glaucomatous damage does not typically start in the nasal aspect of the optic nerve. The visual field provided also doesn’t correlate with these findings; rather, it is clear and relatively reliable OU (although slightly high false positive rate of 16% OD) with the GHT within normal limits (Figure 21).
What happened here? The color coding on the OCT probability maps are off because of the tilted discs and fall outside of the reference database, potentially leading to an erroneous diagnosis of glaucoma. Of note, OCT reference databases can be improved upon, including for higher myopia.8 Unfortunately, the time and cost of FDA-mandated clinical trials make it less likely for companies to perform them.
In a similar way, the presence of so-called “green disease” on an OCT report is another source of misdiagnosis.
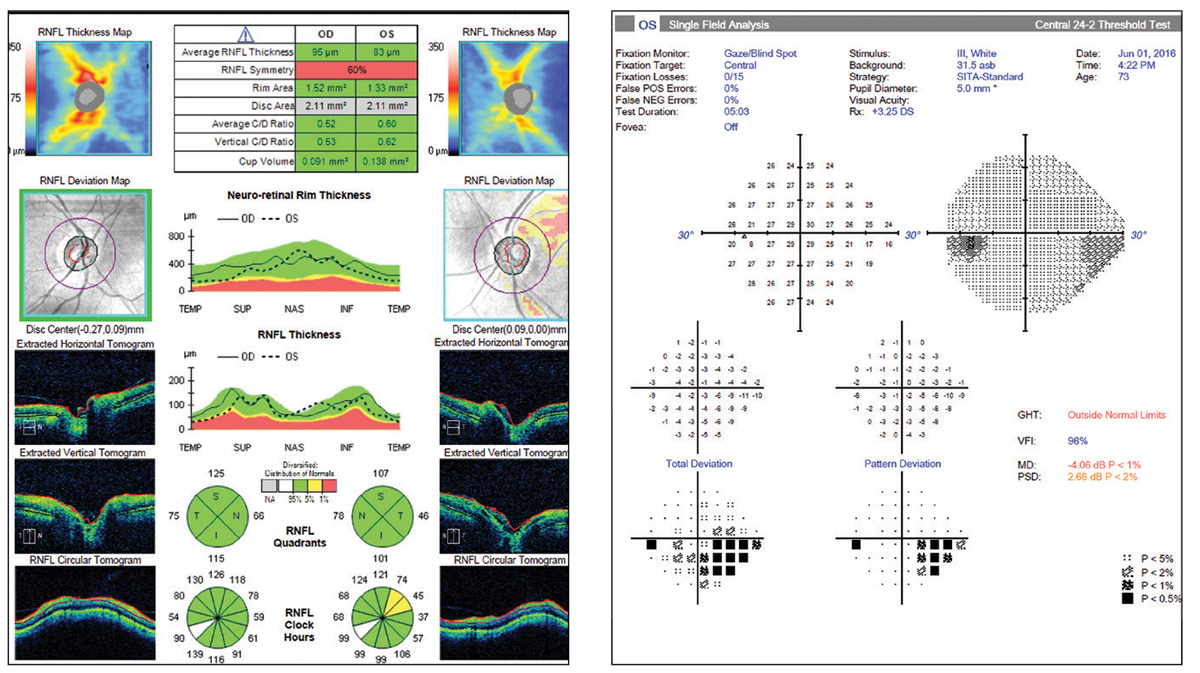 |
Figs. 22 and 23. So-called “green disease.” Average RNFL thickness value is color-coded green and within normal range per the reference database. However, the OCT report shows a superior temporal focal defect and the visual field shows a correlating defect. Click image to enlarge. |
Occasionally, the OCT data obtained on a patient shows no signs of abnormality at quick glace; the average RNFL thickness is “normal” and the four quadrants’ sectors are all in the green zone as well (Figures 22 and 23). However, when more closely inspected, we see that there are focal sectors of RNFL superior temporal thinning in the left eye, which is often seen in early disease. In addition, there is notable asymmetry between the “average RNFL thickness” values, in the left eye much lower at 83µm as compared to the right eye at 96µm.
Statistical averages for diffuse vs. focal loss can “trick” the reference database coding system—be careful. As much as we can be fooled by “red disease” into treating, we can be falsely reassured by an average RNFL value in the green and overlook a clear case of glaucoma.
 |
|
Fig. 24. RNFL OCT demonstrating the “floor effect.” Click image to enlarge. |
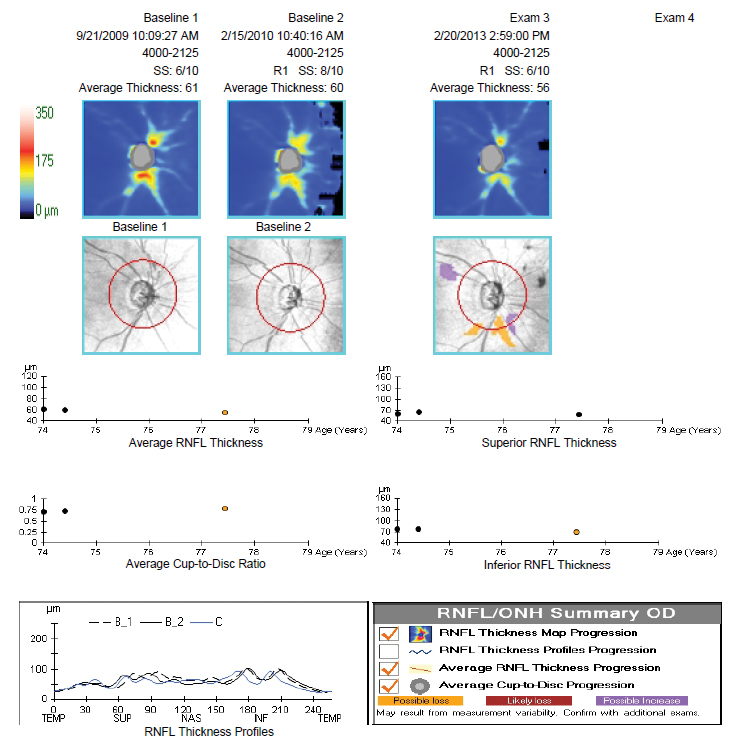
Advanced Glaucoma: The “Floor Effect”
OCT retinal nerve fiber layer imaging technology has had an amazing impact on our ability to diagnose glaucoma at earlier stages of the disease. On the flip side, there comes a time at the moderate-to-advanced stages of disease when the RNFL analysis at the optic nerve head becomes of limited to no value in monitoring a patient for progression.
When significant RNFL loss has occurred, a bottom “floor” is reached where the nerve fiber layer will not show further thinning and OCT progression analysis is unable to detect further loss. This happens around 50µm to 60µm of average thickness. Values don’t go below 50µm (and never to zero) due to the residual retinal glial tissue and blood vessels.9
The important note here is that at this stage of disease the patient’s visual fields can be quite useful in monitoring for progression. The case example shows right eye RNFL loss with approximately 61µm to 56µm of average thickness and minimal change over four years. Future OCT scans would not show much more thinning and thus cannot be used to track disease change. However, the corresponding visual field shows a much earlier relative stage of damage (mean deviation = -2dB) and continues to progress over a seven-year period (mean deviation = -11.2dB) (Figures 24 and 25).
 |
Fig. 25. Visual field progression analysis showing advancing loss. Click image to enlarge. |
The bottom line is to rely more on the OCT/RNFL for progression analysis at the early stages of disease and use the visual fields at the middle and later stages. Note, you’ll need a series of regular (and reliable) field tests to do this, so don’t put them off during the early stages.
A Matter of Perspective
In cases where a glaucoma workup—and the responsibility it entails to “make the call” correctly—may feel intimidating, it is important to keep things in proper perspective. The tools we use today in clinical practice are far more powerful and precise than they have ever been. OCT alone has been nothing short of revolutionary, but while many optometrists practicing today got good training on the devices initially, keeping up with all the new advances is challenging.
There will always be gray areas when the diagnosis isn’t clear-cut, but these are getting smaller and smaller all the time. Your own clinical instincts will always be your best tool, no matter what set of findings are arrayed in front of you at the time.
Dr. Klein is a fellow of the American Academy of Optometry and a diplomate of the American Board of Optometry. She is chief of optometry at the Flaum Eye Institute of the University of Rochester Medical Center in Rochester, NY. She has no financial interests to disclose. Dr. Chaglasian is an associate professor at the Illinois College of Optometry and chief of staff of the Illinois Eye Institute. He is also executive vice president of the Optometric Glaucoma Society. He has been a consultant to and/or received research funding from Aerie Pharmaceuticals, Allergan, Bausch + Lomb, Carl Zeiss Meditec, Topcon and Optos.
1. Cirrus HD-OCT user manual – Models 500, 5000 2014, Carl Zeiss Meditec, Inc. 2. Hood, D and Moraes, C. Four questions for every clinician diagnosing and monitoring glaucoma. J Glaucoma: 2018;27(8): 657-64. 3. Phu J. Clinical evaluation of Swedish interactive thresholding algorithm–faster compared with Swedish interactive thresholding algorithm–standard in normal subjects, glaucoma suspects, and patients with glaucoma. Am J of Ophthalmol: 2019; Dec: 251-64. 4. Medeiros FA, et.al. Corneal hysteresis as a risk factor for glaucoma progression: a prospective longitudinal study. Ophthalmology 2013;120:1533-1540 5. Medeiros FA, et al. The relationship between intraocular pressure reduction and rates of progressive visual field loss in eyes with optic disc hemorrhage. Ophthalmology. 2010 Nov;117(11):2061-6. 6. Leske, MC. Ocular perfusion pressure and glaucoma: clinical trial and epidemiologic findings. Curr Opin Ophthalmol. 2009 Mar; 20(2): 73–78. 7. Khouri AS, et. Al. Rocket-4 Study Group. Once-daily netarsudil versus twice-daily timolol in patients with elevated intraocular pressure: the randomized phase 3 ROCKET-4 study. Am J Ophthalmol. 2019 Aug;204:97-104. 8. Seol BR, Kim DM, Park KH, Jeoung JW. Assessment of optical coherence tomography color probability codes in myopic glaucoma eyes after applying a myopic normative database. Am J Ophthalmol. 2017 Nov;183:147-155. 9. Bowd C, Zangwill LM, Weinreb RN, Medeiros FA, Belghith A. Estimating optical coherence tomography structural measurement floors to improve detection of progression in advanced glaucoma. Am J Ophthalmol. 2017 Mar;175:37-44. |