 |
This will be the first of two columns to explore the concept of using various pieces of information about our glaucoma patients to make educated, targeted and personalized treatment plans. After managing patients with glaucoma for extended periods of time, it’s not unusual for progression to occur despite close surveillance and adequate patient compliance. This can happen for several reasons, including the loss of efficacy of the same medications over time, increased difficulty of stabilizing an optic nerve in an 80-year-old vs. when they initially began treatment 30 years prior, the overall health changes a patient undergoes after many years and the fact that glaucoma tends to simply become more difficult to manage over time.
What are we looking for in determining stability, where do we look for it and what do we do about it? These are the questions we should be asking ourselves each time we see a glaucoma patient in follow-up.
Case
This 83-year-old Caucasian woman has been a patient of mine for many years. She was initially diagnosed with moderately advanced glaucoma when I first saw her years ago; she had the characteristic findings associated with pressure-dependent glaucoma, including elevated intraocular pressure, neuroretinal rim tissue loss and visual field defects. As is normally the case, it may take several months to stabilize the glaucoma and to be certain that the patient is not progressing—this certainty does not occur in a matter of weeks. While we may think a patient is stable after a few initial visits, we really cannot be certain of the stability of the situation until several metrics have been repeated over time which demonstrate no further progression. These metrics are centered around structural and functional stability. Essentially, this would encompass stable OCT readings and stable visual field studies over time.
Not surprisingly, when you are managing a particular patient for more than 30 years, progression can occur. When we suspect progression, especially in a patient who has been stable for an extended period, that will usually be seen as change in the OCT and/or visual field. If everything has in fact been stable, the patient is compliant with medications and scheduled follow-up visits and hasn’t suffered any significant acute systemic medical complications, we wouldn’t expect a dramatic change in disease progression from one visit to the next. Consequently, the earliest signs of progression would be subtle.
Where would we see those subtle changes indicating disease progression? Certainly a visual field defect that was present over time would enlarge should the glaucoma worsen, or other field defects associated with glaucoma would begin to show up. That is fairly straightforward, notwithstanding the increased difficulty elderly patients may have in accurately taking a visual field test.
With our OCT instruments, subtle changes can be seen before visible funduscopic changes would be appreciated in vivo. But where should we look, especially for subtle change, in OCT analyses? As I’ve written about many times in this column, we really need to look at several areas of the posterior pole for evidence of glaucomatous progression—namely the circumpapillary retinal nerve fiber layer (RNFL), the macula and the neuroretinal rim itself. With even more advanced glaucoma analysis software, such as the GMPE software available on the Heidelberg Spectralis, we can specifically look at not just one, but three different diameter circumpapillary RNFL scans, the ganglion cell layer in the macula (as opposed to total macular thickness) and insofar as the neuroretinal rim is concerned, the minimum rim width as measured from Bruch’s membrane opening to the internal limiting membrane, which is called the Bruch’s membrane opening-minimum rim width (BMO-MRW).
 |
|
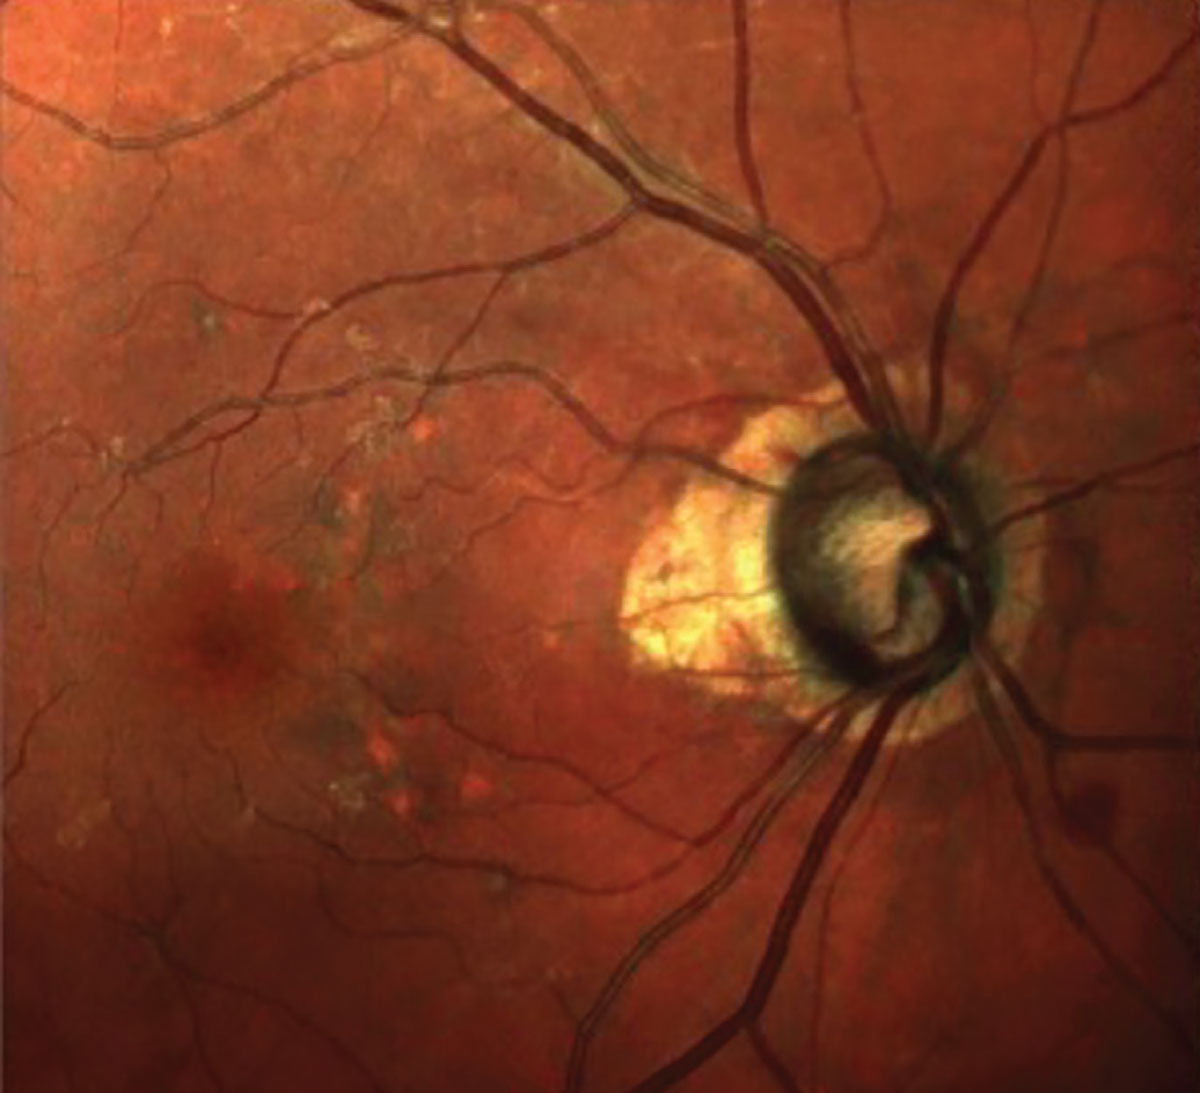
Fig. 1. Seen here is advanced glaucomatous optic neuropathy, peripapillary atrophy, retinal pigment epithelium changes in the macula and a diffuse epiretinal membrane. Click image to enlarge. |
Think about it for a minute: If we are looking at all these areas of the posterior pole each time we evaluate our glaucoma patients for structural stability—especially if we are looking for subtle evidence of change—would we expect all of these areas to show signs of progression? Or would we expect, rather, subtle change to be seen in some areas and not in others? Gross change and significant progression would naturally show up eventually in all those areas where ganglionic cells are lost—but subtle change? It intuitively makes sense that subtle change may appear in some areas but not others.
 |
|
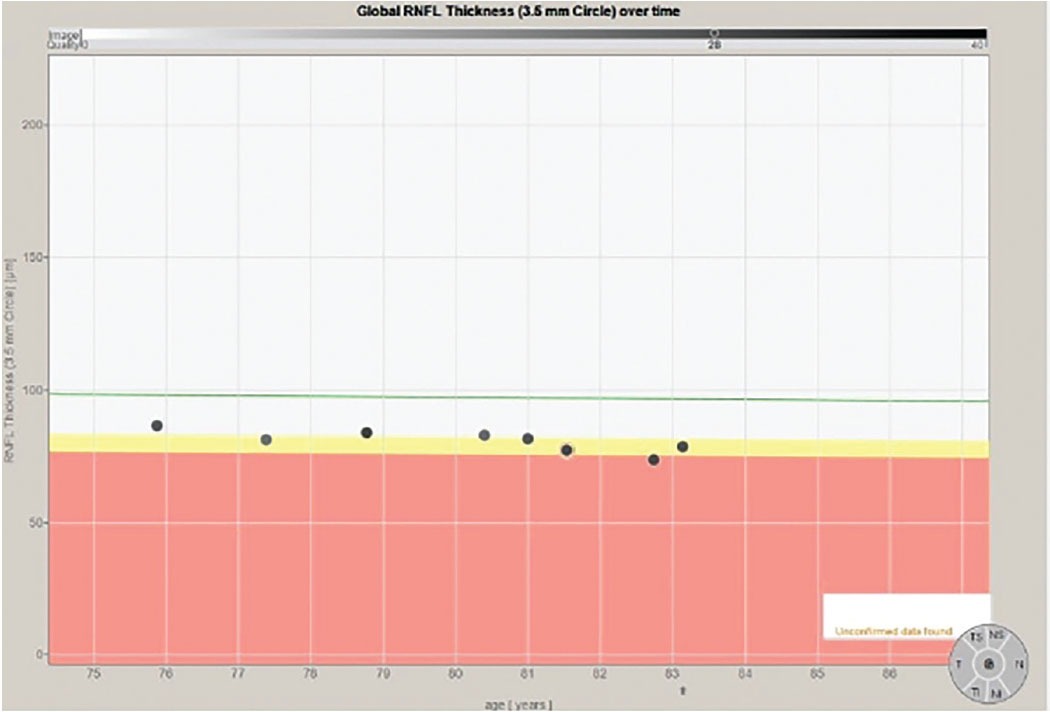
Fig. 2. The progression analysis of the 3.5mm RNFL circle scan of the right eye. Note that the eight individual data points have a slope similar to the decline one would expect due to aging changes, as shown on the green reference line. Click image to enlarge. |
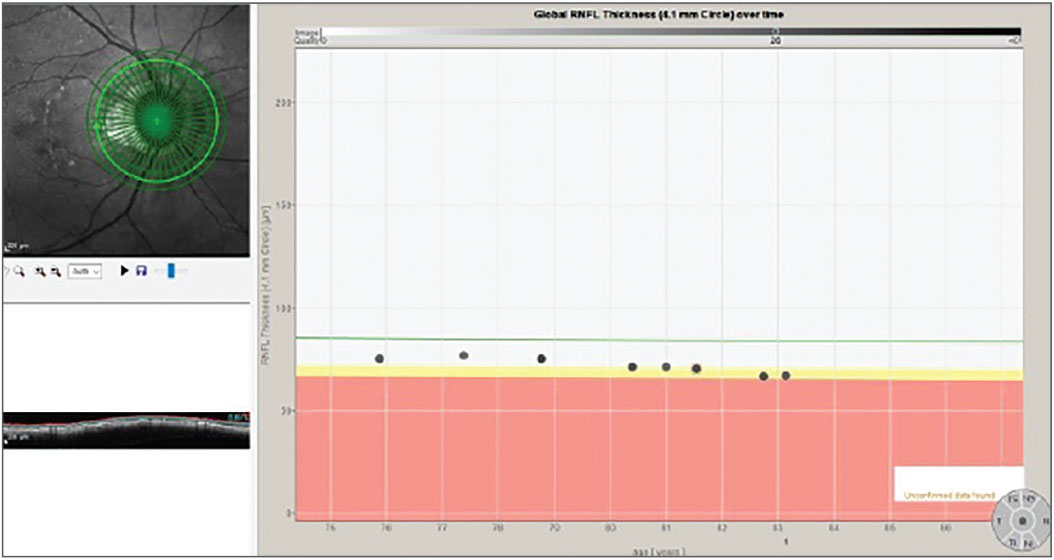
In fact, that is exactly what happens. The challenge is that precisely where those subtle changes first appear can vary from patient to patient, which is what happened in this patient. In Figure 1, we see a multimodal image of the patient’s right posterior pole. Clearly visible is a thin neuroretinal rim with characteristic glaucomatous cupping, an RNFL hemorrhage at 10 o’clock on the disc and associated age-related macular changes. Figure 2 shows the progression analysis specifically of the 3.5mm RNFL circle scan. Note that there is essentially no statistical change in this area of the RNFL over a nine-year period other than expected age-related thinning. Figures 3 and 4 show essentially the same thing—no significant deterioration of the RNFL, specifically in areas further away from the optic nerve, namely at the 4.1mm and 4.7mm diameter scan locations.
 |
|
Fig. 3. The progression analysis associated with the 4.1mm diameter RNFL circle scan. Click image to enlarge. |
 |
|
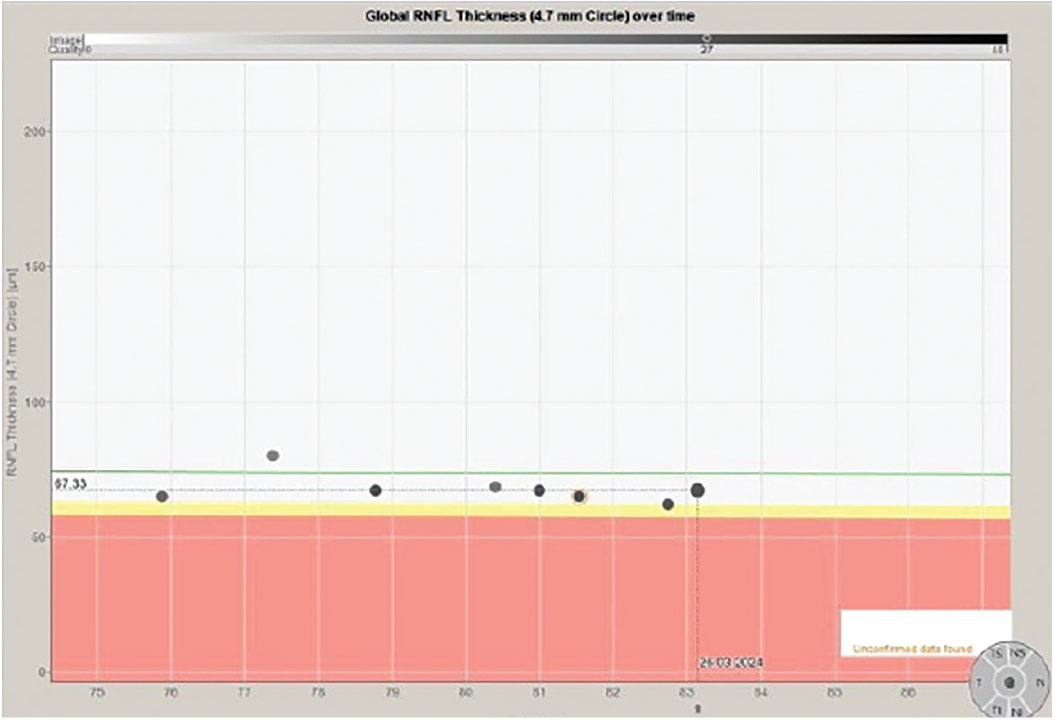
Fig. 4. Stability of the 4.7mm RNFL scan over an 8.5-year period. Click image to enlarge. |
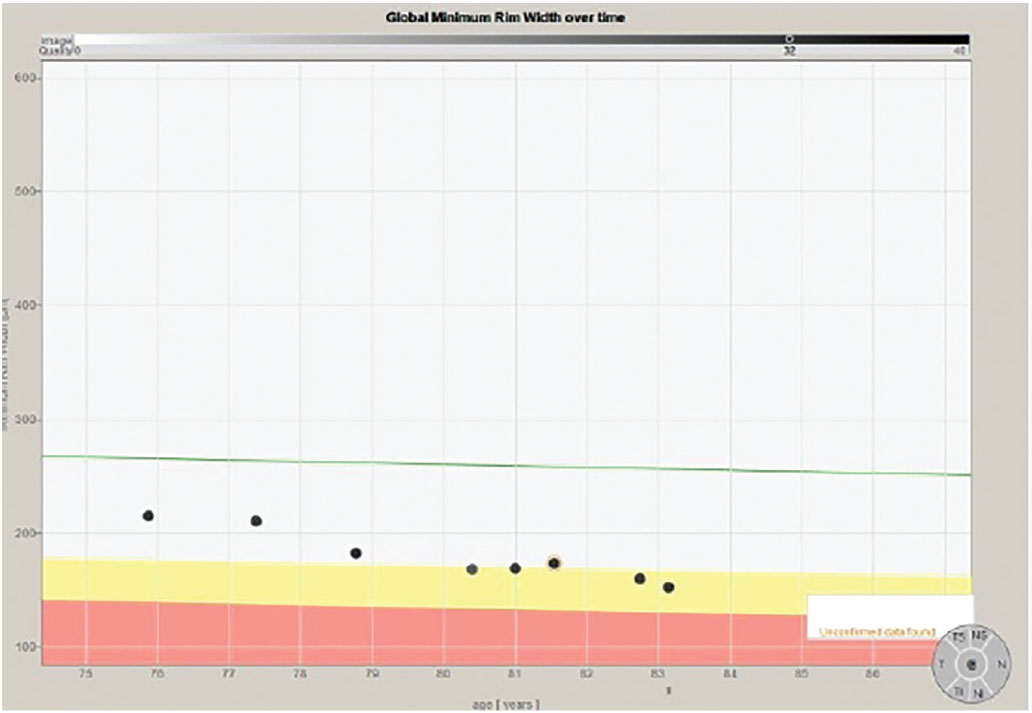
Note that in all the progression analyses of the three different diameter RNFL circle scans that there is no significant evidence of progression of the glaucoma. In Figure 5, however, we can clearly see deterioration in the neuroretinal rim BMO-MRW scan. In fact, on close examination, we see two instances where there is progression.
 |
|
Fig. 5. The progression analysis of the BMO-MRW measurements of the same patient. Note specifically a change (thinning) of the neuroretinal rim metrics after the second scan and again after the sixth scan. Click image to enlarge. |
Had I not been looking at the BMO-MRW scans of this patient longitudinally and instead relied solely on the RNFL circle scans, I would have missed the two instances of subtle progression. Both times when there was progression of the disease, it was identified on the BMO-MRW scan but none of the three RNFL circle scans.
The point is that in this particular patient, subtle disease showed up in some areas (the neuroretinal rim) and not others (the RNFL). Each time that disease progression was noted, follow-up scans using the same strategy confirmed the change, therapy was subsequently adjusted and the patient was again stabilized. This is seen in Figure 5 in the first two scans as compared with scans three and four, and again in scan four, five and six as compared with scans seven and eight.
How we decide to modify therapy in the presence of disease progression is an individual clinical decision. New or different medications? Laser therapy? Surgical intervention? You must make that call depending on the specifics of the case. But if you are seeing progression without changing the treatment plan, that progression will continue to march on until all the metrics ultimately show change, at which time deterioration of the ganglion cells will no longer be subtle.
Conclusion
This 83-year-old patient still functions well in her day-to-day activities, is not encumbered visually by her advanced glaucoma and is enjoying life, albeit at a slower pace than when we first met. Isn’t that how we want these stories to go? Subtle disease is something you need to look for carefully and exhaustively, and at each follow-up visit with your glaucoma patients in particular.
Dr. Fanelli is in private practice in North Carolina and is the founder and director of the Cape Fear Eye Institute in Wilmington, NC. He is chairman of the EyeSki Optometric Conference and the CE in Italy/Europe Conference. He is an adjunct faculty member of PCO, Western U and UAB School of Optometry. He is on advisory boards for Heidelberg Engineering and Glaukos.