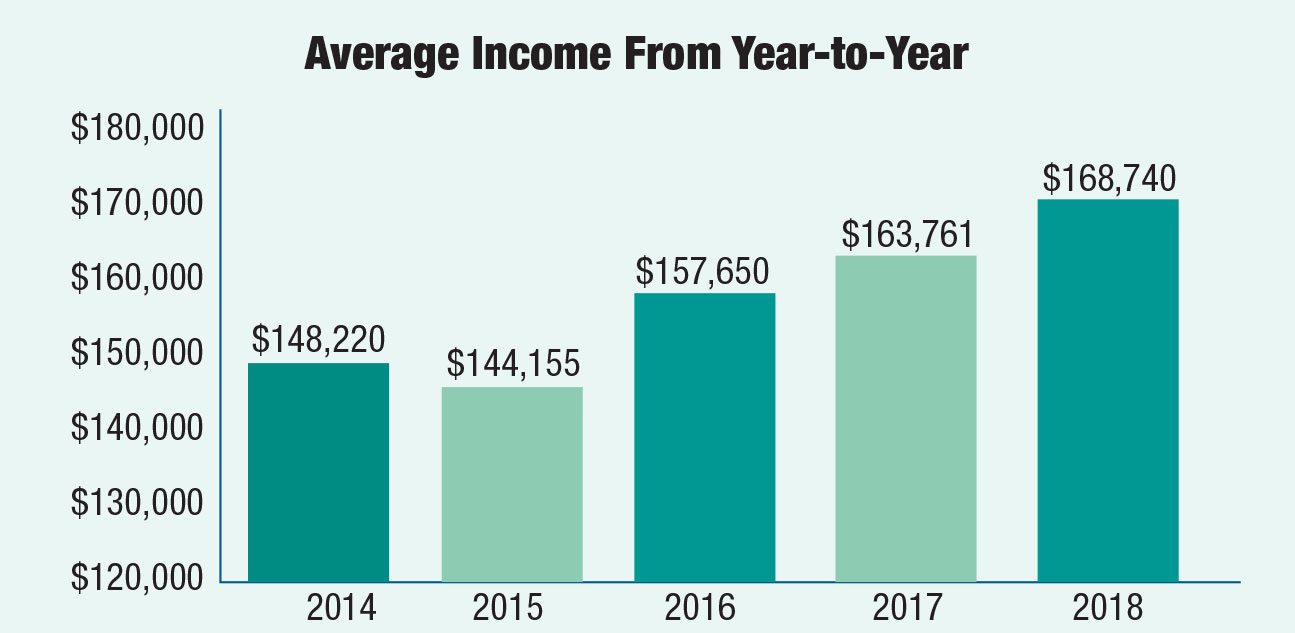
As the year winds down and a new one quickly approaches, let’s go back and see what 2018 held for optometry financially. In this year’s annual income survey, OD participation increased to more than 750 respondents—maybe it was to share the good news that their income was continuing to follow an upward trend? And it was: average income in 2018 was $168,740, a 3% increase from 2017. While that’s not as big of a jump as the 4% increase from 2016 to 2017, the declining rate at which income is rising could be leveling off—income increased by 9% from 2015 to 2016.
Specifically, full-time workers made an average of $175,152 in 2018—a 5% increase from last year—and part-timers made $114,146 on average, a 6% drop from 2017. The same percentages of full-time and part-time workers as last year filled out the survey—91% and 9%, respectively.
As always, be mindful that we’re comparing different datasets (our 2017 and 2018 surveys included different individuals each year), and that makes trend analysis tricky, especially among the smaller cohorts where sample sizes get lower and results more varied.
 |
Time is Money
As a society, it’s a general rule of thumb that experience determines pay—the more years you have under your belt, the more money you have in your wallet. This also holds true for optometry, to an extent.
Entry-level respondents—those with zero to 10 years of experience—made up 31% of the respondents and earned an average of $131,236, a slight increase from the average full-time income beginners made in 2017.
The average income leap from the zero-to-10 years of experience bracket to the next one, 10 to 20 years—25% of respondents had this intermediate level of experience—was a sizable 26% for $165,259. This level, however, represents a 7.5% drop from the average income full-time workers at this experience level made in 2017.
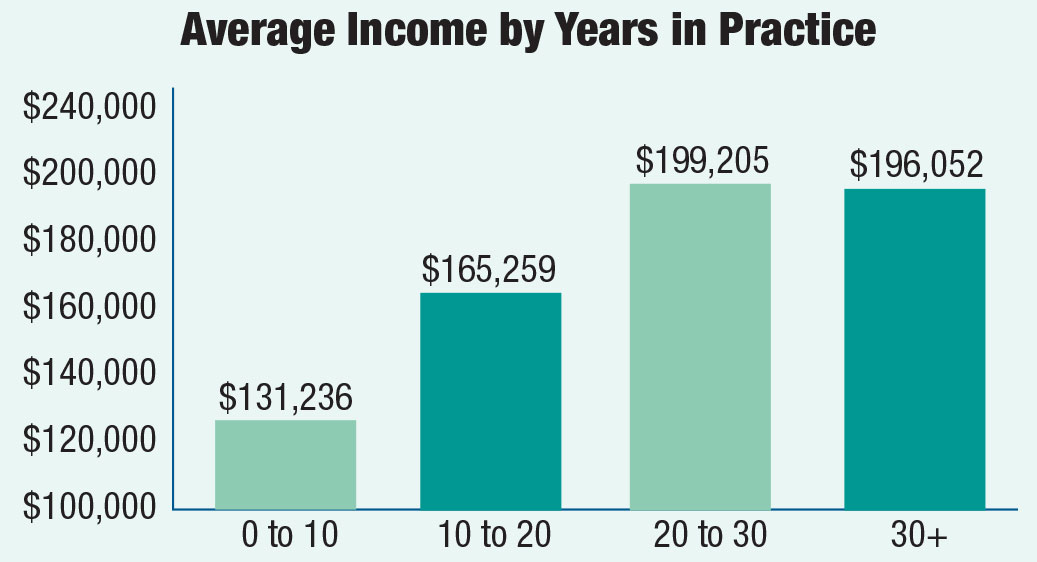 |
While last year’s respondents reported experiencing a mid-career plateau, this year’s results indicated quite the opposite occurred. Those with 20 to 30 years of experience made up 26% of the respondents and earned an average of $199,205, a 21% jump from the average income their counterparts with 10 to 20 years of experience earned and a 12% increase from the average full-time income workers with 20 to 30 years made in 2017.
This is where it gets confusing. The more experienced you are, the more money you make, right? While this was the trend last year’s survey results followed, this year’s results for respondents with the most experience run counter to that notion. Those who have been practicing for more than 30 years only earned $196,052 on average. That’s a 2% drop for 10 more years of experience and a 12% decrease from the average full-time income veterans made in 2017. Perhaps the relatively small number of respondents in this group (18%) skewed the results, or some at the top end of the experience curve are starting to reduce their time spent on the job and that easing off was reflected in the numbers.
It Pays to be Your Own Boss
Working for yourself has always seemed desirable. For the respondents of our survey, it’s also profitable. While the majority of respondents (53%) are employed, those who are self-employed brought home the bigger bucks, earning an average of $215,466, a 67% increase from the $129,022 those who are employed make on average. The 67% difference between the two means the gap is widening yet again—it seemed to have begun closing last year when it dropped from 58% in 2016 to 35% in 2017. Further distancing both groups, employees made 3% less than their full-time counterparts did in 2017 while self-employed workers made 20% more.
 |
Of those who are employed, 52% work for an OD or MD, 20% for a commercial firm, 9% for a hospital/VA, 6% for an HMO or a PPO and 4% for a university. Nine percent of the respondents chose the “other” option and reported taking the private chain, private equity or corporate route to name a few.
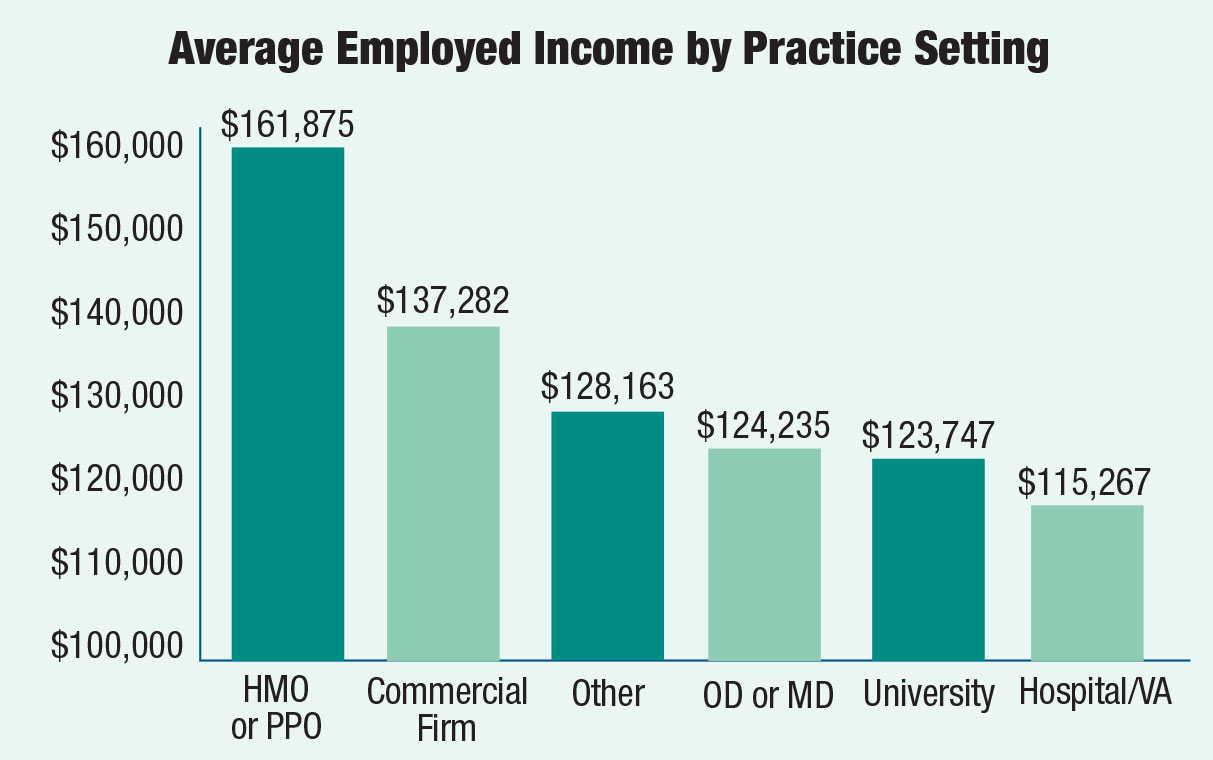
Working for a hospital/VA was the least profitable for optometric employees, who made an average of $115,267. This represents a 22% drop from the average full-time income hospital/VA employees earned in our 2017 survey, when being employed by a hospital/VA was the second most profitable option. Of course, heed our earlier admonition about comparing different datasets—last year’s respondents didn’t necessarily get a nasty pay cut.
Similar to 2017, working for a university ($123,747) or an OD or MD ($124,235) were lower-paying gigs. Those who chose the “other” option made an average of $128,163, and those who work for a commercial firm earned $137,282 on average.
At the top of the chain, employees of an HMO or a PPO made an average of $161,875, a 13% jump from the average income their full-time counterparts earned in 2017, when working for an HMO or a PPO was also the most profitable option.
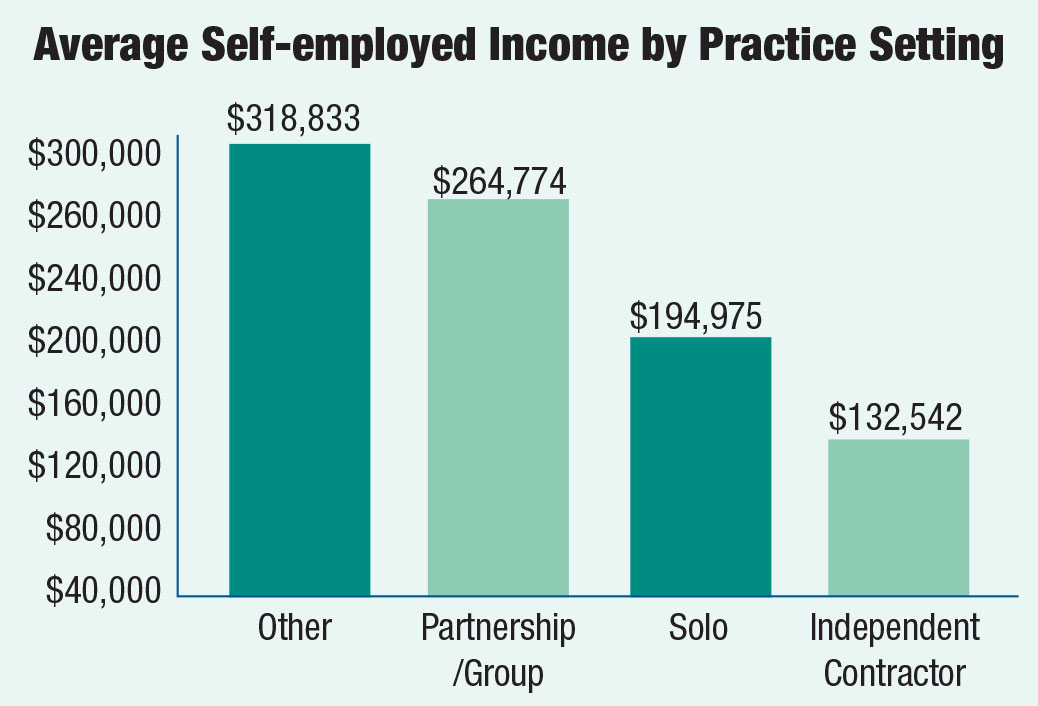 |
Switching gears, of those who are self-employed, 47% practice on their own, 36% are members of partnerships or groups and 14% are independent contractors. Three percent of the respondents chose the “other” option. Similarly to 2017, working as an independent contractor was the least profitable and only paid an average of $132,542. Those who worked on their own made $194,975 on average, and those who worked in partnerships or groups made an average of $264,774. While those who chose the “other” option fell into the second least profitable category in 2017, this group earned an average of $318,833 in 2018, a 112% increase from last year, making this the most profitable route to pursue. Many of those who fell into this category own their practices and have associates working for and with them.
 |
Southern Comfort
While packing up and starting fresh somewhere entirely new isn’t exactly ideal, it could do wonders for your income and mean the difference between earning less in one place and 23% more in another.
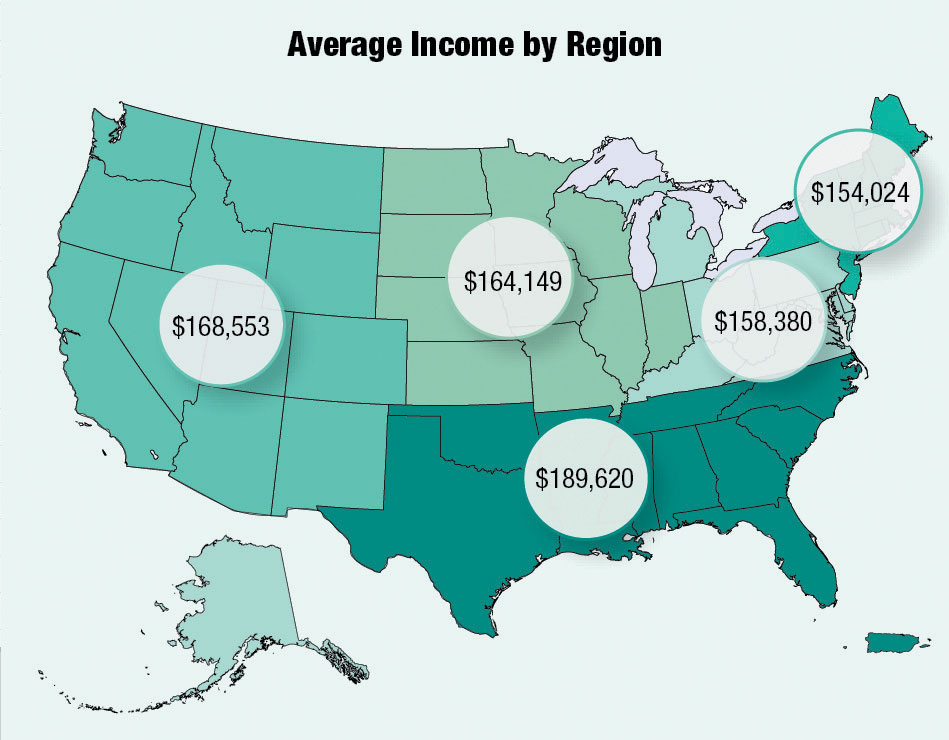
Just as it was last year, the South is the most profitable place to practice, with workers earning an average income of $189,620, 5% more than the average full-time income respondents from the South claimed in 2017.
Earning 12% less than their southern counterparts, those in the West make the next highest income—just as they did last year—at $168,553 on average, slightly less than 2017.
On the other end of the spectrum, practitioners in the Northeast were the least profitable, only making an average of $154,024. This represents a 4% drop from the average income those living in this region earned in 2017—when the region was the third most profitable—and bumps the Mid-Atlantic/Lower Great Lake region ($158,380) and the Midwest ($164,149) up to the fourth and third most profitable areas of the country, respectively.
 |
Inching Toward Income Equality
The gender gap has been an issue across the board for an extremely long time now, and, unfortunately, it doesn’t seem to be in a rush to go anywhere fast for optometry. Even though the 3% shrinkage in disparity between men and women from 40% in 2017 to 37% in 2018 doesn’t compare to the 31% drop from 68% in 2015 to 37% in 2016, it still represents a step in the right direction—the gap widened by 3% last year.
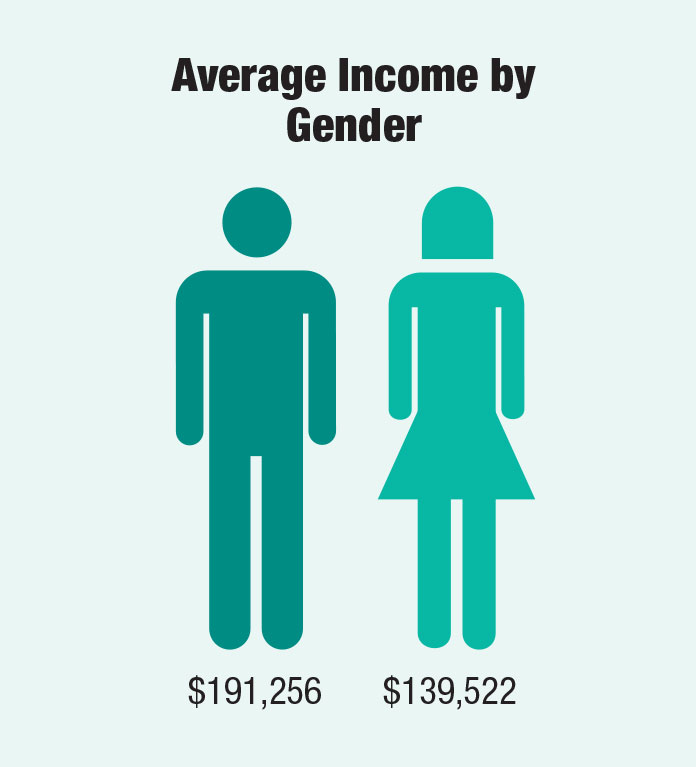
This year, men out-earned women on average $191,256 to $139,522, and men made up the majority of the respondents at 59%. The average incomes for males and females increased from last year, with females’ increasing at a faster rate.
At an average income of $190,208, men with more than 30 years of experience earned 42% more than women at the same experience level, who sat at $134,400 on average. This represents a sizable step backwards from the 10% gap for full-time workers of both genders who had the most experience in 2017 and is the largest income disparity between men and women at each experience level this year.
The next highest income gap was between male and female novices—those with less than 10 years of experience. Men earned an average of $176,262, 41% more than women who had the same level of experience but only made $124,827 on average. Again, this widening gap—it was a mere 11% for full-timers who were just starting out in 2017—represents a step in the opposite direction of where the field should be heading.
The gap between men and women with 10 to 20 years under their belts was similar, at 40%, with men earning an average of $204,344 and women, $146,066.
The smallest gap belonged to the group approaching the highest level of experience—20 to 30 years—at 12%, with men earning $180,373 on average and women, $161,369.
 |
Optometric Optimism
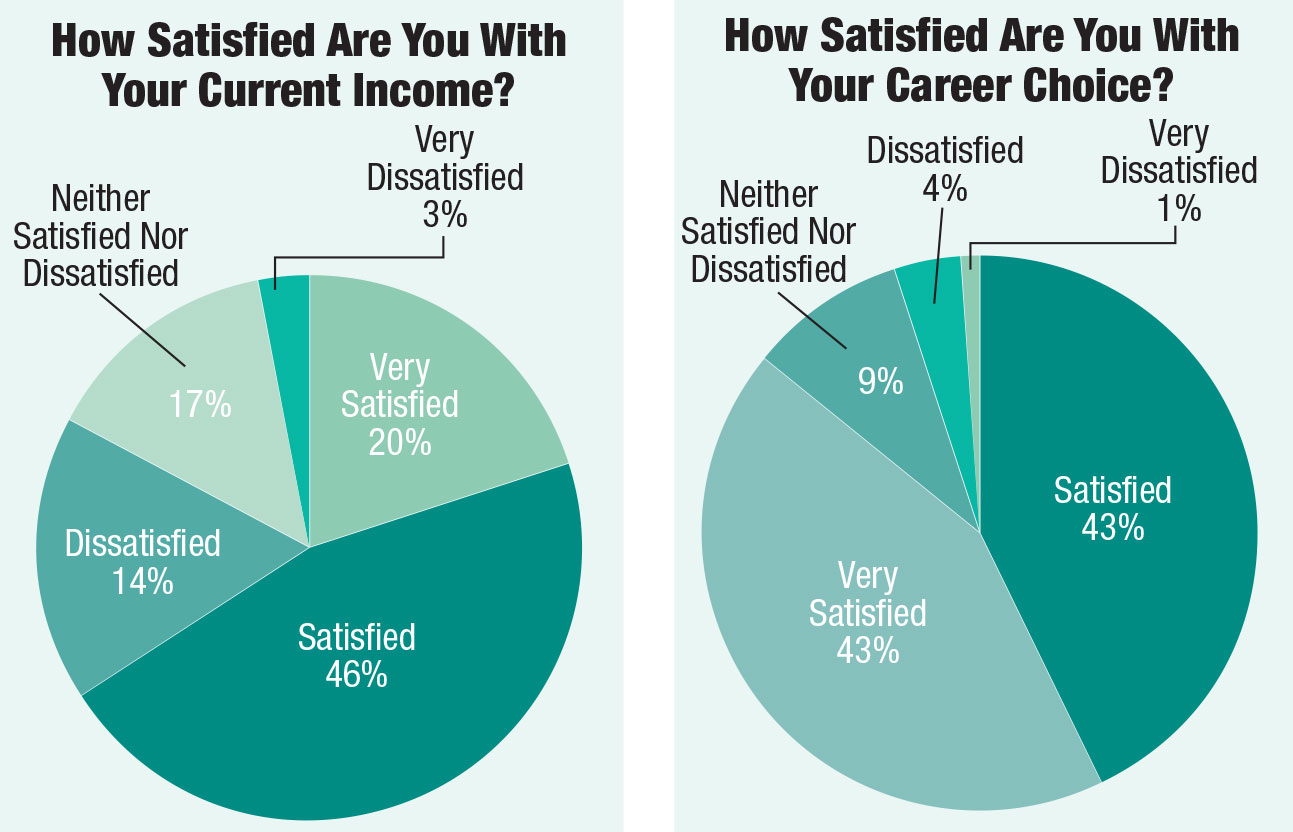
Despite the mixed results we saw from the survey, the majority of respondents seemed to remain pretty positive about their income and career choice. Just over 65% reported feeling satisfied or very satisfied with their income. Respondents generally agreed that the amount of money they make allows them to save for the future, spend on other things, live comfortably and engage in the lifestyle of their choice. Many believe they are adequately compensated for their time and work, with one respondent saying they are making “more than I ever dreamed of.” Others, however, do not think they are making as much as they should be at their level of experience and are worried about paying off student loans and saving for future plans and retirement. “I have plenty to meet my needs and am happy with my income, but my debt load for student loans and practice purchases leaves something to be desired for saving for retirement and other goals,” a respondent says.
More than 85% of respondents indicated they were satisfied or very satisfied with their career choice. Many reported that working in optometry was their dream job because they love helping patients in a dynamic field. Others said they enjoy being their own boss, naming the amount of control they have and the balance they are able to strike between their personal and professional lives as two perks. “I absolutely love and enjoy practicing optometry. I receive the benefit of helping people using my God-given skills and sound financial compensation. I truly believe that optometry is the best profession!” says one respondent.
 |
Still, many took issue with the hurdles insurers present, the emphasis on quantity over quality and the threats online retailers pose. “I love my profession but not the way I have to practice it,” one respondent says. Along the same lines, another remarks, “Insurance has started dictating the way I practice.”
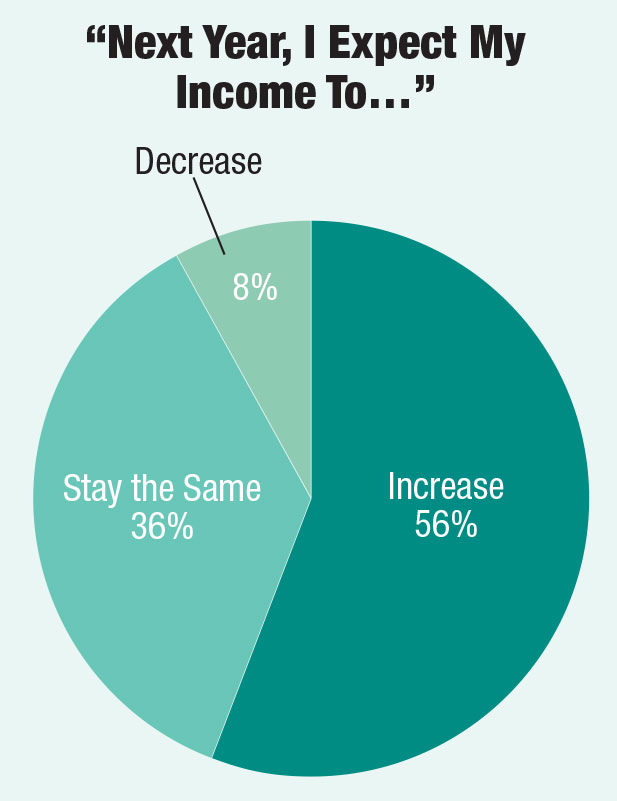
While some expressed dissatisfaction, the percentages fell as the rankings did for both income and career choice—good signs all around—and many remained optimistic about the year to come. Of this year’s respondents, 56% expect their income to increase, 36% don’t expect a change and only 8% expect a decrease.
Bring on 2019
As any other year, some individuals did better than their peers in 2018. But as a whole, we saw average income increase, the mid-career plateau disappear and the gender gap narrow, among other positives. We also saw earnings decrease among those with the most experience and the gap widen between self-employed and employed ODs. The bottom line, however: optometry continues to move forward, even if it does so at a slower pace and meets some roadblocks along the way.