OCT can add value to any optometric practice; it can provide you with an extra boost of confidence in your diagnosis and decrease your referral rates. Even if you are already using OCT in your practice, you might not be maximizing its utility. These novel clinical applications of both anterior and posterior segment OCT will help you get the most out of your investment.
 |
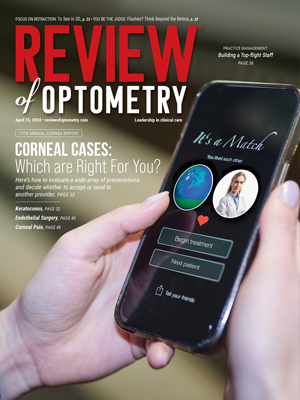
| Fig. 1. Optic nerve OCT shows objective excyclotorsion OD (leftward shifting of the right eye TISNT graph in relation to the left) in a patient complaining of intermittent vertical diplopia with a low magnitude right hyperphoria. No subjective torsion was noted via double Maddox rod testing, suggestive of a congenital superior oblique palsy. Click image to enlarge. |
1. Detect Objective Ocular Torsion
For patients complaining of vertical diplopia, OCT may aid in detecting and quantifying objective ocular torsion. In cases of ocular torsion, optic nerve OCT imaging shows a separation, or shifting, of the nerve fiber layer “TISNT” graphs of the two eyes, assuming that your OCT model does not automatically correct for torsion effects (Figure 1).
When a vertical tropia or phoria is present, excyclotorsion of the hyper eye is suggestive of superior oblique palsy, unlike skew deviation, which would be expected to exhibit incyclotorsion. Clinicians should compare the amount of excyclotorsion noted with subjective measures (double Maddox rod testing) and objective measures to aid in the differentiation between decompensated congenital superior oblique palsy and truly acquired cranial nerve IV palsy. If the amount of subjective excyclotorsion is far less than the amount of objective excyclotorsion, a decompensated congenital palsy is likely. However, if the amount of subject torsion equates the degree of objective excyclotorsion, an acquired palsy in need of additional investigation in the absence of trauma in likely the cause.
2. Image the Lamina Cribrosa
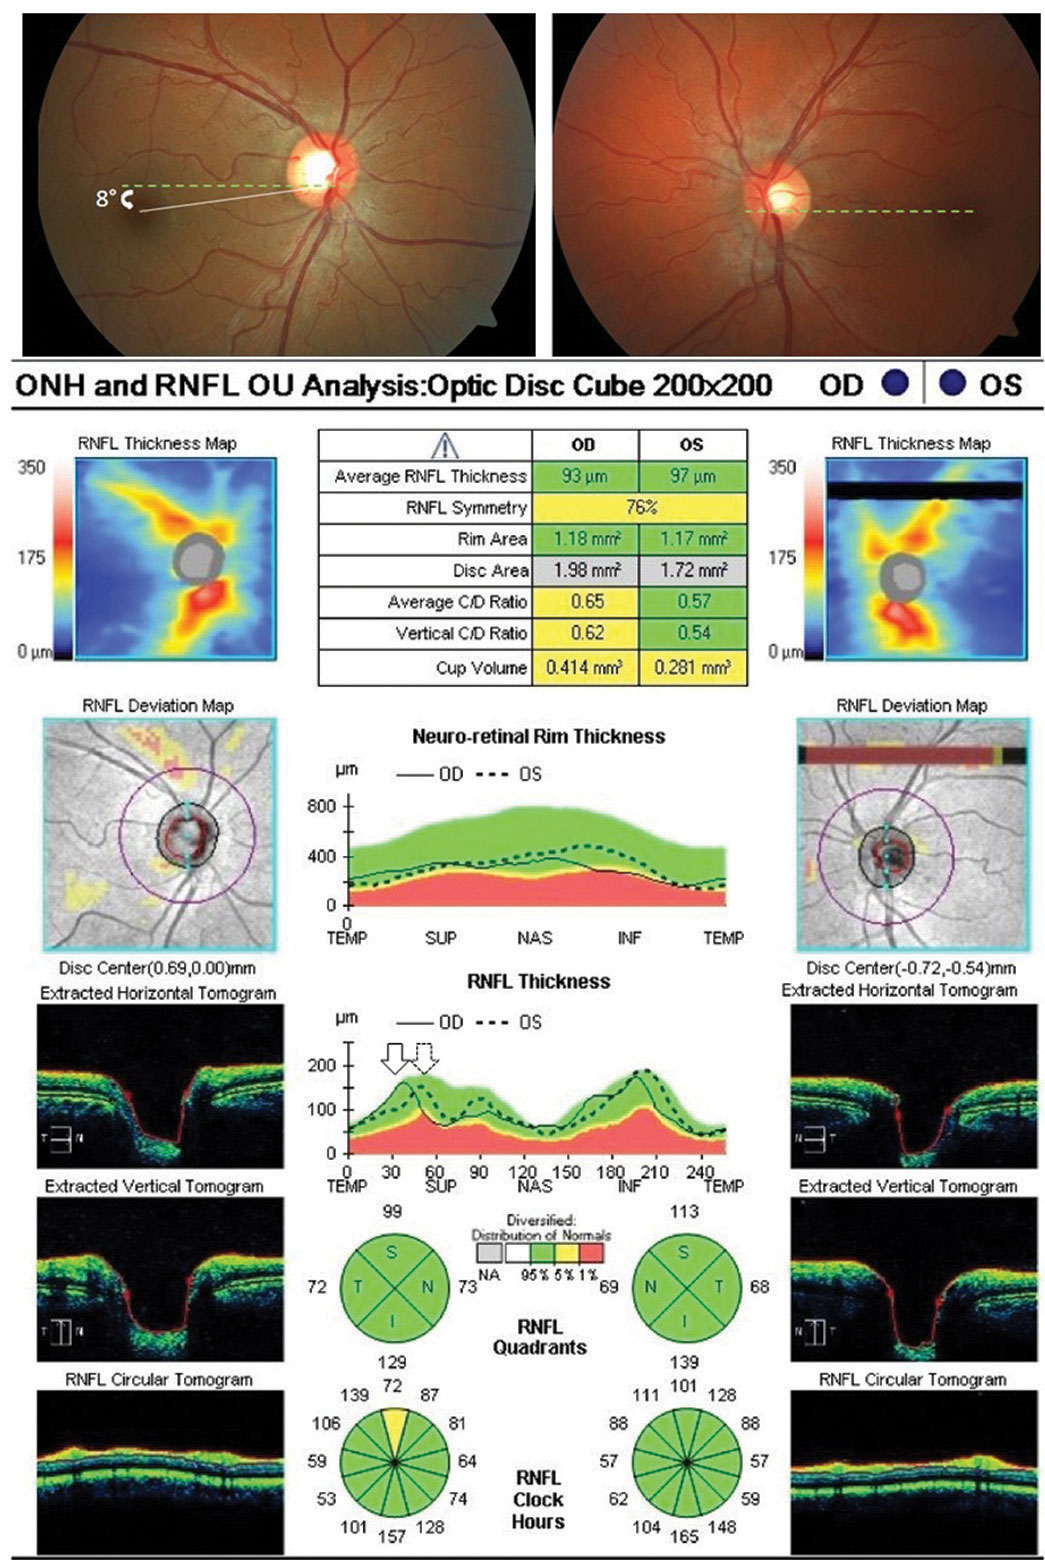
Incorporating these images as part of your glaucoma evaluation can add tremendous value. Enhanced-depth-imaging (EDI) OCT is a method of preferentially imaging deeper structures such as the choroid or the lamina. Many OCT instruments automatically incorporate EDI-OCT or have an EDI “check-box” option. You can also enhance your view of deeper structures using one-line raster scans that maximize imaging averaging. Two measures of the lamina can be of predictive value: laminar thickness and lamina cribrosa depth (Figure 2).
 |
| Fig. 2. In this EDI-OCT through the optic nerve, the lamina cribrosa thickness (LCT) is measured from the anterior border (blue dashed line) to the posterior border (yellow dashed line) of the lamina cribrosa. Lamina cribrosa depth (LCD) is measured along a perpendicular line from the anterior border of the lamina to a reference line that connects the edges of Bruch’s membrane (red solid line). Click image to enlarge. |
The biomechanical theory of glaucoma postulates that ganglion cell axons are crushed as the lamina distorts and bows posteriorly due to intraocular pressure (IOP) elevation.1,2 Theoretically, thinner or weaker laminas will bow more with even modest IOP elevation. Investigations using EDI-OCT laminar imaging show that the lamina tends to be thinner in eyes with primary open-angle glaucoma (POAG) compared with normal eyes and laminar thinning correlates with the degree of structural and functional glaucomatous damage.3-5 One study found a mean laminar thicknesses of 234µm, 179µm and 156µm in eyes with early, moderate and advanced stage glaucoma, respectively.3 Another study found that a faster rate of nerve fiber layer thinning was associated with a laminar cribrosa depth greater than 490µm, and smaller lamina cribrosa thickness in POAG eyes. Therefore, EDI-OCT measures may have predictive value for glaucomatous progression.6
 |
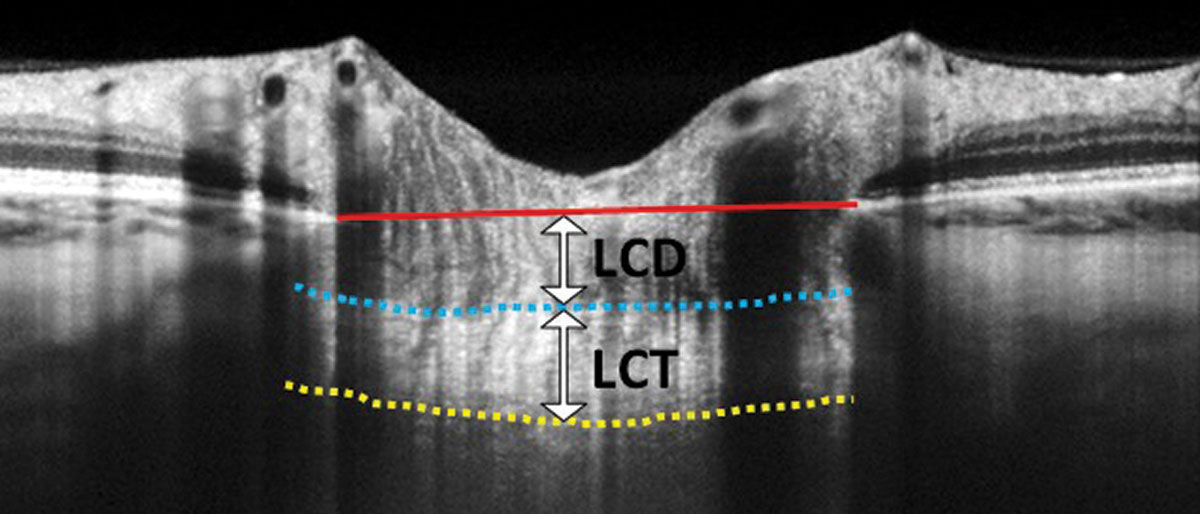
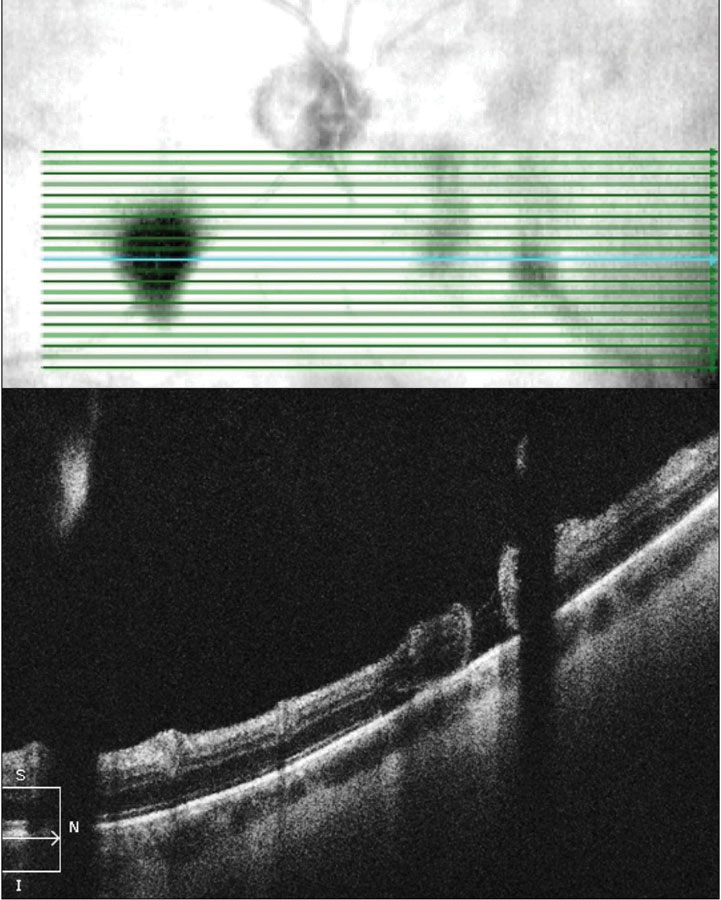
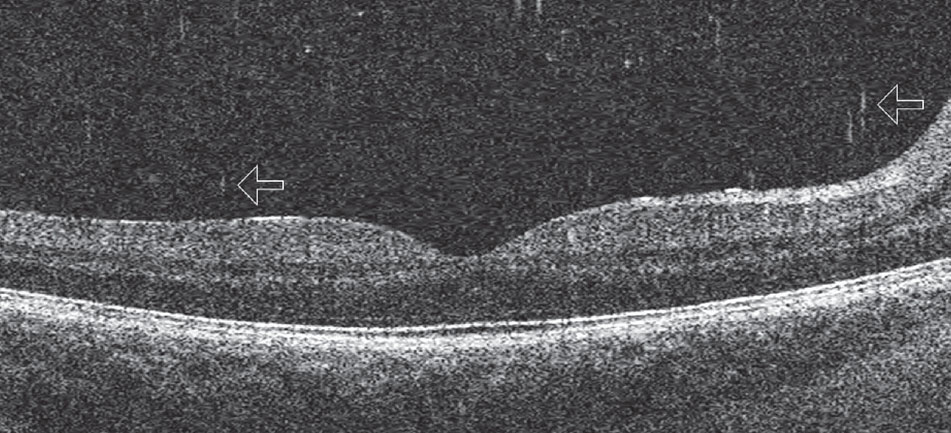
| Fig. 3. This OCT raster scan taken through an area of lattice degeneration in the inferior peripheral fundus shows retinal thinning (yellow arrow) bordered by vitreous condensation/vitreoretinal traction. OCT does not reveal any full-thickness breaks. Click image to enlarge. |
3. Assess Peripheral Retinal Lesions
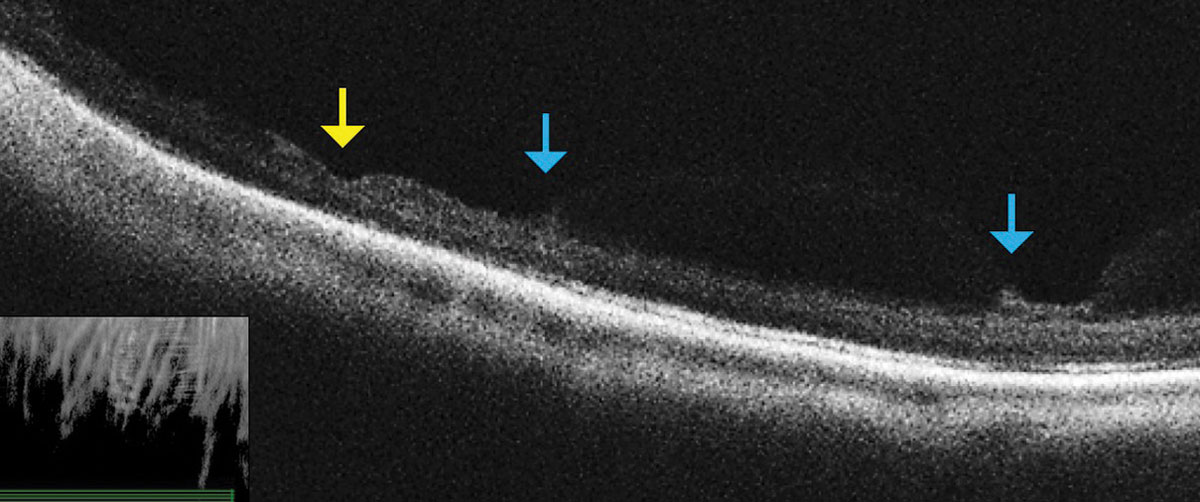
Don’t be afraid to image peripheral lesions with off-axis OCT raster scanning, as it can help you to differentiate between lamellar and full thickness peripheral retinal holes within areas of lattice degeneration (Figure 3). It can also help you measure the extent of subretinal fluid surrounding atrophic holes and monitor progression. Along with scleral indentation and Goldmann 3-mirror evaluation, peripheral OCT imaging can aid in distinguishing a vitreoretinal tuft from a full thickness flap tear that requires barrier laser treatment (Figure 4). This OCT technique also allows you to differentiate retinoschisis from a retinal detachment (Figure 5).
 |
| Fig. 4. OCT raster scan reveals a subclinical retinal tear with minimal surrounding subretinal fluid in a patient with acute onset vitreous hemorrhage and proliferative DR. Click image to enlarge. |
4. Determine Macular Status in Retinal Detachment
In rhegmatogenous retinal detachment (RRD), the status of macular attachment dictates the urgency of referral for surgical repair, as macula-on RRDs constitute emergent referral. However, when a detachment is shallow, the true extent of the detachment and its proximity to the macula can be difficult to assess clinically. Additionally, the macula can be challenging to assess clinically in tractional retinal detachments resulting from proliferative conditions such as diabetic retinopathy. Concurrent vitreous hemorrhage may result in decreased macular visibility with ophthalmoscopy. OCT can help to delineate the extent of retinal detachment and the degree of macular involvement (Figure 6). Although the vitreous hemorrhage can limit OCT imaging, depending on the extent and location, even a poor quality OCT in these cases can provide substantial information that is relevant when determining referral urgency (Figure 7).
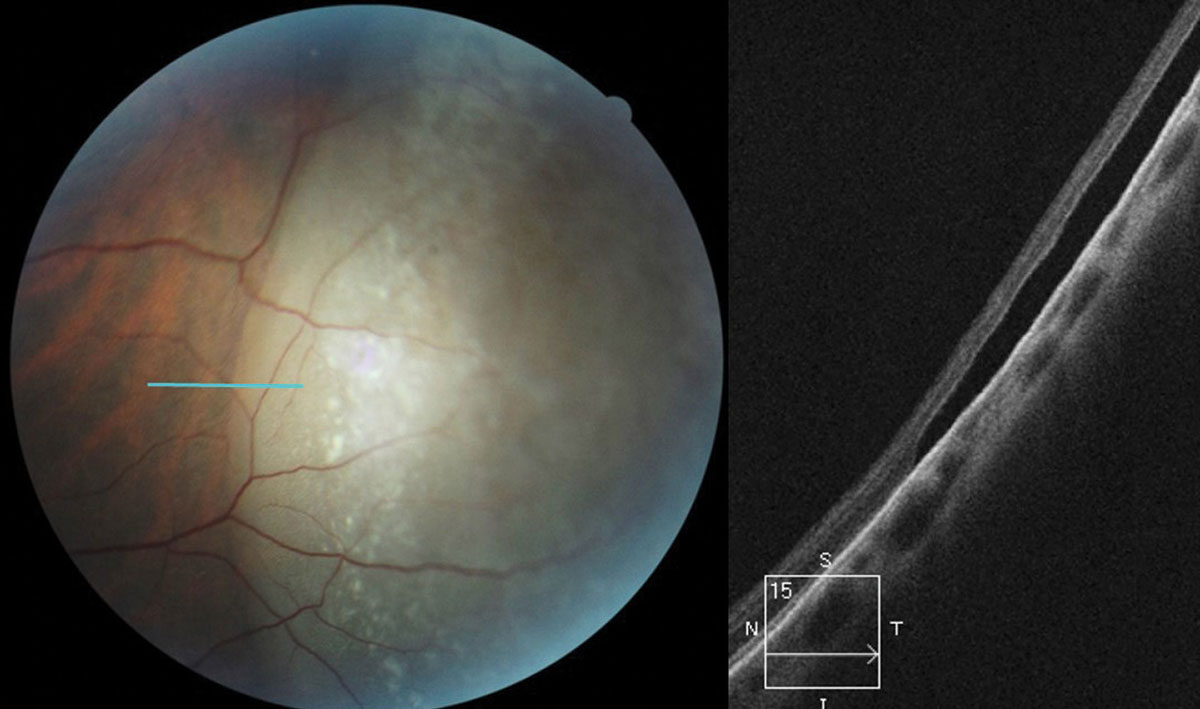 |
| Fig. 5. OCT raster scan taken though an elevated peripheral retinal region in a 26-year-old female diagnosed with retinoschisis one year prior. OCT reveals a full-thickness RRD caused by a combination of inner and outer layer holes in a preexisting retinoschisis. Click image to enlarge. |
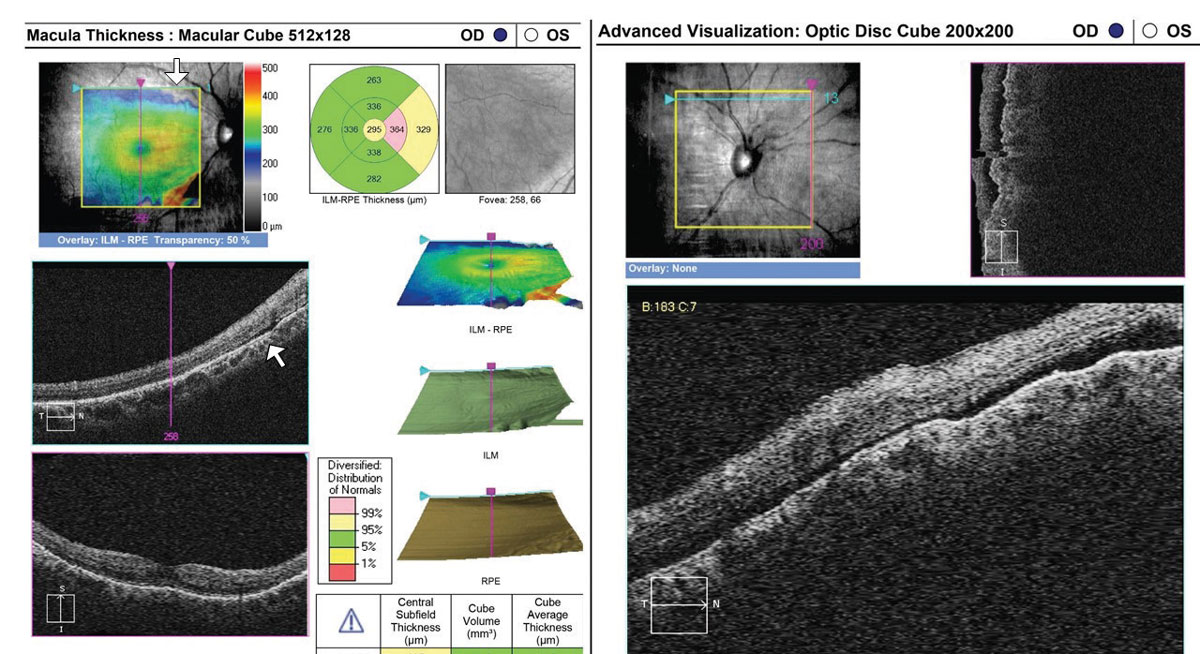 |
| Fig. 6. This 35-year-old with a history of blunt trauma OD and 20/30+ acuity was referred for evaluation of IOP elevation. OCT reveals a very shallow RRD involving the superior aspect of the optic nerve head cube (right) and superior macula (left, arrows). Referral was emergent. Click image to enlarge. |
5. Identify Posterior Shaffer’s Sign
OCT can image small cells within the vitreous that take on the appearance of “falling ash” (Figure 8).7 Cells in this region may represent pigmented cells suggestive of a retinal break in the setting of an acute posterior vitreous detachment (PVD), similar to “tobacco dust” seen in the anterior vitreous, or inflammatory cells in cases of vitritis. They may also represent red blood cells in the instance of vitreous hemorrhage. If seen in the presence of an acute symptomatic PVD, they suggest that a retinal break is likely present and the patient should have a through fundus examination that includes scleral depression and Goldmann 3-mirror retinal assessment. Clinicians should be careful to distinguish between age-related vitreous floaters and cells on OCT—vitreous cells are more numerous and smaller than age-related floaters.
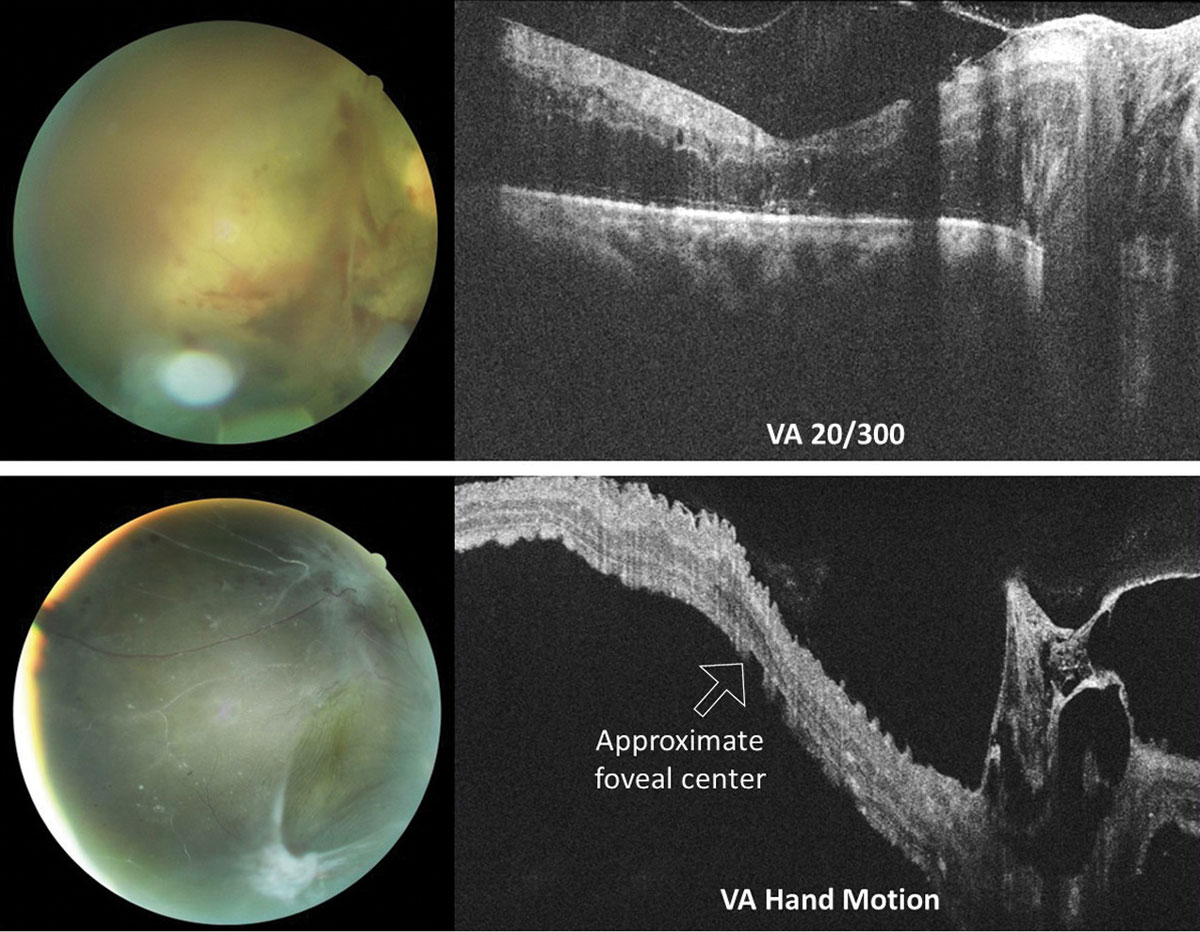 |
| Fig. 7. OCT raster scans through the optic nerve and macula in two different patients with proliferative diabetic retinopathy with vitreoretinal traction of the right eye. In both instances, macular involvement was uncertain based on clinical examination alone. The top eye suffers from severe macular edema of an attached macula. Conversely, the macula of the bottom eye is detached. Acuities were top 20/300 (top) and hand motion (bottom). Click image to enlarge. |
6. Differentiate Nonproliferative from Proliferative Diabetic Retinopathy
Widefield, montage OCT angiography (OCT-A) is an invaluable tool for detecting early neovascularization (Figure 9). A recent study found that approximately half of eyes graded as severe nonproliferative diabetic retinopathy (NPDR) based on fundus photography and clinical exam had areas of preretinal neovascularization when imaged with widefield OCT-A.8 Making the distinction between proliferative and nonproliferative DR is important for management and monitoring, especially as practice trends are moving toward earlier anti-VEGF therapy. Patients with significant, widespread peripheral nonperfusion should be monitored more closely than those without.
 |
| Fig. 8. This posterior Shaffer’s sign shows cells in the posterior vitreous that appear as “falling ash” (arrows). Click image to enlarge. |
7. Assess the Anterior Chamber and Image the Angle
Anterior segment OCT (AS-OCT) imaging gained popularity in 2005 and 2006 with the FDA approval of two commercial devices. Both were specifically designed to image the anterior segment with a longer wavelength (1,310nm) than posterior segment OCT (about 800nm) to provide deeper imaging of anterior tissues, including the scleral spur. Several parameters were proposed to use AS-OCT as screening device for anatomically narrow angles.
Adaptive lenses were soon developed to allow posterior OCT devices to also capture the anterior segment. Today, most devices have a built-in anterior segment imaging module, usually capable of scanning 6mm wide areas to provide limbus-to-limbus imaging of the anterior chamber as well as localized scans of the cornea and conjunctiva.9
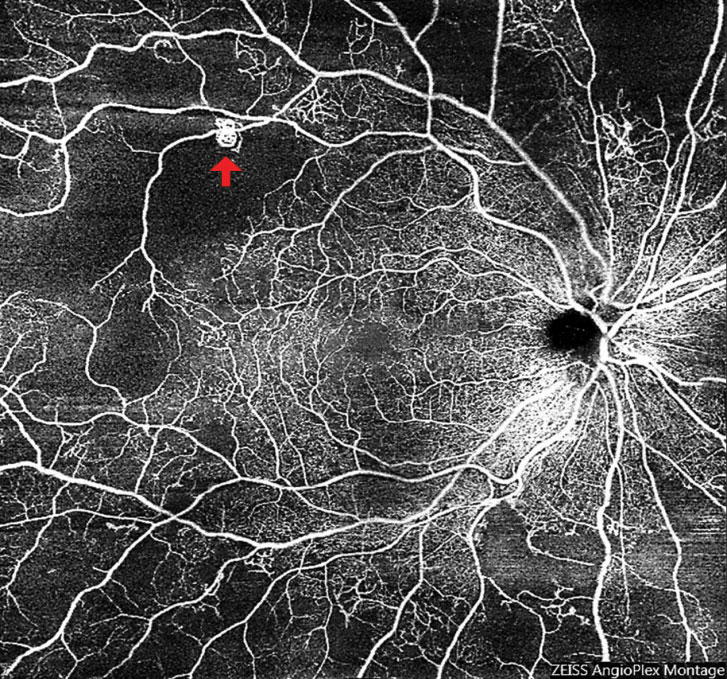 |
| Fig. 9. Widefield OCT-A of an eye with subtle neovascularization (arrow) led to a diagnosis of early proliferative diabetic retinopathy. Also note the significant peripheral retinal nonperfusion. Click image to enlarge. |
8. Image Suspected Anterior Segment Tumors
On ultra-high resolution OCT, ocular surface squamous neoplasia shows three distinctive features: a hyper-reflective thickened epithelial layer, an abrupt transition from normal to abnormal epithelium and a distinct plane between the lesion and the tissue beneath.10 Ultra-high resolution OCT can image down to just 3µm, while most commercially available equipment has a resolution of 4µm to 5µm, making this application possible only in devices with above-average resolution. AS-OCT can also image small hypopigmented tumors, although ultrasound biomicroscopy has superior penetration and should be used in highly pigmented and ciliary body suspected tumors.11,12 Researchers are currently investigating OCT-A as a noninvasive and cost-effective method to assess vasculature characteristics in potentially malignant iris lesions.9
9. Assess The Anterior Segment Peri- and Postoperatively
AS-OCT is the only single instrument that can image all five corneal layers—epithelium, Bowman’s layer, corneal stroma, Descemet’s membrane and endothelium—making it a valuable diagnostic and perioperative tool. AS-OCT images are routinely used to assess intracorneal ring placement, Descemet’s stripping endothelial keratoplasty (DSEK) and refractive surgery outcomes.13-16 Specifically, AS-OCT allows for accurate measurement of flap thickness, residual stromal bed thickness, and detection of flap-related complications for preoperative planning. After myopic LASIK, clinicians can use AS-OCT to calculate the corneal power and accurately select the intraocular lens power in cataract surgeries.9,16
AS-OCT is also useful as a prognostic predictor following trabeculectomy. Successful filtering blebs exhibit certain slit-lamp examination features such as moderate elevation, diffuse extent, scarce vascularity and conjunctival microcysts. AS-OCT imaging shows that failed blebs tend to have a highly reflective bleb wall surrounding the internal fluid-filled cavity, leading to the belief that a thinner bleb wall may allow for better aqueous flow and lower IOP.17 As a noninvasive imaging tool that carries no risk of infection, AS-OCT is advantageous over conventional ultrasound biomicroscopy bleb examination.18,19
When a laser peripheral iridotomy (LPI) is small or placed far in the periphery of the iris under arcus, assessing patency can be a clinical challenge. However, a simple AS-OCT raster scan can quickly and easily assist the clinician in confirming LPI patency (Figure 10).
 |
| Fig. 10. AS-OCT of a small laser peripheral iridotomy reveals a full thickness hole. Lens zonules can be seen in the bottom scan due to light penetration through the patent iridotomy. Click image to enlarge. |
10. Image Corneal Disorders
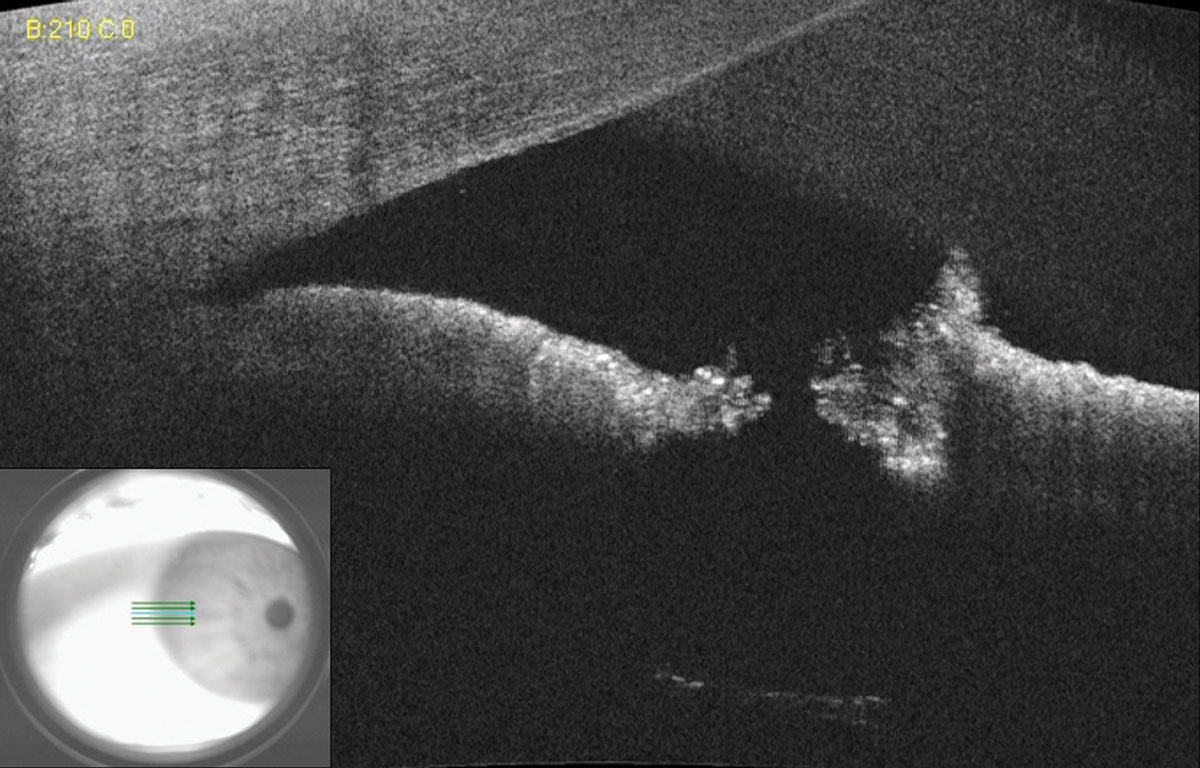
Assessing the depth, size and affected layers of corneal lesions with AS-OCT offers many advantages over slit-lamp examination or photography. With a minimum resolution of up to 5µm, depending on the instrument, you can determine the exact involved layer and depth of any corneal lesion with certainty. This can be particularly important in the management of corneal infections, corneal foreign bodies and keratoconus.19,20 One of the most severe complications of advanced keratoconus is corneal hydrops, stromal edema, due to a tear in Descemet’s membrane. Without AS-OCT, it can be difficult to assess corneal integrity of posterior corneal layers by conventional slit-lamp examination in the presence of scarring or haze anterior to the layer in question (Figure 11).
 |
| Fig. 11. This AS-OCT scan of a 28-year-old Asian patient with advanced keratoconus and moderate-to-severe pain demonstrates intact endothelial and posterior stromal layers while showing increased reflectivity associated with stromal scarring. In this case, AS-OCT confirmed an intact endothelium and Descemet’s membrane. As an added advantage, corneal thickness was measured accurately at the thinnest location using the caliper tool, thereby providing a reliable baseline for follow-up comparison. In light of the anatomical state of the cornea, the patient’s symptoms were attributed to epithelial disruption overlying the apex of corneal steepening. Click image to enlarge. |
Features of microbial keratitis on AS-OCT include infiltrates that appear as hyper-reflective areas in the corneal stroma. Researchers also note that you can see anterior chamber inflammatory cells with AS-OCT.21 In addition, you can closely monitor corneal and infiltrate thicknesses when measured with the caliper function.
OCT can help to establish the depth of a demarcation line that occurs following corneal collagen crosslinking, and you can use it as a keratoconus screening tool to detect focal thinning.22-25
Corneal dystrophies are categorized relative to the affected corneal layer: epithelial-subepithelial, epithelial-stromal, stromal and endothelial dystrophies. Researchers have found that OCT images correlate with histological sections, and can serve as a reference to confirm a clinical diagnosis and track changes over time. As an example, Reis-Bückler’s corneal dystrophy shows a hyper-reflective material at the level of Bowman’s layer on OCT.26
11. Tear Meniscus and Dry Eye Evaluation
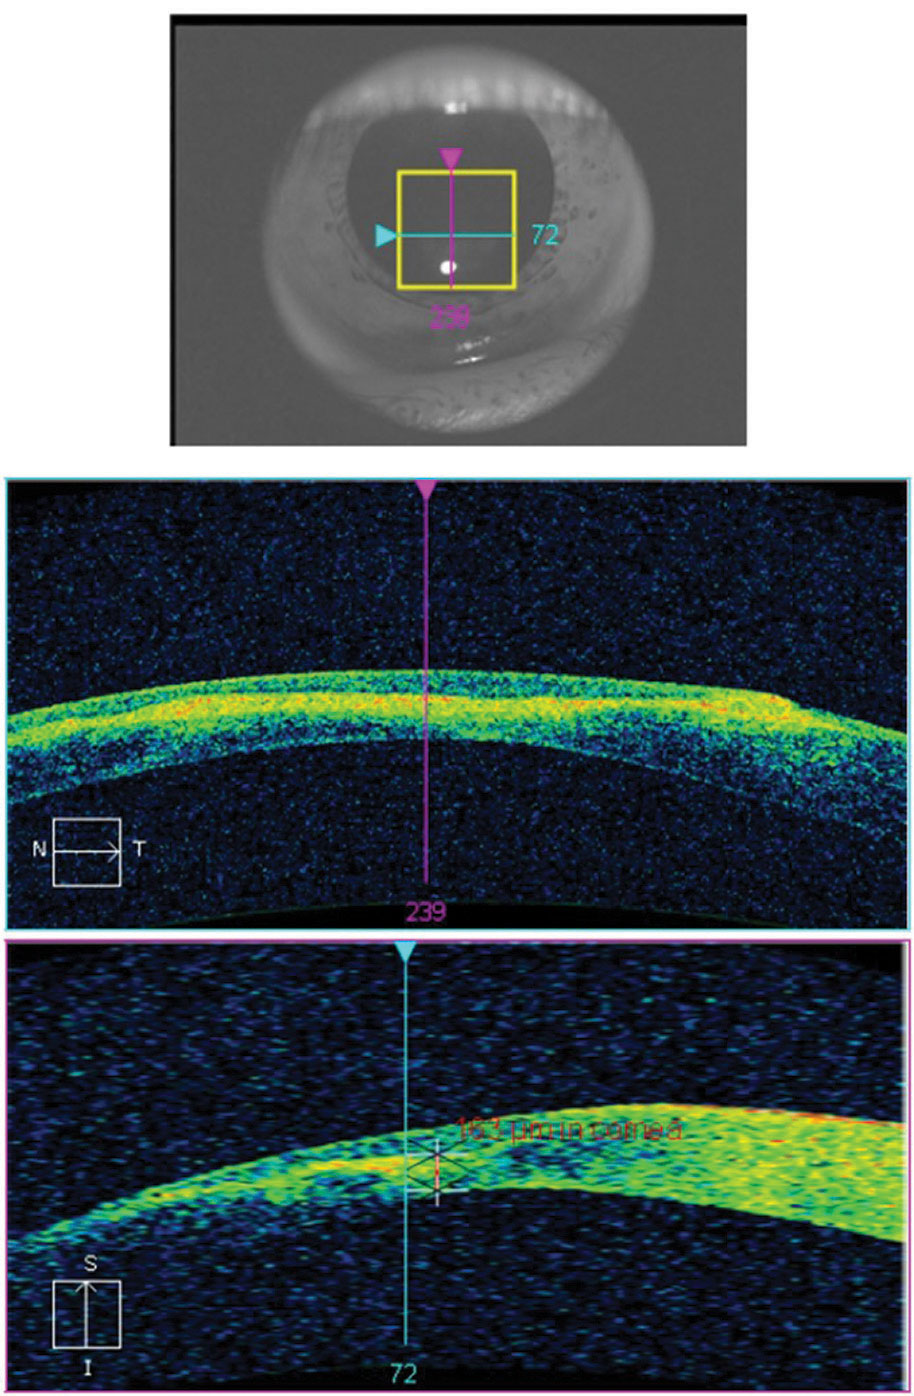
Although Schrimer’s scores and tear break-up time are consistently used as baseline for dry eye disease, investigators note that tear meniscus height (TMH) taken with OCT can more precisely label dry eye (Figure 12). TMH should be greater than or equal to 0.2mm (or 200µm)—anything below this number is suspicious for dry eye.26
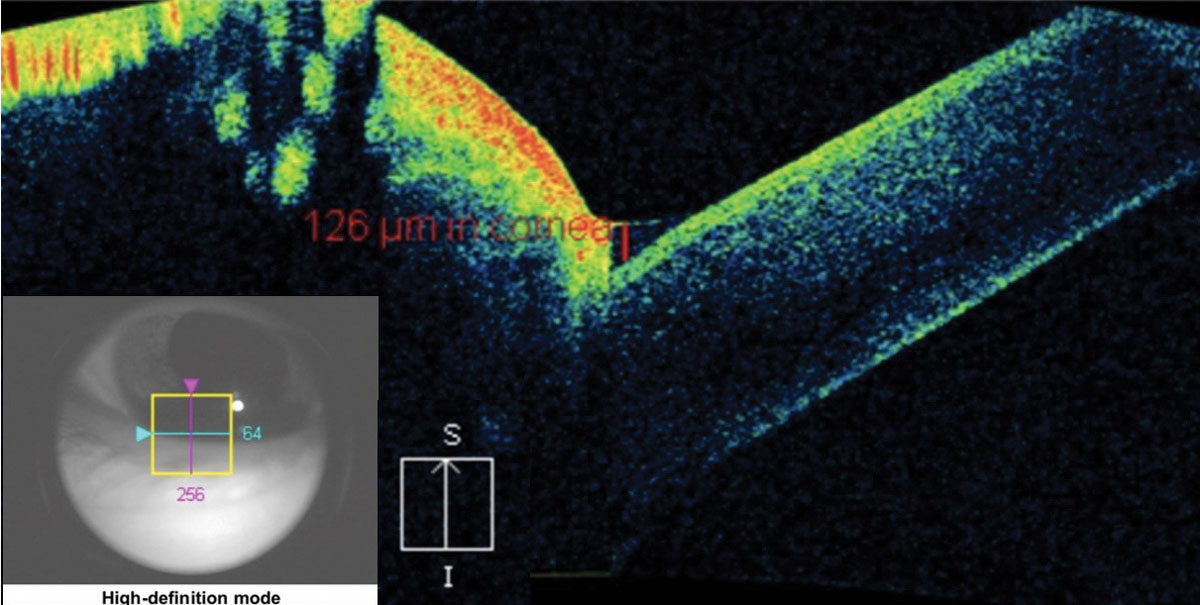 |
| Fig. 12. The crosshair of this anterior segment cube scan taken at the lid margin shows the tear meniscus height at the fornix of the globe and the palpebral conjunctiva. The measurement of 126μm is considered dry eye. Click image to enlarge. |
12. Corneal Epithelium Thickness Mapping
Epithelium thickness mapping (ETM) with OCT recently received FDA approval.27 This scanning tool will allow you to follow irregularities in dry eye, epithelial shape changes (i.e., epithelial bogging under a contact lens tear reservoir) under a contact lens, detect early keratoconus changes and any anterior surface deformities, such as Salzmann’s nodules.27,28
In Conclusion
This versatile instrument, and its ever-progressing iterations, has become integral to many aspects of the ocular exam. While it will never replace your clinical acumen, it can augment your clinical findings and help you diagnose and track any number of anterior and posterior conditions. It’s time to take your relationship with your OCT to the next level.
Dr. Majcher is an associate professor at the Oklahoma College of Optometry Northeastern State University in Tahlequah, Oklahoma.
Dr. Wong- Powell is an assistant professor at the Rosenberg School of Optometry, University of the Incarnate Word in San Antonio, Texas.
Dr. Conner works at Dallas Eye and Ear in Dallas, Texas.
|
1. Quigley HA, Hohman RM, Addicks EM, et al. Morphologic changes in the lamina cribrosa correlated with neural loss in open-angle glaucoma. Am J Ophthalmol. 1983;95:673-91. 2. Bellezza AJ, Rintalan CJ, Thompson HW, et al. Deformation of the lamina cribrosa and anterior scleral canal wall in early experimental glaucoma. Invest Ophthalmol Vis Sci. 2003;44(2):623-37. 3. Park HY, Jeon SH, Park CK. Enhanced depth imaging detects lamina cribrosa thickness differences in normal tension glaucoma and primary open-angle glaucoma. Ophthalmology. 2012;119(1):10-20. 4. Lee EJ, Kim TW, Weinreb RN, et al. Visualization of the lamina cribrosa using enhanced depth imaging spectral-domain optical coherence tomography. Am J Ophthalmol. 2011;152(1):87-95. 5. Inoue R, Hangai M, Kotera Y, et al. Three-dimensional high-speed OCT imaging of lamina cribrosa in glaucoma. Ophthalmology. 2009;116(2):214-22. 6. Lee EJ, Kim TW, Kim M, et al. Influence of lamina cribrosa thickness and depth on the rate of progressive retinal nerve fiber layer thinning. Ophthalmology. 2015;122(4):721-9. 7. Rayess N, Rahimy E, Vander JF, et al. Spectral-domain OCT in acute posterior vitreous detachment. Ophthalmology. 2015;122(9):1946-7. 8. You QS, Guo Y, Wang J, et al. Detection of clinically unsuspected retinal neovascularization with wide-field OCT angiography. Retina. March 4, 2019. [Epub ahead of print]. 9. Ang M, Tan ACS, Cheung CMG, et al. OCT angiography: a review of current and future clinical applications. Graefe’s Arch Clin Exp Ophthalmol. 2018;256(2):237-45. 10. Thomas BJ. Ultra high-resolution anterior segment OCT in the diagnosis and management of ocular surface squamous neoplasia. Ocul Surface. 2014;12(1):46-58. 11. Bianciotto C, Shields CL, Guzman JM, et al. Assessment of anterior segment tumors with ultrasound biomicroscopy versus anterior segment OCT in 200 cases. Ophthalmology. 2011;118(7):1297-302. 12. Pong JCF, Lai JSM. Imaging of primary cyst of the iris pigment epithelium using anterior segment OCT and ultrasonic biomicroscopy. Clin Exp Optom. 2009;92(2):139-41. 13. Han SB, Liu Y-C, Noriega KM, Mehta JS. Applications of anterior segment OCT in cornea and ocular surface diseases. J Ophthalmol. 2016;2016:4971572. 14. Sharma N, Aron N, Kakkar P, Titiyal JS. Continuous intraoperative OCT guided management of post-deep anterior lamellar keratoplasty descemet’s membrane detachment. Saudi J Ophthalmol. 2016;30(2):133. 15. Ang M, Baskaran M, Werkmeister RM, et al. Anterior segment optical coherence tomography. Prog Retin Eye Res. 2018;66:132-56. 16. Tang M, Wang L, Koch DD, et al. Intraocular lens power calculation after previous myopic laser vision correction based on corneal power measured by Fourier-domain OCT. J Cataract Refract Surg. 2012;38(4):589-94. 17. Jung KI, Lim SA, Park HY, Park CK. Visualization of blebs using anterior-segment optical coherence tomography after glaucoma drainage implant surgery. Ophthalmology. 2013;120(5):978-83. 18. Hamanaka T, Omata T, Sekimoto S, et al. Bleb analysis by using anterior segment OCT in two different methods of trabeculectomy. IOVS. 2013;54(10):6536. 19. Yokogawa H, Kobayashi A, Yamazaki N, Sugiyama K. In vivo imaging of coin-shaped lesions in cytomegalovirus corneal endotheliitis by anterior segment optical coherence tomography. Cornea. 2014;33(12):1332-5. 20. Abbouda A, Estrada AV, Rodriguez AE, Alió JL. Anterior segment OCT in evaluation of severe fungal keratitis infections treated by corneal crosslinking. Eur J Opthalmology. 2014;24(3):320-24. 21. Konstantopoulos A, Kuo J, Anderson D, Hossain P. Assessment of the use of anterior segment OCT in microbial keratitis. Am J Ophthalmol. 2008;146(4):534-542. 22. Kymionis GD, Tsoulnaras KI, Grentzelos MA, et al. Corneal stroma demarcation line after standard and high-intensity collagen crosslinking determined with anterior segment OCT. J Cataract Refract Surg. 2014;40(5):736-40. 23. Spadea L, Tonti E, Vingolo EM. Corneal stromal demarcation line after collagen cross-linking in corneal ectatic diseases: A review of the literature. Clin Ophthalmol. 2016;10:1803-10. 24. Steinberg J, Casagrande MK, Frings A, et al. Screening for subclinical keratoconus using swept-source fourier domain anterior segment OCT. Cornea. 2015;34(11):1413-19. 25. Siebelmann S, Scholz P, Sonnenschein S, et al. Anterior segment OCT for the diagnosis of corneal dystrophies according to the IC3D classification. Surv Ophthalmol. 2018;63(3):365-80. 26. Doughty MJ, Laiquzzaman M, Oblak E, Button N. The tear (lacrimal) meniscus height in human eyes: a useful clinical measure or an unusable variable sign? Contact Lens Anterior Eye. 2002;25(2):57-65. 27. Zeiss International. FDA clearance for epithelial thickness mapping. www.zeiss.com/meditec/int/media-news/press-releases/fda-clearance-for-epithelial-thickness-mapping.html. Accessed June 28, 2019. 28. Brujic M, Kading D. Seeing the Cornea with OCT Eyes. RCCL. 2017;155(2):40-41. |