 |
|
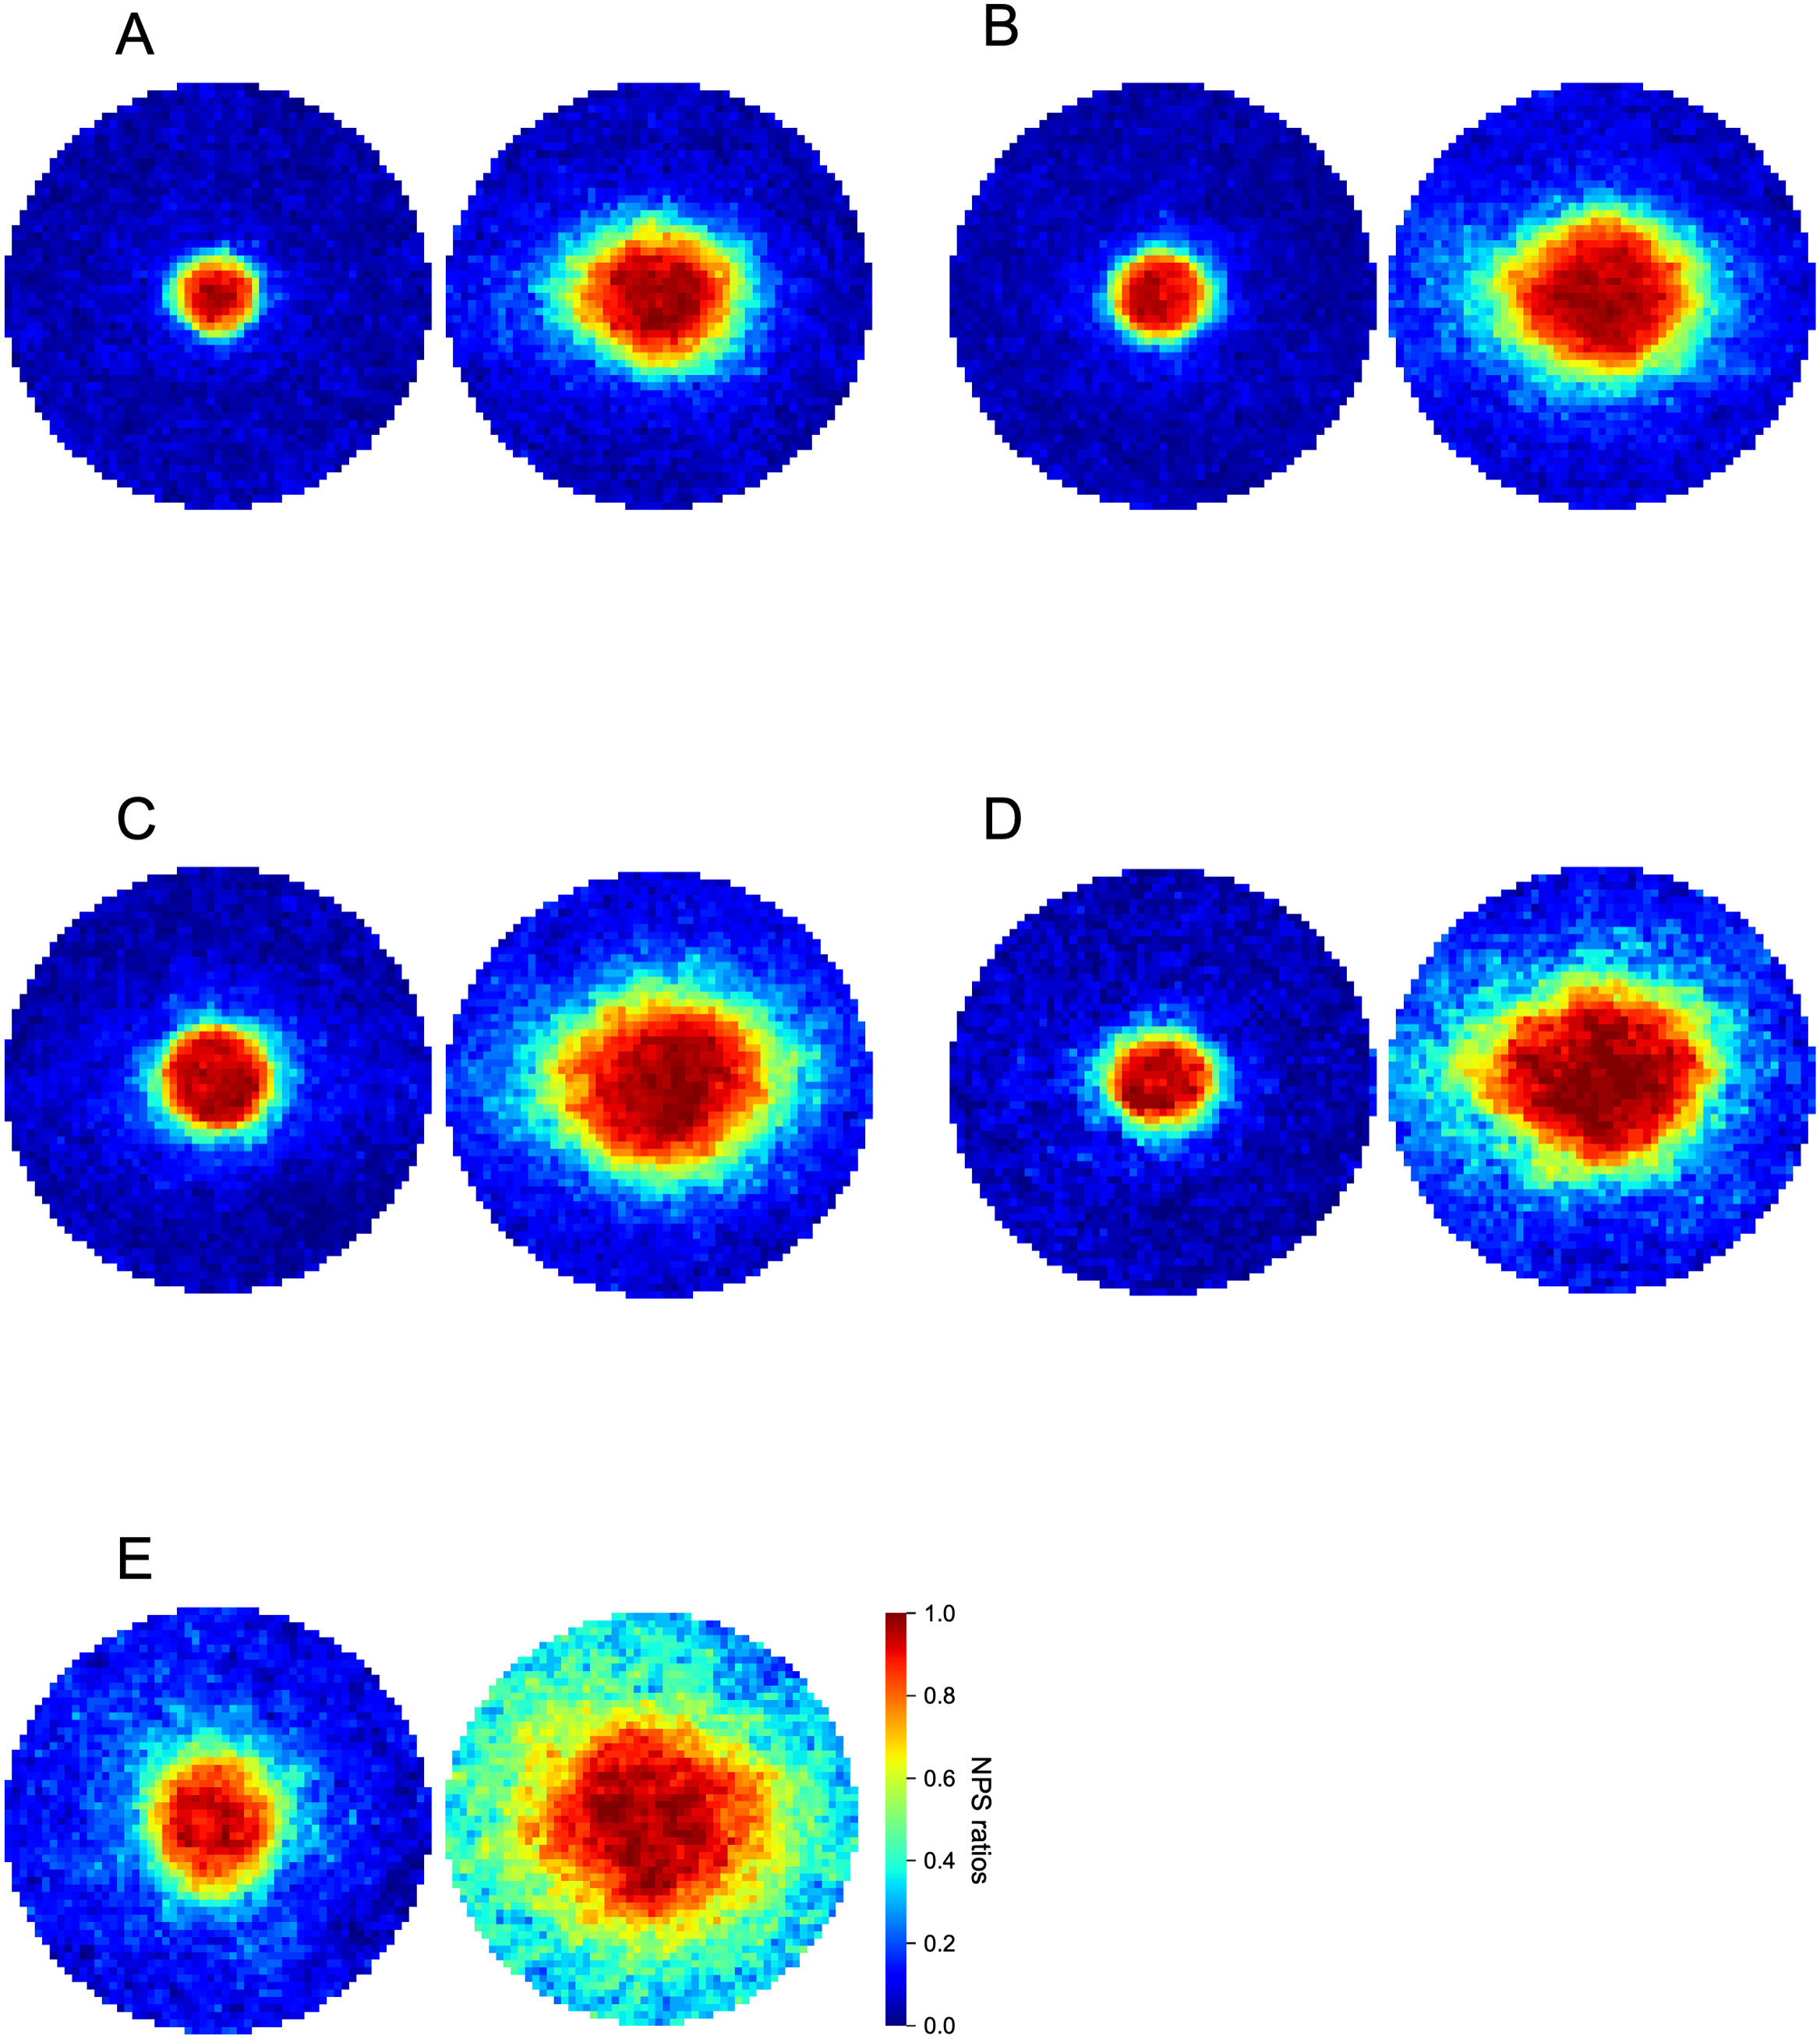
The researchers suggested in their paper that the presence of a superficial and moderate group in the intermediate stage of the disease implies multiple pathways for diabetic macular ischemia progression. This image from the study shows heatmaps of the nonperfusion areas (NPAs) in the superficial (left) and deep (right) layers: (A) The Initial group displays minimal nonperfusion in both. (B) The Mild group shows a mild increase in NPAs in the deep layer. (C) The Superficial group is characterized by larger NPAs in the superficial layer of the central sector. (D) In the Moderate group, the NPAs extended to the temporal subfield in the deep layer. (E) The Severe group is higher in both layers. Photo: Yoshida M, et al. Ophthalmol Sci 2024. Click image to enlarge. |
The progression characteristics of diabetic macular ischemia aren’t well understood, but it is known that the condition is accompanied by capillary nonperfusion leading to visual impairment. Recently, researchers aiming to develop a severity scale for diabetic macular ischemia published their findings in the journal Ophthalmology Science. They used a technique called uniform manifold approximation and projection, which can reinterpret complex multidimensional data as a lower-dimensional representation for ease of visualization and data clustering.
The single-center prospective case series included 301 eyes from 301 patients with diabetic retinopathy. The researchers obtained 3x3mm swept source OCT-A images and used them to create en face images in a 2.5mm circle. This area was divided into 15x15-pixel squares. Nonperfusion squares had no retinal vessels. Using the algorithm, the researchers classified eyes into severity groups: initial, mild, superficial, moderate and severe.
The researchers reported that nonperfusion square counts in the deep layer increased in a stepwise fashion in eyes with initial, mild, moderate and severe algorithmic classification. No significant changes in nonperfusion square counts in the superficial layer were seen between the initial and mild groups.
The researchers observed, however, that in the intermediate stage, the superficial group had higher nonperfusion square counts in the central sector of the superficial layer versus those in the moderate group. The moderate group also exhibited a foveal avascular zone that extended into the temporal subfield of the deep layer. The eyes in the severe group had worse visual acuity and had more proliferative disease than the other groups.
“We proposed a novel severity scale for diabetic capillary nonperfusion in the macula on OCTA images,” the researchers wrote in their Ophthalmology Science article. “This preliminary study would contribute to the further investigation to establish the diagnostic and staging criteria for diabetic macular ischemia.”
Yoshida M, Murakami T, Nishikawa K, et al. Severity scale of diabetic macular ischemia based on the distribution of capillary nonperfusion in OCT angiography. Ophthalmol Sci 2024. [Epub ahead of print]. |