 |
|
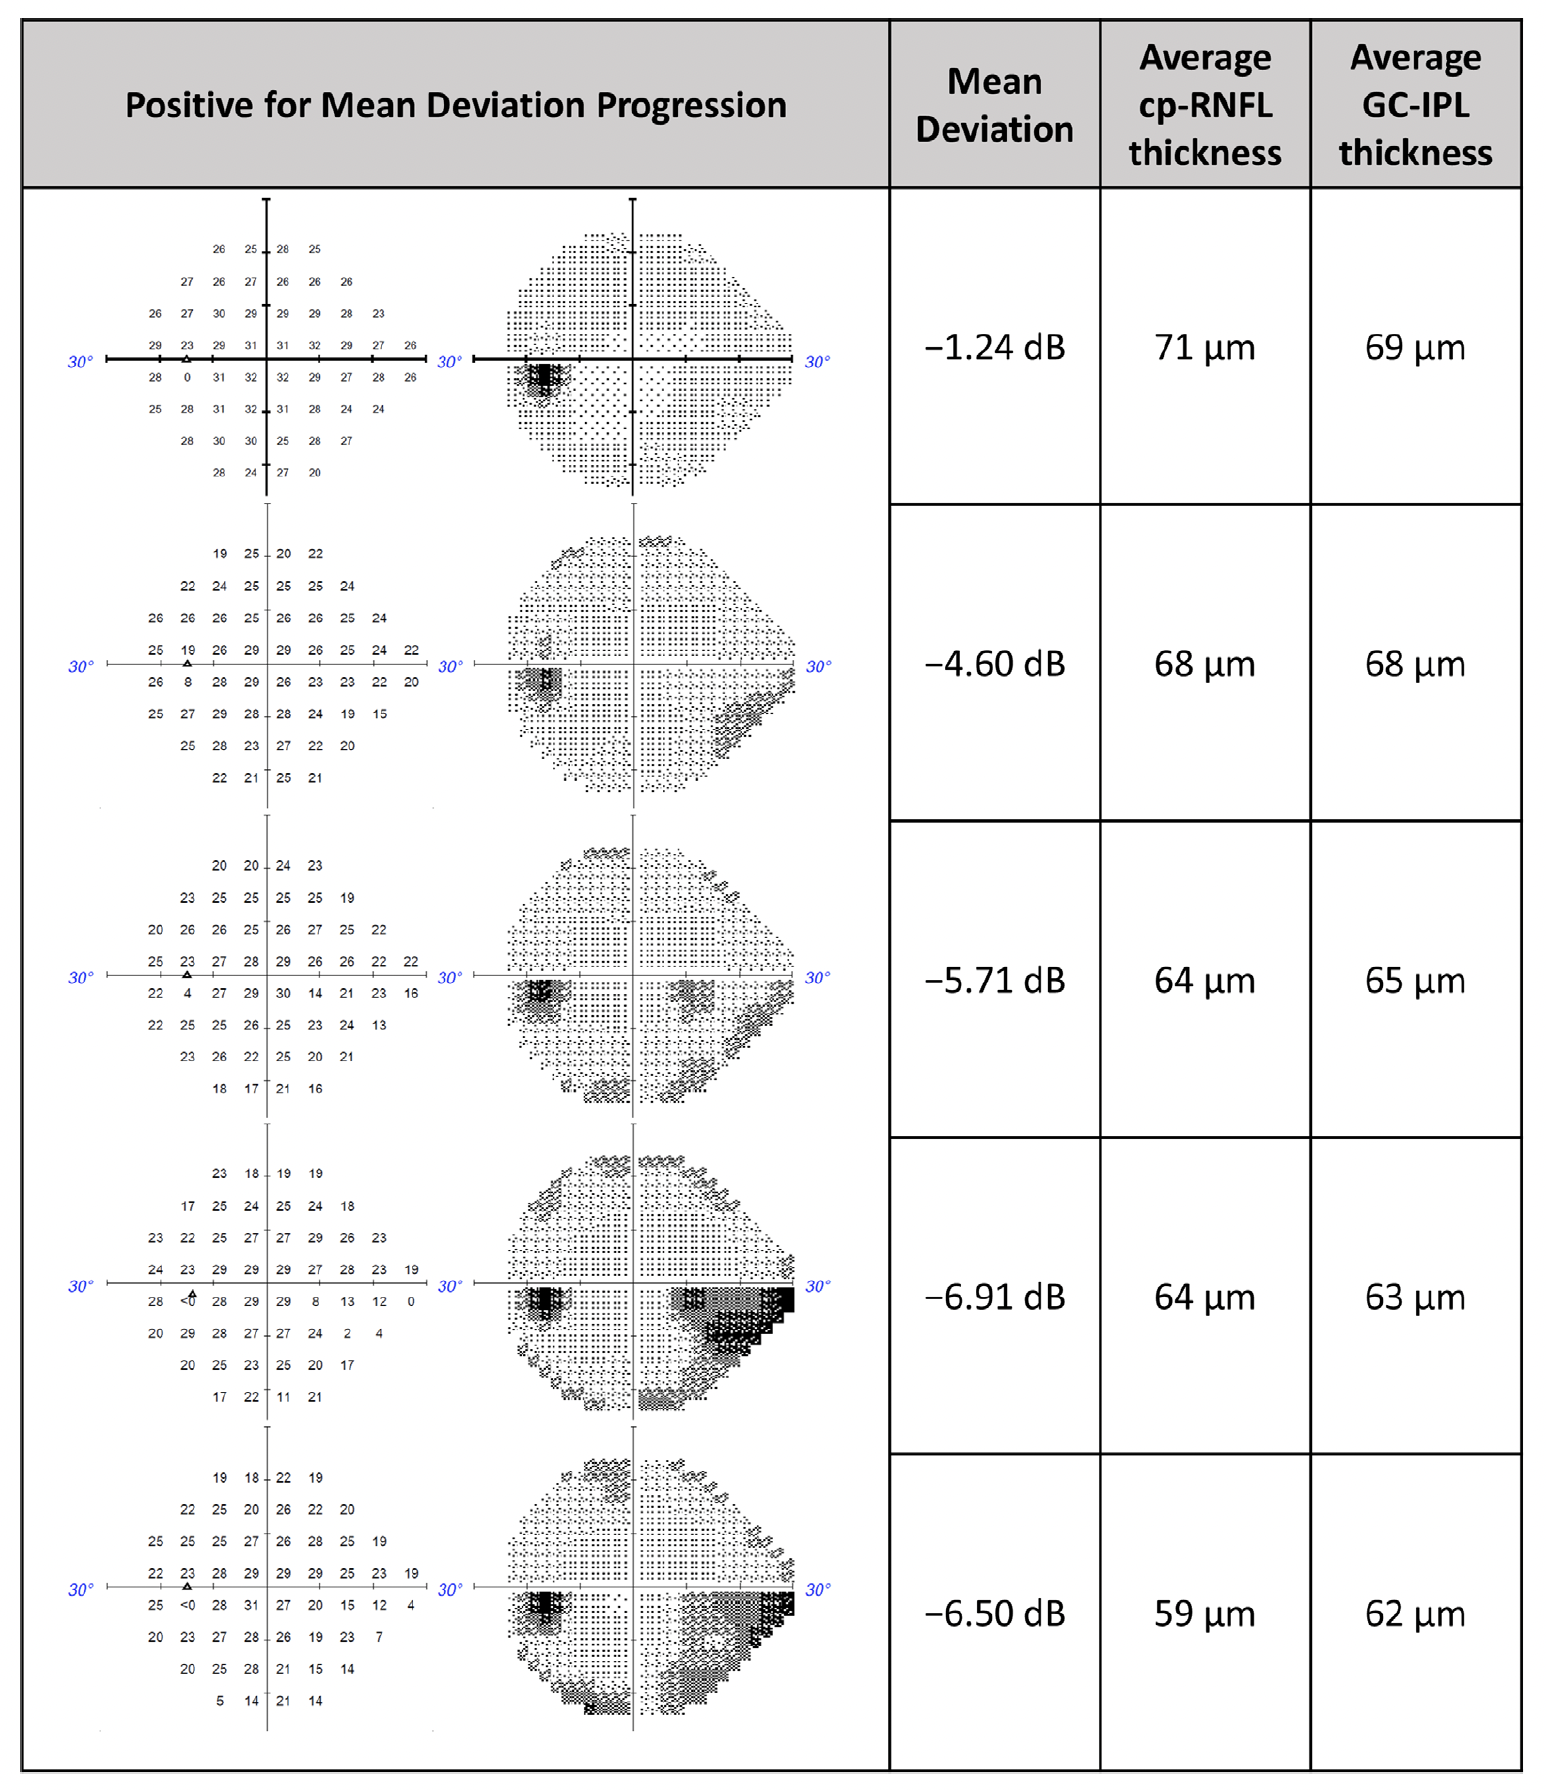
While cp-RNFL and GC-IPL both help predict 24-2 visual field progression in glaucoma patients, combining the two didn’t significantly enhance detection in a recent study. This image from the study shows a representative clinical case in which machine learning and statistical models predicted MD progression when using cp-RNFL thickness, GC-IPL thickness and both (combined). Photo: Pham AT, et al. Transl Vis Sci Technol. 2024;13(8):12. Click image to enlarge. |
Proper management of glaucoma requires routine OCT to image the optic nerve head and measure retinal nerve fiber layer thickness in the circumpapillary region (cpRNFL). Thinning of the cp-RNFL indicates an axonal loss due to pressure-induced injury to retinal ganglion cells, which could signify earlier stages of glaucoma and permit timely intervention before noticeable vision loss occurs through visual field (VF) testing. However, once cp-RNFL thinning exceeds measurable limits, OCT can no longer detect further structural changes, indicating its limited utility in later stages of the disease.
More modern research has demonstrated that analyzing ganglion cell inner plexiform layer (GC-IPL) thickness in this patient population is at least as accurate as cp-RNFL analysis in predicting VF progression in the early stages of the disease. Recently, researchers attempted to use machine learning to investigate the ability of both measurements to predict glaucomatous VF worsening.
In the study, machine learning and statistical models were trained on 924 eyes (924 patients) with cp-RNFL or GC-IPL thickness measurements. Researchers used this data to predict the probability of 24-2 VF worsening (using both trend- and event-based progression definitions). They also combined cp-RNFL and GC-IPL predictions to determine if the two measurements together would enhance detection. An additional 617 eyes comprised the testing set, which was used to calculate the area under the curve (AUC) to compare cp-RNFL, GC-IPL and combined predictions.
The analyses showed that overall, both OCT measurements performed similarly when predicting trend-based and event-based 24-2 VF progression. When using the trend-based analysis as ground truth, the respective AUCs for cp-RNFL, GC-IPL and combined predictions with the machine learning model were 0.78, 0.75 and 0.81; for the statistical model, AUCs were 0.72, 0.69 and 0.73, respectively. There were no statistical differences in performance between the cp-RNFL, GC-IPL and combined predictions; however, AUCs were highest in glaucoma suspects using cp-RNFL predictions and highest in moderate/advanced glaucoma using GC-IPL predictions.
Using event-based analysis, AUCs for the statistical and machine learning models for cp-RNFL, GC-IPL and combined predictions were 0.63, 0.68, 0.69, and 0.72, 0.69, 0.73, respectively. Notably, when using this definition of progression, predictive performance decreased with increasing disease severity for all conditions.
In their paper, published recently in Translational Vision Science & Technology, the study authors summarized some of their findings. “Combining cp-RNFL predictions with GC-IPL predictions led to a minimal improvement in predictive performance, and differences were not statistically significant,” they wrote. “When stratifying by disease severity, we found that cp-RNFL predictions performed best in suspect glaucoma, while GC-IPL predictions performed best in moderate or advanced disease for trend-based VF progression.”
The authors concluded that using longitudinal cp-RNFL and GC-IPL thickness measurements can predict 24-2 VF worsening defined by trend-based analysis “with modest accuracy.” In early glaucoma, these findings suggest that cp-RNFL features better predict VF worsening, while GC-IPL features show greater predictive ability in late-stage disease. Furthermore, the authors found that “changes in structural features had lower predictive performance at predicting event-based VF change.”
Pham AT, Pan AA, Bradley C, et al. Detecting visual field worsening from optic nerve head and macular optical coherence tomography thickness measurements. Transl Vis Sci Technol. 2024;13(8):12. |