Investigating new imaging and functional biomarkers is critical for evaluating potential therapeutic targets and understanding AMD pathogenesis and progression. The risk for progression is highly concentrated within the 3mm-diameter macula lutea, conveniently captured by the grading grid of the Early Treatment of Diabetic Retinopathy Study (ETDRS). Therefore, topographic measurement for understanding AMD pathogenesis and progression has taken on new importance.
In a recent study, researchers from the Massachusetts Institute of Technology in Cambridge and Tufts University in Boston explored the topographic relationship of the hyporeflective band thickness within the ETDRS grid in normal aging and AMD to determine associations with other imaging or functional biomarkers for therapeutic development and clinical trials. They observed ETDRS grid-dependent age-associated differences in the hyporeflective band vi, particularly decreasing band thickness in the inner ring with aging. They noted a statistically significant thickness difference between normal older eyes and early AMD eyes throughout the central 4.2mm diameter, with higher statistical power within the 3mm diameter ETDRS circle.
 |
|
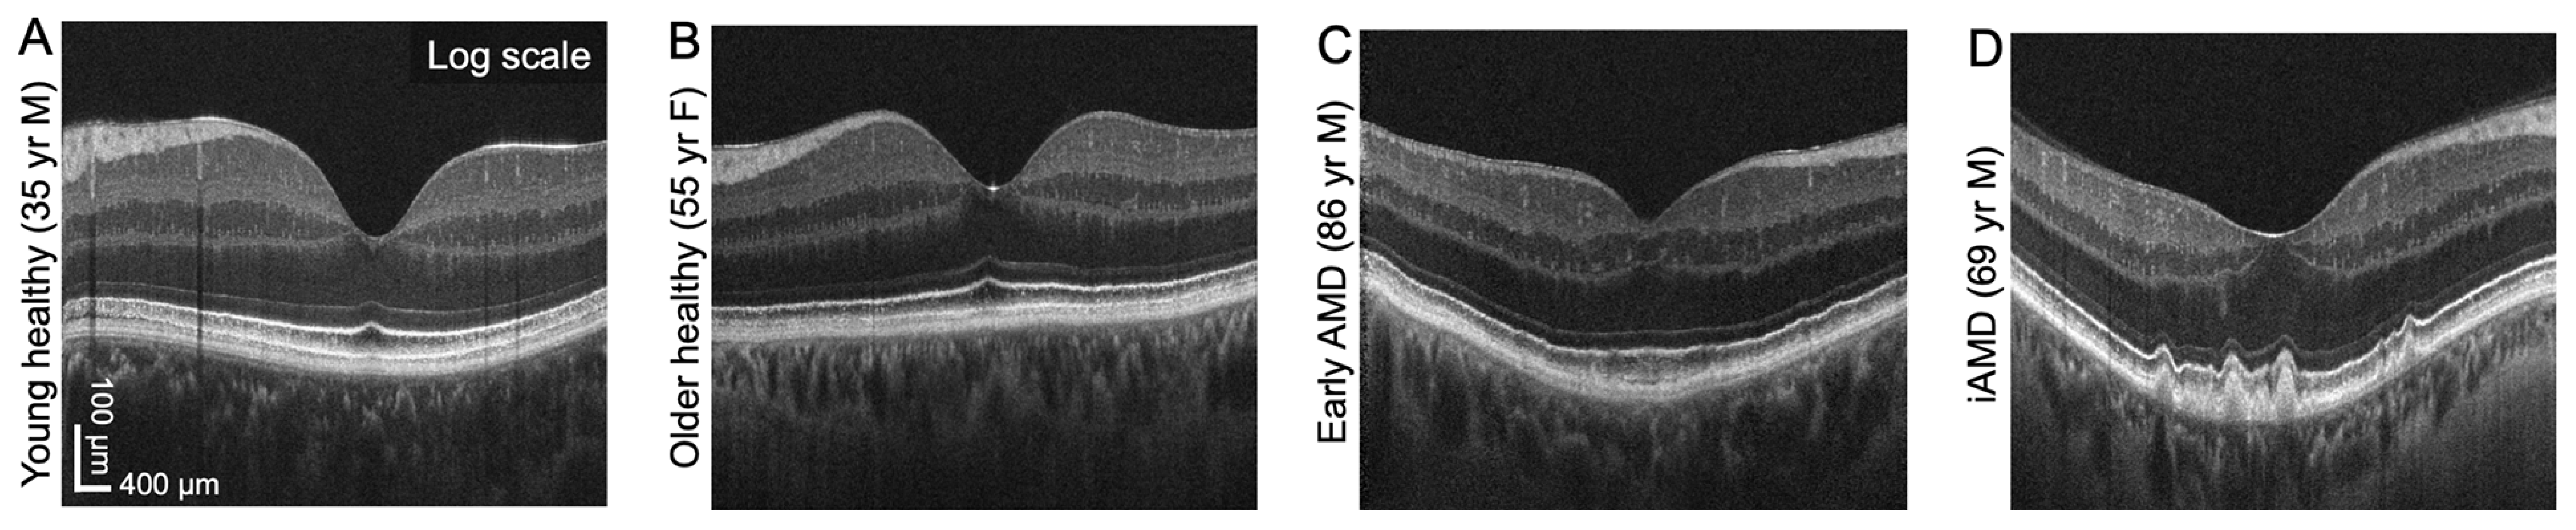
This set of images from the study shows B-scan visualizations of hyporeflective band vi thickness in normal aging and AMD. Photo: Won J, et al. Invest Ophthalmol Vis Sci. 2024;65(10):18. Click image to enlarge. |
The researchers measured hyporeflective band topography with a high-resolution prototype OCT using isotropic volume raster scanning combined with computational motion correction and volume fusion, as well as a custom-designed neural network. Isotropic volume raster scans over 6x6mm (500x500 A-scans) were acquired using a high-resolution (2.7µm axial resolution) spectral-domain OCT prototype instrument. Six consecutive OCT volumes were computationally motion-corrected and fused to improve feature visibility. A boundary regression neural network was developed to measure hyporeflective band thickness. The team analyzed 90 normal eyes from 76 individuals (age range = 23 to 90 years old) and 53 dry AMD eyes from 47 patients (age range = 62 to 91 years old). Due to the difficulties in recruiting older subjects, eyes from subjects with diabetes mellitus without clinical retinopathy (28 eyes; 31%) were included in the normal group.
The hyporeflective band thickness map (median of 4.3µm and 7.8µm in normal and AMD eyes, respectively) was thicker below and radially symmetric around the fovea. In normal eyes, age-associated differences occurred within 0.7mm to 2.3mm from the foveal center. In AMD eyes, the hyporeflective band was hypothesized to be basal laminar deposits and was thicker within the 3mm ETDRS circle compared with normal eyes. The inner ring was the most sensitive location to detect age vs. AMD-associated changes within the RPE basal lamina/Bruch's membrane complex. AMD eyes with subretinal drusenoid deposits had a significantly thicker hyporeflective band than those without subretinal drusenoid deposits.
“Finer delineation of outer retinal bands will be critical to resolving age-associated changes in RPE cells, photoreceptor outer segments contacting RPE apical processes and deposits between the RPE basal lamina and Bruch’s membrane," the researchers wrote in their paper, which was published in Investigative Ophthalmology & Visual Science.
“Topographic measurement of the hyporeflective band within the RPE basal lamina-Bruch's membrane complex is candidate for an early structural biomarker that may also be associated with rod vision impairment at 3º to 5º, the earliest functional biomarker in AMD,” they suggested.
Won J, Takahashi H, Ploner SB, et al. Topographic measurement of the subretinal pigment epithelium space in normal aging and age-related macular degeneration using high-resolution OCT. Invest Ophthalmol Vis Sci. 2024;65(10):18. |