Glaucoma remains a complicated disease to diagnose, requiring clinicians to correlate and holistically interpret data from numerous aspects of the clinical examination. An additional complexity is the heterogeneity of glaucoma presentations, where part of the difficulty in assessing structure-function concordance may lie in the different retinal areas over which measurements of structure and function are acquired.
Widefield OCT could be clinically useful for these purposes in multiple ways. First, it can help visualize pathologies outside of conventional macular and peripapillary OCT scans, such as diabetic retinopathy and retinal vein occlusion, without the need for additional scanning. Also, researchers are working on OCT-based predictive models that could one day estimate subjective visual experiences. “If we are able to fine-tune the relationship between structure and function, there is the potential to target visual fields assessment to an as-needed basis, which could be beneficial for patients who struggle with visual field testing,” explains Janelle Tong, BOptom, senior staff optometrist at the Centre for Eye Health at the university and lead author of a new study.
 |
|
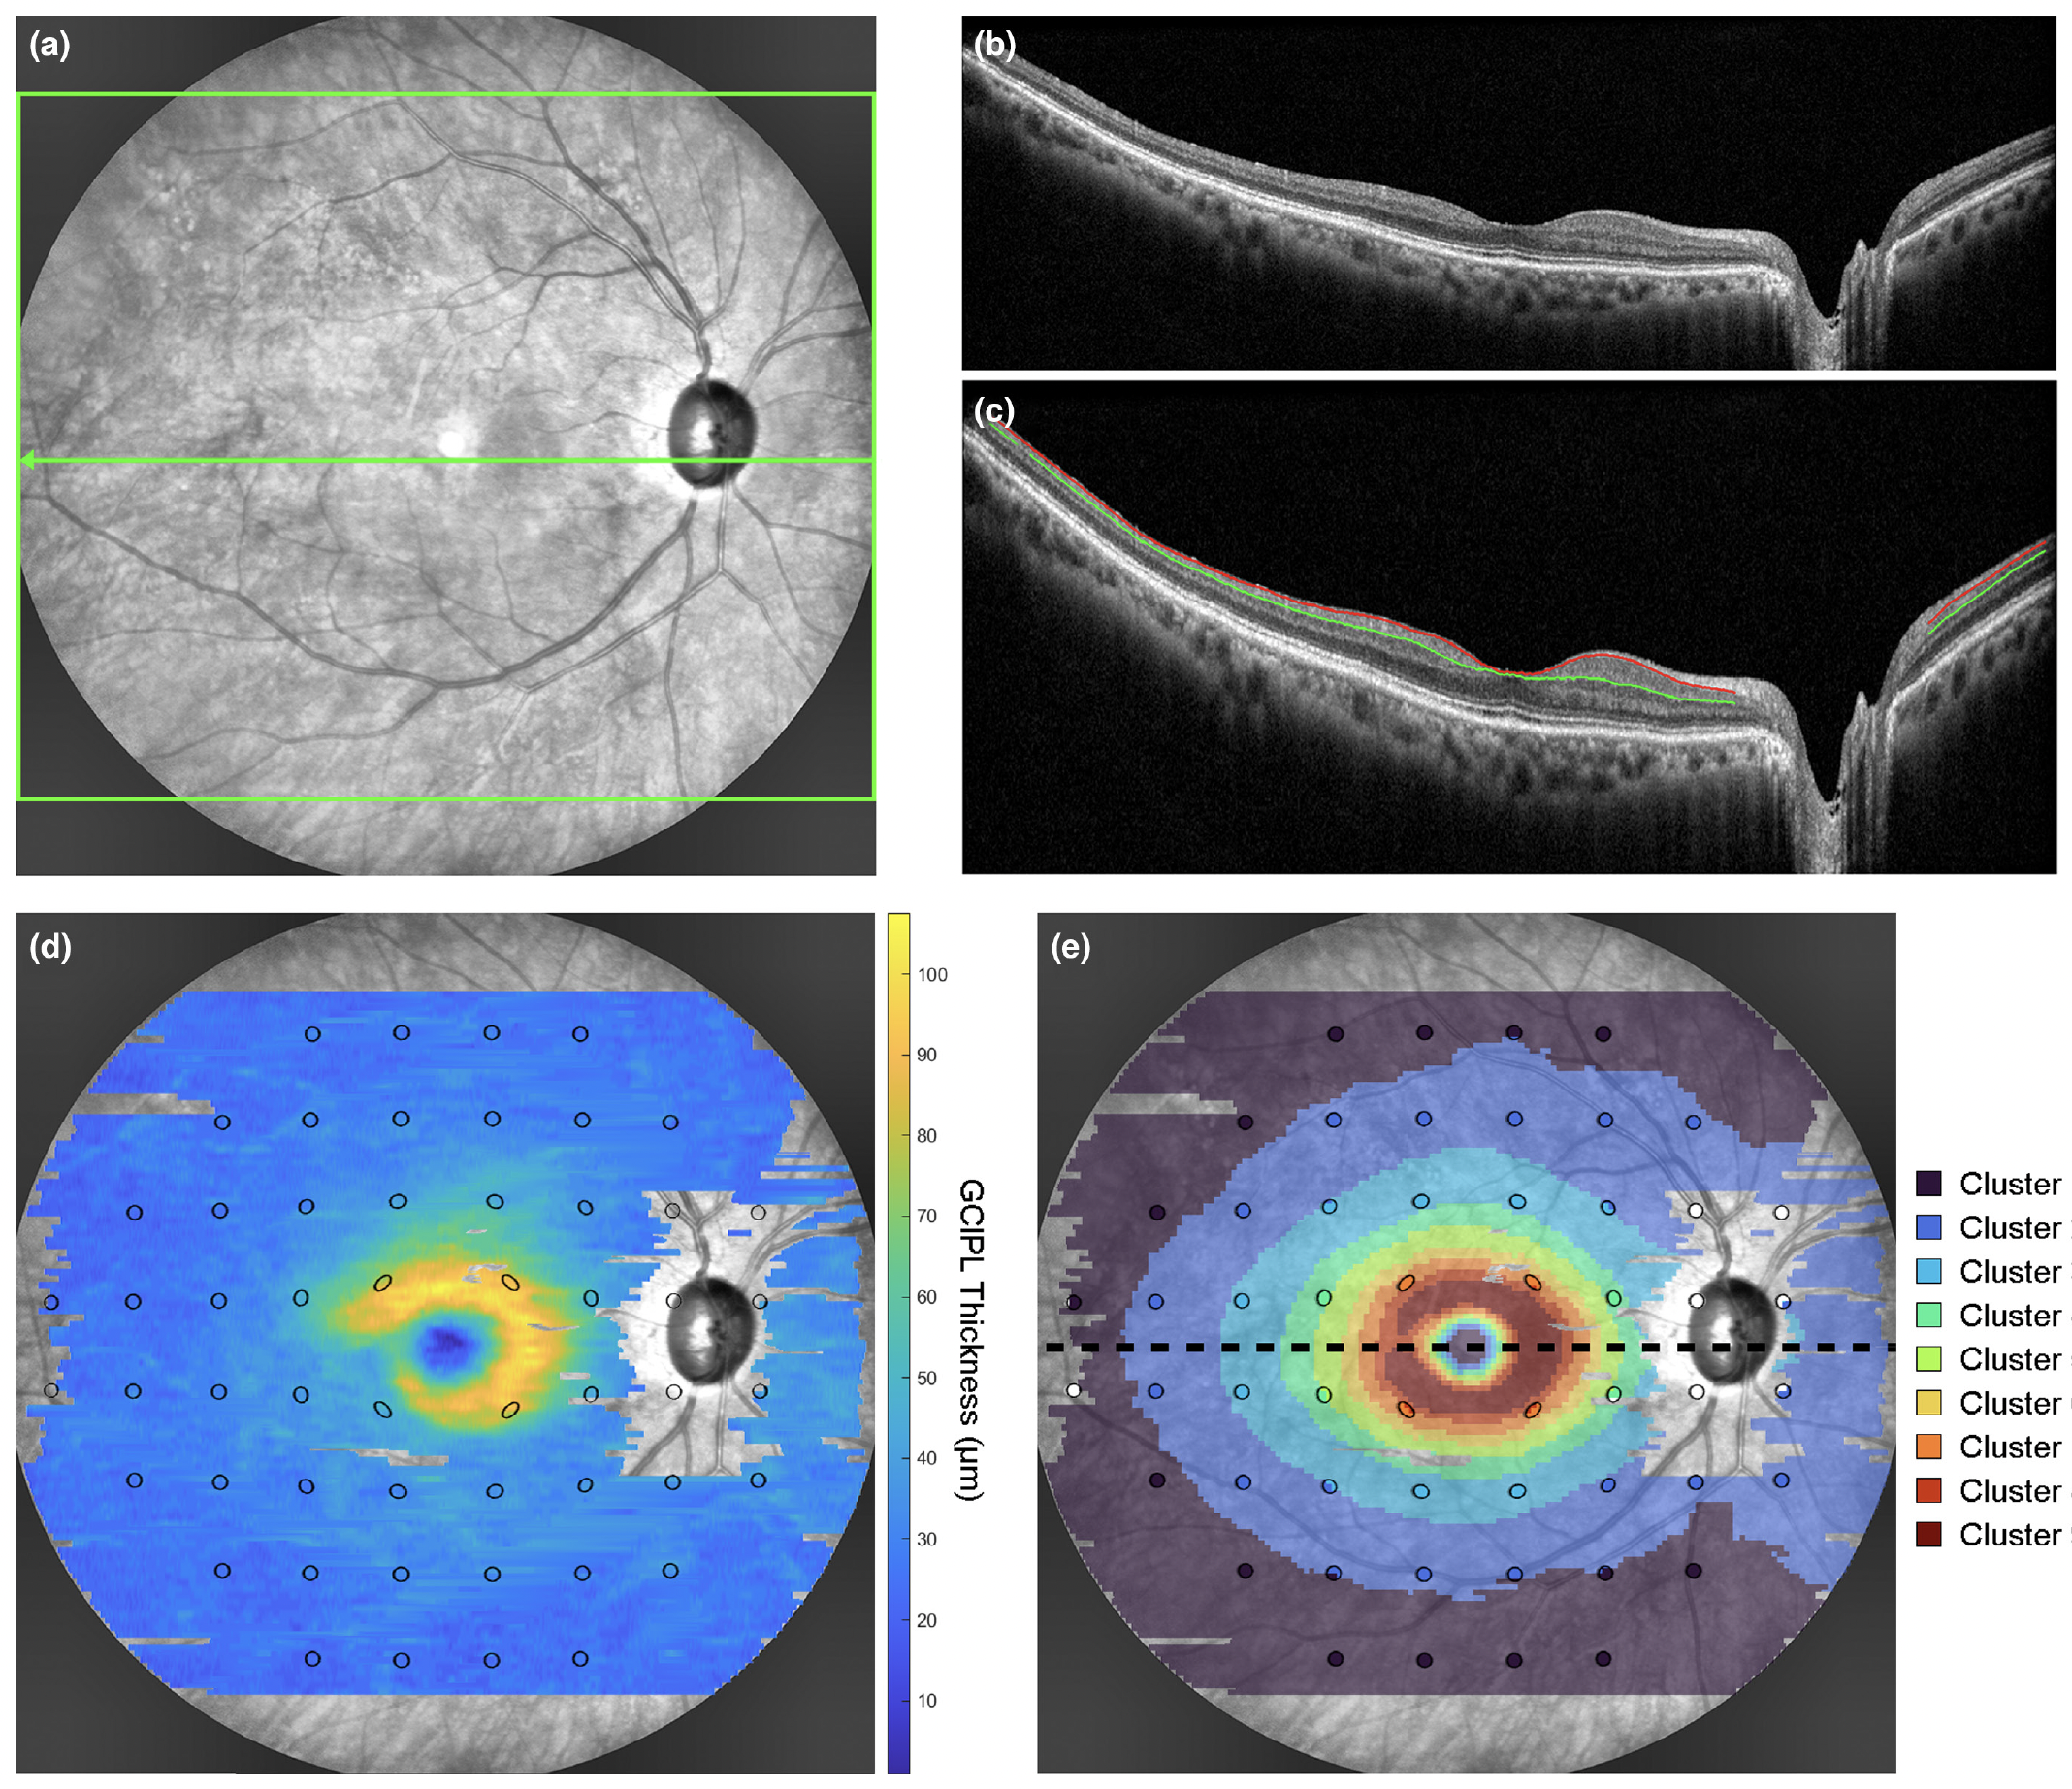
Prediction of VF status based on GCIPL parameters from widefield OCT could become useful to aid clinical decision-making in appropriately targeting VF assessments. This example from the study shows: (a) SLO image with the widefield OCT scan area (green box) and location of the horizontal foveal B-scan (green arrow), (b) the corresponding raw foveal B-scan, (c) the same B-scan with warpage correction applied and segmentation of the RNFL-GC layer (red line) and IPL-INL boundaries (green line) to derive the GCIPL, (d) the GCIPL thickness map across the widefield OCT scan area with 24-2 visual field test locations (black ellipses) superimposed, and (e) the corresponding cluster arrangement describing the spatial pattern of age-related change in GCIPL thickness. Photo: Tong J, et al. Ophthalmic Physiol Opt. July 26, 2024. Click image to enlarge. |
Dr. Tong and colleagues at the University of New South Wales in Sydney used ganglion cell-inner plexiform layer (GCIPL) measurements acquired using widefield OCT scans spanning 55°x45° to explore the link between structural parameters and clinical visual field (VF) data. They noted that quantitative prediction of VF thresholds from widefield OCT is affected by high variability at VF defective locations.
“The relationship between OCT and visual field data is highly complex, especially in the earlier stages of glaucoma,” explains Dr. Tong. “Both have so much inherent variability that a simple side-by-side comparison can be useful in some, but not all, scenarios. However, by analyzing data in a way that addresses some of this variability, we can obtain more consistent agreement between the two.”
Widefield OCT scans from 311 healthy, 268 glaucoma suspect and 269 glaucoma eyes were segmented to generate GCIPL thickness measurements. Estimated ganglion cell counts, calculated from GCIPL measurements, were plotted against 24-2 SITA Faster VF thresholds, and regression models were computed with data categorized by diagnosis and VF status.
Linear regression models between GC counts and VF thresholds demonstrated higher variability in VF defect locations relative to non-defect locations (mean absolute error 6.10db to 9.93dB and 1.43db to 1.91 dB, respectively). Area under the curve values (a measure of the predictive value of a test, with 1.00 being perfect) from GCIPL parameters were similar across methods centrally but significantly greater peripherally, especially when considering classification of more central locations. Across diagnoses, GCIPL parameters demonstrated variable sensitivities and specificities (0.36 to 0.93 and 0.65 to 0.98, respectively), with the highest specificities observed across healthy eyes (0.73 to 0.98).
The persistence of structure-function discordance, as demonstrated by the low sensitivities observed in the glaucoma suspect cohort and low specificities across glaucoma cohorts, suggested that factors in addition to acquisition of co-localized OCT and VF data contribute to this phenomenon.
Still, the study authors noted in their paper for Ophthalmic & Physiological Optics that, “While these results suggest that accurate prediction of VF results may not be possible using the widefield OCT alone, the overall reasonable specificities across all diagnostic categories and high specificities in healthy participants suggest that this approach may be useful to screen for eyes that would benefit from additional VF testing.”
Adding context, Dr. Tong explains that “knowledge of intra- and inter-visit variability is important to understand how reliable widefield OCT is at detecting glaucomatous damage and progression. We are hopeful that future work can help answer these questions to build on our research to date.”
Tong J, Phu J, Alonso-Caneiro D, et al. Exploring the relationship between 24-2 visual field and wide-field optical coherence tomography data across healthy, glaucoma suspect and glaucoma eyes. Ophthalmic Physiol Opt. July 26, 2024. [Epub ahead of print]. |