 |
|
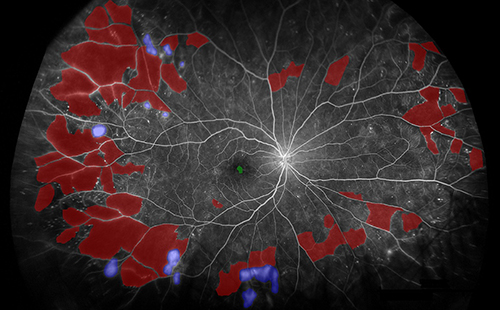
Regular use of UWF imaging during initial diagnosis of DR and for follow-up can allow for more precise grading and monitoring of severity, these authors argue. This image from the study shows segmentation of biomarkers in PDR. Red: nonperfusion, purple: neovascularization. FA images were captured using the Optos 200Tx or California devices in this study and segmented using custom software. Photo: Fleifil S, et al.Clin Ophthalmol. 2024;18:1961-1970. Click image to enlarge. |
While obtaining seven-standard retinal fields is the traditional method for evaluating diabetic retinopathy (DR), ultra-widefield (UWF) imaging allows for improved visualization of peripheral areas to check for nonperfusion and neovascularization, which could be used as biomarkers to monitor and predict progression of DR. The results of a recent 10-year retrospective cross-sectional study on the progression of DR, which was published recently in Clinical Ophthalmology, showed that areas of nonperfusion in the mid and far periphery, as well as areas of neovascularization, strongly correlate with changes in DR severity over time. The duration of a DR diagnosis was associated with a larger total area of nonperfusion and nonperfusion in the far periphery, indicating the potential for using age or years with a DR diagnosis in conjunction with quantitative biomarker measures as a method for monitoring disease progression.
Researchers from the Kellogg Eye Center at the University of Michigan Medical School conducted a retrospective, cross-sectional study on 651 eyes from 363 patients diagnosed with type 1 or type 2 diabetes who received UWF fluorescein angiography (FA) over 10 years. The mean age was 59.4 years, and 43.5% were women. Eyes with proliferative DR were excluded from DR progression analysis. The mean total follow-up time after initial UWF-FA imaging was 915 days.
Increases in assigned DR severity were significantly associated with an increase in peripheral regions of nonperfusion seen on UWF imaging over time. Each additional year with a diagnosis of DR was associated with a 10.75mm2 increase in total nonperfusion and 7.87mm2 increase in nonperfusion in the far-periphery. A one-unit change in severity as defined by the ETDRS classification was associated with a 25.75mm2 increase in total nonperfusion, a 13.15mm2 increase in mid-periphery nonperfusion and a 12.29mm2 increase in far-periphery nonperfusion.
The researchers also found that DR progression is more strongly associated with nonperfusion than neovascularization. For instance, among Black individuals, both total neovascularization and nonperfusion in the far periphery were significantly higher, but the area observed during examination for nonperfusion in the far periphery was over 29 times larger than that for neovascularization (21.73mm2 vs 0.73mm2).
The findings of the current study contribute an additional piece to the utility of quantification in the diagnosis of DR by investigating the relationship between areas of nonperfusion and neovascularization and changes in severity over time. Coupled with the use of UWF to improve our ability to identify markers to track DR progression, biomarker quantification may be the path forward for DR disease classification and monitoring.
“A shift in clinical practice could be made towards regularly screening DR patients with UWF imaging when available and using quantifiable biomarkers in high-risk areas when defining disease,” the study authors wrote. “Moreover, a comprehensive approach considering the type of diabetes, patient age and years since diagnosis should be taken into account during disease diagnosis.”
This study illustrated the direct correlation of these factors with larger areas of nonperfusion and neovascularization, resulting in increased disease severity and a higher probability of progressing to diabetic PDR.
Fleifil S, Azzouz L, Yu G, et al. Quantitative biomarkers of diabetic retinopathy using ultra-widefield fluorescein angiography. Clin Ophthalmol. 2024;18:1961-70. |