Numerous ocular conditions can cause or mimic optic disc swelling, posing diagnostic and treatment challenges for eye doctors. As imaging technology advances, such as with the advent of OCT angiography, research is uncovering new biomarkers to differentiate between potential culprits of the condition. To add to this knowledge, a recent prospective case series, published in Journal of Ophthalmology, used OCT-A to compare the optic disc microvasculature in patients with conditions that lead to optic disc swelling, including active papilledema and acute nonarteritic anterior ischemic optic neuropathy (NAION) to patients with optic nerve head drusen (ONHD)—the most common cause of pseudopapilledema—and healthy controls. They found that decreased vessel density could signal true optic disc edema.
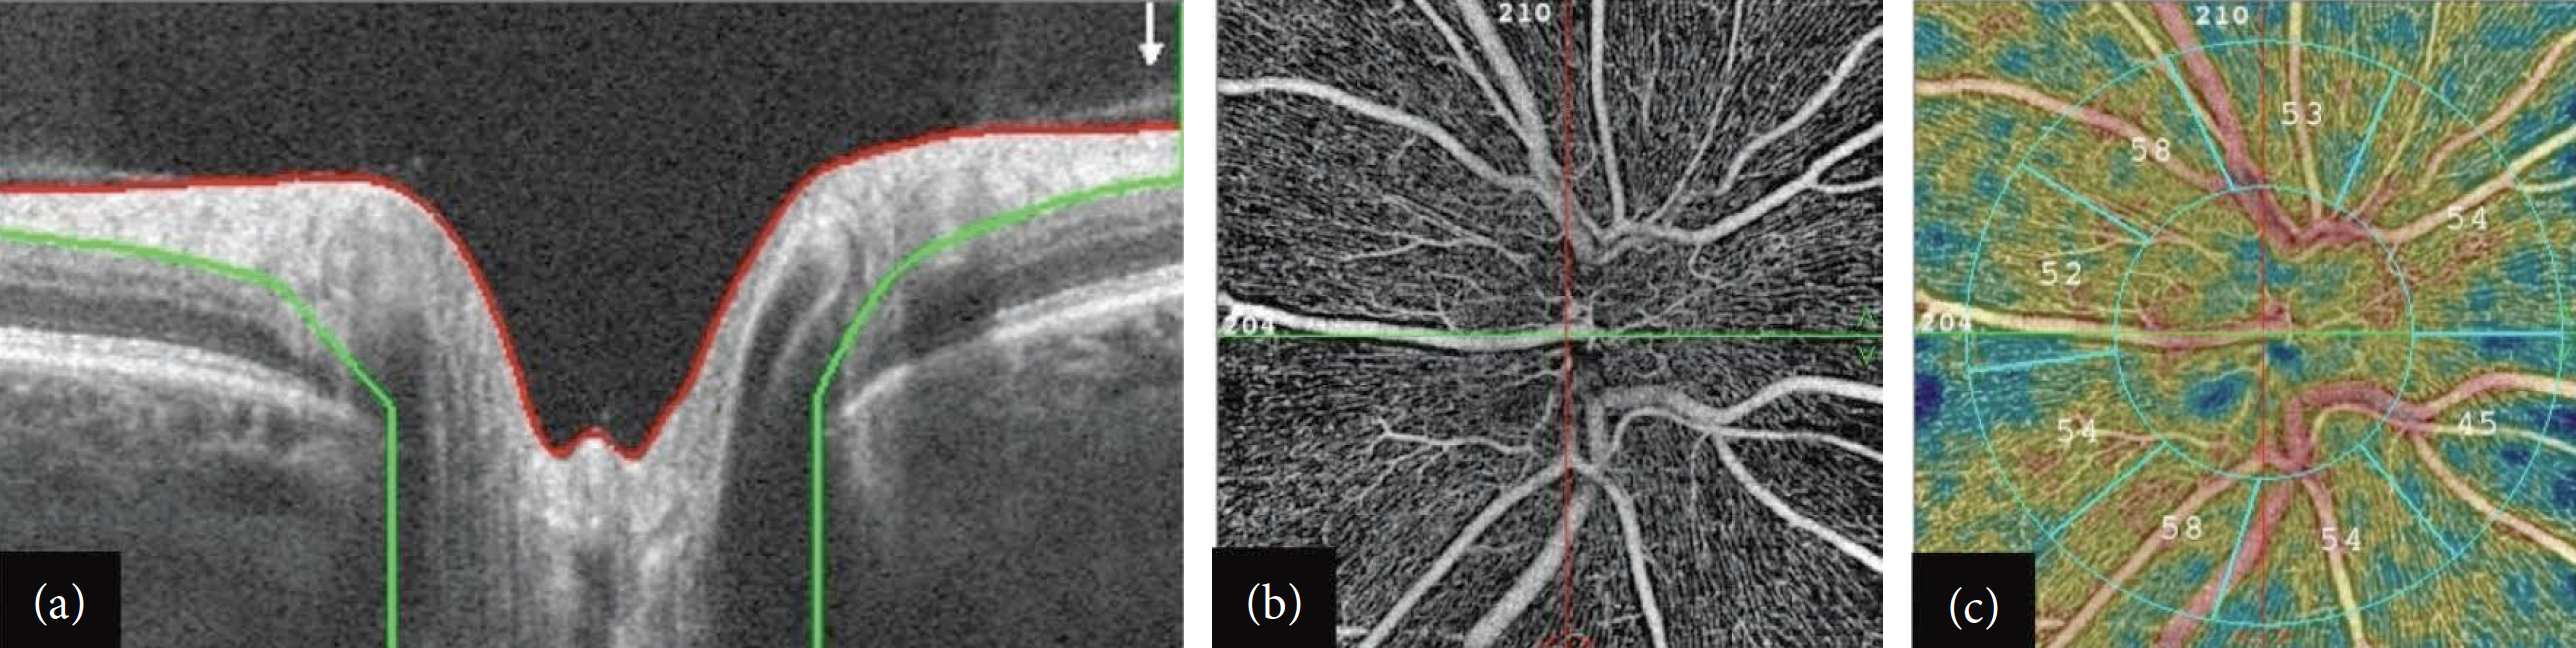 |
| Clinicians should not rely solely on RNFL thickness when assessing optic disc swelling, researchers warn. Rather, vessel density on OCT-A may be a critical parameter in distinguishing between pseudo-optic disc swelling and true edema conditions. This image from the study shows: (a) RNFL segmentation from the ILM (red line) to the posterior boundary (green line); (b) OCT-A scan centered on the optic disc at the level of the radial peripapillary capillary (RPC) slab in a healthy subject; (c) corresponding RPC density measurements in different sectors. After removing large vessel signals, automatic calculations of RPC density are performed in the areas of peripapillary (between the two concentric blue circles) and the whole image in different sectors, expressed in percentages. Photo: Abri Aghdam K, et al. J Ophthalmol. 2024:1164635. Click image to enlarge. |
The study included 16 eyes with ONHD, 31 eyes with active papilledema, 16 eyes with acute NAION and 32 healthy eyes. Optovue AngioVue OCT and OCT-A imaging systems were used to record peripapillary retinal nerve fiber layer (RNFL) thickness and vessel density maps in all subjects.
The results revealed greater average RNFL thicknesses in eyes with ONHD, papilledema and NAION compared to control eyes. The study authors noted in their paper that “differentiating true from pseudo disc swelling based solely on RNFL thickness proved to be challenging.”
Vessel density, on the other hand, could be a more promising biomarker, they suggested. Reduced vessel density could signal true optic disc edema, the findings indicated, as ONHD eyes and controls had significantly greater vessel density than those with NAION or papilledema. There was no difference in mean peripapillary vessel density between the ONHD group and controls, nor between the NAION and papilledema groups.
“In conclusion,” the authors wrote, “peripapillary vascular density is affected during the course of ONHD, papilledema and NAION.” They warned that when using OCT-A to quantify vessel densities, “Manual corrections of misidentification of disc boundaries and segmentation errors of peripapillary vascular layers may reduce artifacts induced by edema during OCT-A imaging in eyes with acute optic disc swelling.”
| Click here for journal source. |
Abri Aghdam K, Aghajani A, Zand A, et al. Application of optical coherence tomography angiography in true and pseudo-optic disc swelling. J Ophthalmol. 2024;2024:1164635. |