One can argue that ophthalmoscopy and OCT are the two landmark developments in observing and diagnosing retinal disorders. Most credit Hermann von Helmholtz with the invention of the ophthalmoscope more than 150 years ago. Today, virtually all eye clinicians perform ophthalmoscopy on all patients. Nearly all forms of fundus photography, including ultra-widefield imaging, accurately capture what we view directly with the ophthalmoscope. In contrast, OCT yields information about retinal anatomy and histopathology that is often entirely invisible to ophthalmoscopy.
The undeniable fact that photoreceptors cannot be observed via ophthalmoscopy exemplifies the importance of OCT. The normal eye has about 120 million rods and six million cones. Histologically, half the retinal thickness is composed of the various components of the photoreceptors. Dr. von Helmholtz, and every subsequent observer, has failed to detect these vital cells with an ophthalmoscope. A patient may lose 100 million photoreceptors, and yet the clinician will document an unremarkable ophthalmoscopic exam. However, as we will soon demonstrate, OCT can reveal a loss of rods or cones or even a complete compromise of all photoreceptors.
Beginning
in October, Review of Optometry will begin publishing a one-page
e-newsletter called The ABCs of OCT, authored by our group at the State
University of New York College of Optometry. Each will include an OCT
scan that illuminates a particular clinical condition. Whenever
possible, we will also include a normal OCT for comparison purposes, as
well as a fundus photo to better elucidate the pathology. It will likely
take just 60 seconds to view the images and read the brief text. The
goal is to help novices and experts alike to better understand OCT’s
capabilities in clinical practice.
Most
installments of the newsletter will link to a Retina Revealed case that
includes many additional images and a more comprehensive discussion.
Information on the relevant technology used in the case will also be
provided.
OCT, especially high-resolution spectral-domain (SD-OCT), permits the visualization of all retinal layers, as well as the vitreous and the choroid. Localization of an abnormal finding to a specific layer of the retina often leads to a diagnosis that would not be otherwise possible. For example, exudates and drusen often look similar with an ophthalmoscope, but can be differentiated 100% of the time with OCT. The technology indicates that exudates are located in the middle of the retina (specifically in or adjacent to the outer plexiform layer), and drusen are located under (or occasionally immediately above) the retinal pigment epithelium (RPE). OCT, only a laboratory curiosity just 20 years ago, is projected to be the new standard of care in both optometry and ophthalmology in the not-too-distant future.
Don’t Miss This Exciting New Offering
The ABCs of OCT, a new e-newsletter to debut in October, will not only cover the fundamentals of OCT technology and its diagnostic interpretation, but will also go beyond the basics. Each brief discussion will focus on a single concept in OCT—with optional links to related images and cases contained in the free Retina Revealed website (
www.retinarevealed.com), which now has 52 educational sessions listed in the case study archive as well as more than 2,200 labeled retinal images.
Using 10 case examples culled from the Retina Revealed archive, this article will introduce some of the key concepts that The ABCs of OCT will elaborate upon on a regular basis.
Start with a Good Foundation
To take full advantage of the remarkable images revealed by SD-OCT, let’s first learn to meaningfully interpret the various lines, layers, contours and shapes in normal eyes. Once the findings in normal eyes are appreciated, the transition to detecting variations in different retinal, choroidal and vitreal abnormalities will be simplified greatly.
SD-OCT scans most often are presented as a cross-section of the retina, which appears as a typical histological slice in anatomy textbooks. By convention, the inner retina is close to the center of the eye—the vitreous—and the outer retina is close to the choroid and sclera. Remember that the outer retina contains the RPE and the photoreceptors, and the inner retina contains the retinal nerve fiber layer (RNFL) and the ganglion cells.
Think of OCT technology’s role as identifying changes in optical density, which are depicted either in color or grayscale. When two adjacent structures demonstrate large differences in their refractive indices, more light is reflected upon their interface. By convention, large reflections are depicted by vivid colors such as red, whereas less reflective structures are depicted in the blue part of the spectrum. Zones without reflections are black or nearly so. Hence, a normal vitreous in a young patient will appear dark or even black.
10 Revealing Cases
Case 1. This SD-OCT section through the fovea of a normal right eye reveals a dozen retinal layers, along with the choroid and posterior hyaloid. Note the marked change in reflectivity between the vitreous and the internal limiting membrane/RNFL complex, which depicts the vitreoretinal interface. The outer and inner nuclear layers appear relatively dark due to the lack of change in optical density, because light traverses the tightly and uniformly packed nuclei. In contrast, the inner and outer plexiform layers show increased reflectivity.
In this instance, the RPE––the outermost of the retinal layers––is labeled as the “RPE complex.” Although the RPE often appears as a single layer, the RPE complex appears to have three relatively distinct layers when viewed at high resolution. As will be illustrated in a future Retina Revealed case, the innermost reflection, previously termed the Verhoeff membrane and more recently described as the inner RPE border (IRB), becomes attenuated early in Plaquenil (hydroxychloroquine, Sanofi) toxicity.
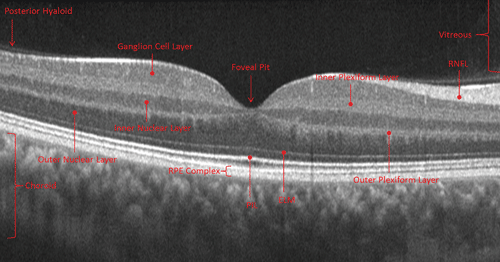
Case 1. High resolution OCT of a normal right eye.
The prominent bright band anterior to (or above) the RPE is labeled the photoreceptor integrity line (PIL) and has had several names over the past decade: Initially it was termed the connecting cilia, then later the junction of the inner and outer segments of the photoreceptors, followed by the PIL and, most recently, as the inner segment ellipsoid.
We prefer the previous designation PIL because it is the biomarker of photoreceptor integrity (both rod and cone); moreover, the term PIL does not limit the usefulness of the concept of a biomarker, regardless of the precise anatomical location, which is subject to debate and change. (By the way, who is going to remember the concept of the “inner segment ellipsoid,” anyway? Just remember the PIL—i.e., the “pill” you take in the a.m. or p.m.) In case 1, the bright PIL has the dark inner segments of the photoreceptors above it and the dark outer segments below it (two layers that are not labeled in this image).
Note that in this cross section of the right eye, the RNFL is thicker on the right side than on the left. This is because of the relatively thick papillomacular bundle, which is the RNFL from the fovea to the optic disc. The zone labeled choroid reveals cross sections through some of the large choroidal vessels. Also note that the posterior hyaloid––most posterior part of the vitreous––is slightly separated from the retina.

Case 2. The absence of the
PIL (photoreceptor integrity line) under the fovea results in a
characteristic hypo-reflective rectangle.
Case 2. Under the fovea, there is an optically empty cavity in the shape of a rectangle. This “foveal cavitation” is due to the absence of the PIL in this location. Because the cones are highly concentrated within the central 1mm of this 6mm section, this eye will have reduced visual acuity andcolor vision.
Even though the fundus exam was normal, the OCT immediately leads to a diagnosis of a dramatic reduction of foveal cones. This can occur in rod monochromatism, cone dystrophy and occasionally in Stargardt’s disease. Note that when the PIL is absent, the external limiting membrane (ELM) is exaggerated; this can be explained by the greater difference in refractive index when the cones are reduced.
(See www.retinarevealed.com case study archive #24 for many more images, differential diagnoses and discussion.)

Case 3. The PIL is present under the macula but fades outside the macula, a pattern characteristic of rod degeneration.
Case 3. In this case, the PIL appears present within the central 1mm to 1.5mm of this 6mm scan, but absent outside of the central zone. The normal PIL correlates with the patient’s 20/20 visual acuity, and the absence of the PIL outside this central zone explains the patient’s symptoms of very poor night vision and limited side vision. The fundus can be normal, such as in retinitis pigmentosa sine pigmento, but the OCT can reveal essentially normal cones with a very reduced number of rods.
(See
www.retinarevealed.com case study archive #25 for many more images, including ultra-widefield FAs, differential diagnoses and discussion.)
Case 4. Here we observe multiple areas of RPE elevation due to drusen of various sizes. Drusen are found in most cases of AMD. The genetic analysis is highly correlated with the patient’s risk of experiencing significant vision loss and can differentiate a risk of 13% (in Macula Risk category 1) to 73% in MR (in category 5) and various risks in the other three categories.
(See www.retinarevealed.com case study archive #27 for many more images, differential diagnoses and discussion of various forms of AMD, and the most recent diagnostic approaches, including genetic testing for the various AMD genes.)
 |
| Case 4. The dome-shaped RPE elevations are due to drusen of various sizes.
|
Case 5. The dots and spots in this OCT are in the middle of the retina, specifically in or around the outer plexiform layer. The location is highly characteristic of exudates––the presence of which provide indirect evidence that blood vessels are leaking. As in this case, diabetes is a commonetiology of such exudates, but myriad other disorders can be the culprit. Note the unmistakable difference of the OCTs in cases 4 and 5. As noted, OCT can differentiate drusen from exudates in 100% of the cases.
(See
www.retinarevealed.com case study archive #44 for many more images, differential diagnoses and discussion of the various etiologies of white dots and spots.)

Case 5. Hyper-reflective dots and spots in and around the outer plexiform layer of the retina are exudates.
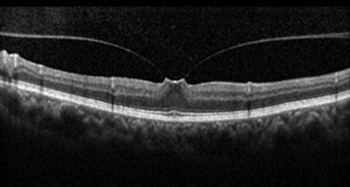
Case 6. A symmetric VMT. Visual acuity is still normal, since the PIL under the fovea is intact.
Case 6. Although often invisible to ophthalmoscopy, vitreomacular traction (VMT) is conspicuously illustrated on this OCT, which can explain the patient’s symptoms of flashing lights straight ahead.
(See www.retinarevealed.com case study archive #6 for many more images and discussion of various forms of VMT and the often associated or eventual finding of a full-thickness macular hole.)

Case 7. This full-thickness macular hole may have been due to a previous VMT.
Case 7. The OCT reveals a full-thickness macular hole as the explanation of the patient’s reduced visual acuity.
(See www.retinarevealed.com case study archive #6 to learn about the relationship between VMT and risk of macular hole formation, plus the new pharmacological approaches to prophylactic treatment of VMT known as vitreolysis.)
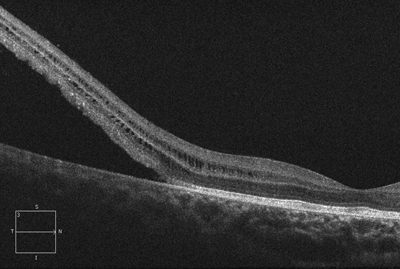
Case 8. A high-resolution OCT of a retinal detachment that requires immediate
treatment, since the macula is threatened.
Case 8. The OCT in this case reveals the separation of the entire neurosensory retina from the RPE temporal to the fovea in this right eye. The VA is still 20/20 because the macula is still attached and the PIL is present. Hence, this is a “macula on” retinal detachment that requires immediate treatment.
(See www.retinarevealed.com case study archives #22 and #26 for many more images, differential diagnoses and discussion of retinal detachment, retinoschisis and both in the same eye.)
Case 9. The OCT reveals multiple splits in the retina of this patient with an optic pit-induced retinoschisis (RS). Visual acuity is reduced because the RS includes the entire macula. Various breaks are visualized. Note the distinctions between retinal detachment (Case #8) and retinoschisis (Case #9) that are made possible by OCT.
(See
www.retinarevealed.com case study archives #4 and #8 for related cases and images.)
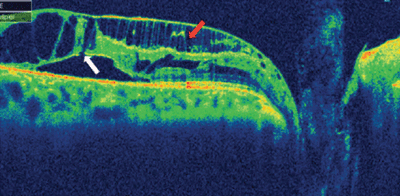
Case 9. Multiple retinal splits in this patient with an optic pit is typical of a macula retinoschisis.

Case 10. The OCT of this patient with central serous choroidopathy reveals a PED and two neurosensory detachments.
Case 10. The OCT reveals an RPE detachment as well as a serous detachment of the neurosensory retina in this patient with central serous chorioretinopathy.
(See www.retinarevealed.com case study archives #3, #20, #39 and #45 for various presentations of this and related disorders.)
Clinicians welcome any new advance that helps to illuminate and better inform our patient care efforts. OCT technology is evolving rapidly, and our diagnostic protocols as well. By staying current, we can benefit to the fullest from its ample capabilities.
Dr. Sherman is a distinguished teaching professor at State University of New York College of Optometry and the Schnurmacher Institute of Vision Research. He also practices at The Eye Institute and Laser Center, New York City, and is vice president of the Optometric Retina Society. Mr. Epshtein is a second-year professional student at SUNY.
