 |
Red disease can confound therapeutic care and, if you’re not careful, result in unnecessary treatment. ‘Red disease’ is the term used when one of the indices of a particular test, most often OCT imaging, falls outside statistical normal limits and is flagged on most printouts (in red). The term implies a finding that falls outside the statistical norm, but that finding is normal for the patient and not indicative of actual disease. Use caution when you see flagged indices of OCT scans as red because their presence does not indicate frank disease; they may, but they also may not. They need to be carefully evaluated.
In Practice
Take, for instance, the case of this mild ocular hypertensive patient. In 2008, she was a 52-year-old with a family history of glaucoma. She presented for a comprehensive evaluation related to refractive changes, but initial scans were normal. But when newer scanning techniques demonstrated what we considered red disease, things got a little clouded.
Her intraocular pressure (IOP) by applanation at that initial visit was 22mm Hg OD and OS, and pachymetry readings were 525µm OD and 522µm OS. Anterior segment evaluations were entirely normal, with well-formed and deep anterior chambers, open angles and normal iris anatomy. Her best-corrected visual acuities were 20/20 OD, OS, OU. Her crystalline lenses were clear OU. Through dilated pupils her cup-to-disc ratio was approximately 0.50 x 0.55 OD and 0.50 x 0.50 OS. The neuroretinal rims were plush and well perfused. Her retinal vascular evaluation was entirely normal, as was her macular and peripheral retinal evaluations. Ultimately, a baseline threshold visual field was obtained, which was reliable and indicated no field defects associated with glaucoma. Baseline OCT measurements were performed and demonstrated no abnormalities in the RNFL scans (Figure 1).
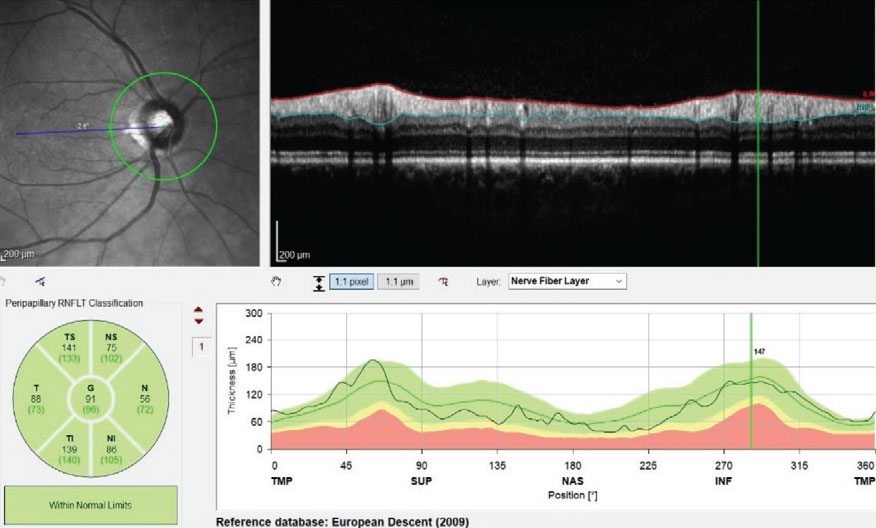 |
| Fig. 1. This image shows an entirely normal RNFL circle scan on initial presentation of the right eye. Click image to enlarge. |
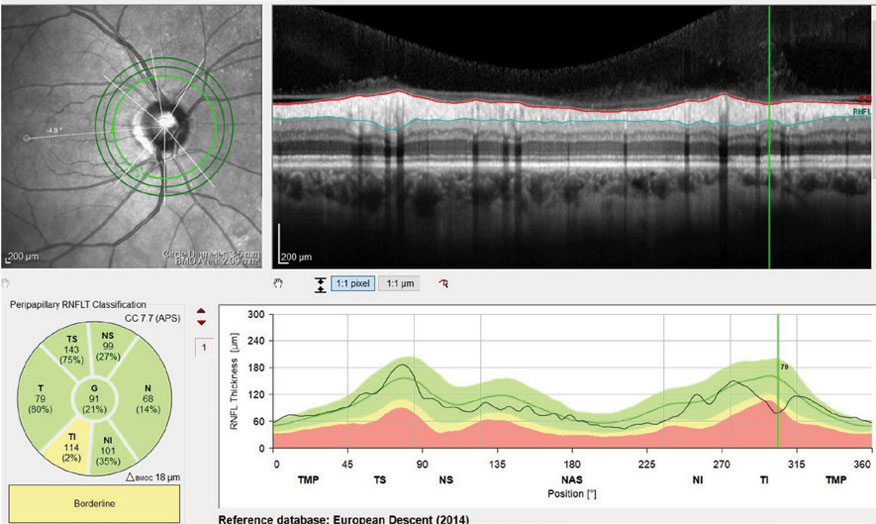 |
| Fig. 2. This scan demonstrates a small area of potentially deceased RNFL thickness in the inferotemporal sector of the patient’s right eye. Click image to enlarge. |
The patient was seen regularly, with periodic OCT scans, visual fields, optic nerve photos and stereoscopic disc evaluations. In all that time, no changes were observed.
Changing Over Time
But, as time when on and technologies improved, a new glaucoma protocol evolved. Her first set of scans using three different diameter retinal nerve fiber layer (RNFL) circle scans, as well as Bruch’s membrane opening (BMO), showed a small sector of the inner RNFL in the right eye that slightly falls outside the normative reference database (Figure 2). In other words, the first indication of red disease. However, this being a new scanning technique, absolute comparison with the earlier scan was not possible.
As time passed, the patient returned for follow-up visits as scheduled. In 2017, a subsequent set of OCT scans was obtained, and, interestingly, revealed a demonstrable change in this inferotemporal segment of the RNFL (Figure 3). Also, a small change could be seen in the BMO scan (Figure 4). These findings indicate that the area of change is more noticeable in the RNFL than in the neuroretinal rim.
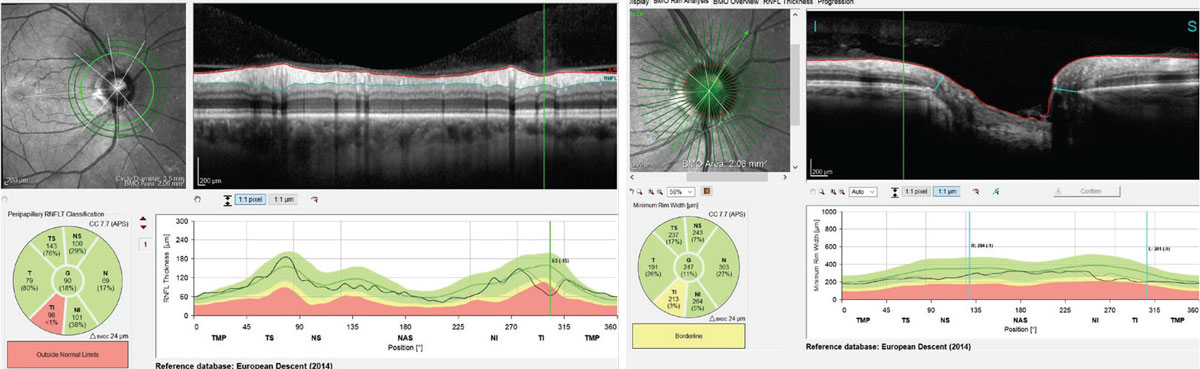 |
| Figs. 3 and 4. Left, this scan demonstrates a loss of 15µm of the patient’s RNFL thickness in the inferotemporally segment. Right, this scan demonstrates a change the inferotemporal neuroretinal rim consistent with the RNFL scans, indicating thinning of the BMO-MRW measurement. Click image to enlarge. |
Interpretation
The ultimate question is whether the difference seen on subsequent scans is real change that represents actual damage or progression. To answer this question, dig deeper into the information available. The deviation maps show aberrations in these same RNFL areas and corresponding ganglion cell layer (GCL), thereby giving a reasonable degree of certainty that the change demonstrated is actual progression of the disease process (Figures 5 and 6). Furthermore, a demonstrable change in the BMO-MRW scans can be seen compared with the characteristics of the neuroretinal rim in Figure 4.
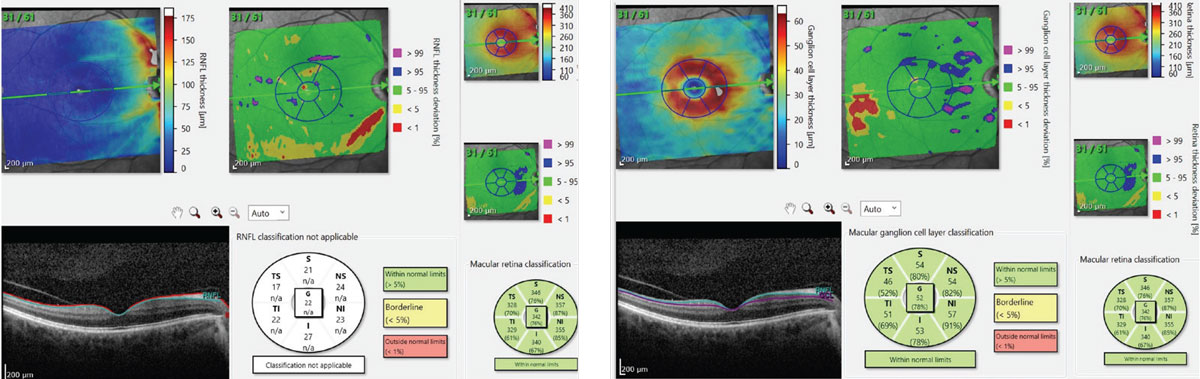 |
| Figs. 5 and 6. At left, this scan shows our patient’s RNFL defect in red in the center top image. At right, the top center image, in red, shows the patient’s GCL deviation map. Note that the location of these ganglion cell bodies is consistent with the location of their axons as seen in the left image. Click image to enlarge. |
Given the reliable change seen in the last set of OCT scans, it is clear that the patient has progressive disease, and therapy was initiated. This case exemplifies several lessons for any ODs who manage glaucoma:
- By far, the hallmark of glaucoma is change over time. If you’re seeing change, you’re most likely looking at progressing disease.
- Just because a finding is outside of normal limits does not mean that it is actual disease. It may be red disease.
- As this case shows, red disease can become real disease—if it changes over time.
- Change may occur first in the RNFL and progress toward the neuroretinal rim, or it may occur first in the neuroretinal rim and then progress outward into the RNFL. Be aware of both possibilities.
- Change may be detected in the macula if your instrument is sensitive enough to discern 3µm to 4µm changes in the GCL thickness.
- Technology changes. The OCT that you have now will be improved upon. Generally that translates into better image information, but not always. Updating your instrumentation is certainly something to consider.
- If you do upgrade your technology, even with the same platform, be careful when comparing new data to old data. Be specifically aware of the nuances of the technologies and software.
- Your old instrument may not show damage, whereas your new instrument may. That requires you to delve deeper in to the nuances of the case and make a determination based on conflicting data. Sometimes that is tough to do, but it may become clearer as time elapses.