43rd Annual Technology ReportCheck out the other feature articles in this month's report:- Is OCT-A Right for My Practice? - Glaucoma: How to Build a Better Baseline - Tighten Your Testing Protocols to Pass an Audit |
When we think about today’s multimodal imaging, we tend to focus on the latest and greatest technology and procedures: optical coherence tomography (OCT), fundus autofluorescence, indocyanine green and fluorescein angiography and fundus imaging—whether traditional, widefield or multicolor. But ultrasonography rarely makes the cut. In a primary care setting, ultrasonography is often reserved as a ‘last-resort’ tool for the evaluation of a patient with opaque media when clinical examination and other light-based imaging techniques fall short.
However, the availability of portable and small-footprint devices—at better prices—have made ophthalmic ultrasound more accessible than ever to a wider group of practitioners.
 |
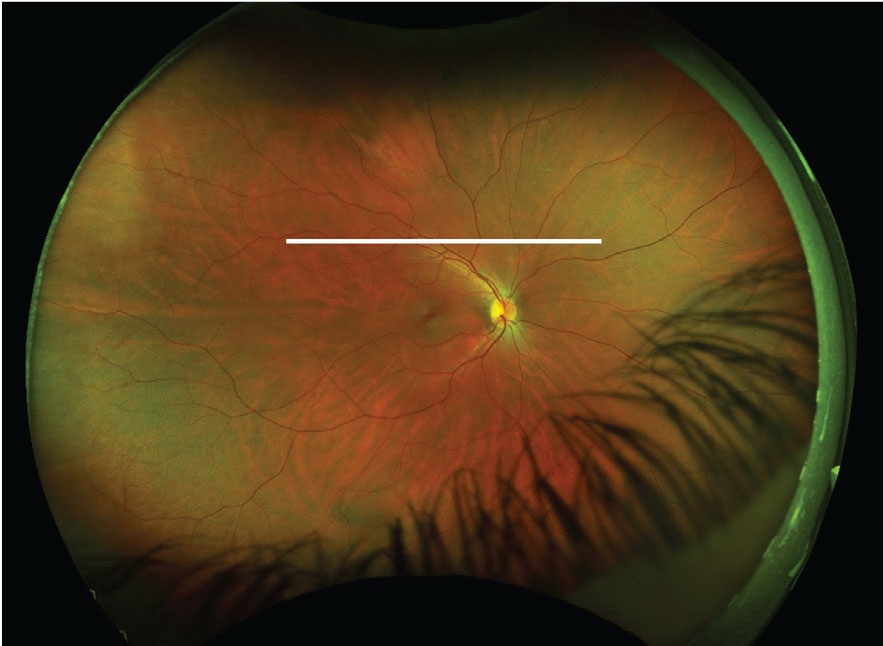
B-scan probe position for transverse scan of 12 o’clock (T12). Note that the manufacturer’s mark on the probe is directed nasally. Click image to enlarge. |
As an ophthalmic imaging modality and therapeutic instrument, ultrasonography’s history is mature, and its applications are wide-ranging.1-8 The tool can be beneficial for evaluating any number of patients, including those undergoing myopia management and those with peripheral retinal/vitreoretinal interface issues, anterior segment concerns, optic disc drusen and choroidal lesions.
Ultrasonography provides additional structural information beyond clinical evaluation and other ancillary testing and can enhance the clinician’s ability to understand ocular pathology, improve referral patterns and comanage complex pathology.1-8
Behind the Scenes
 |
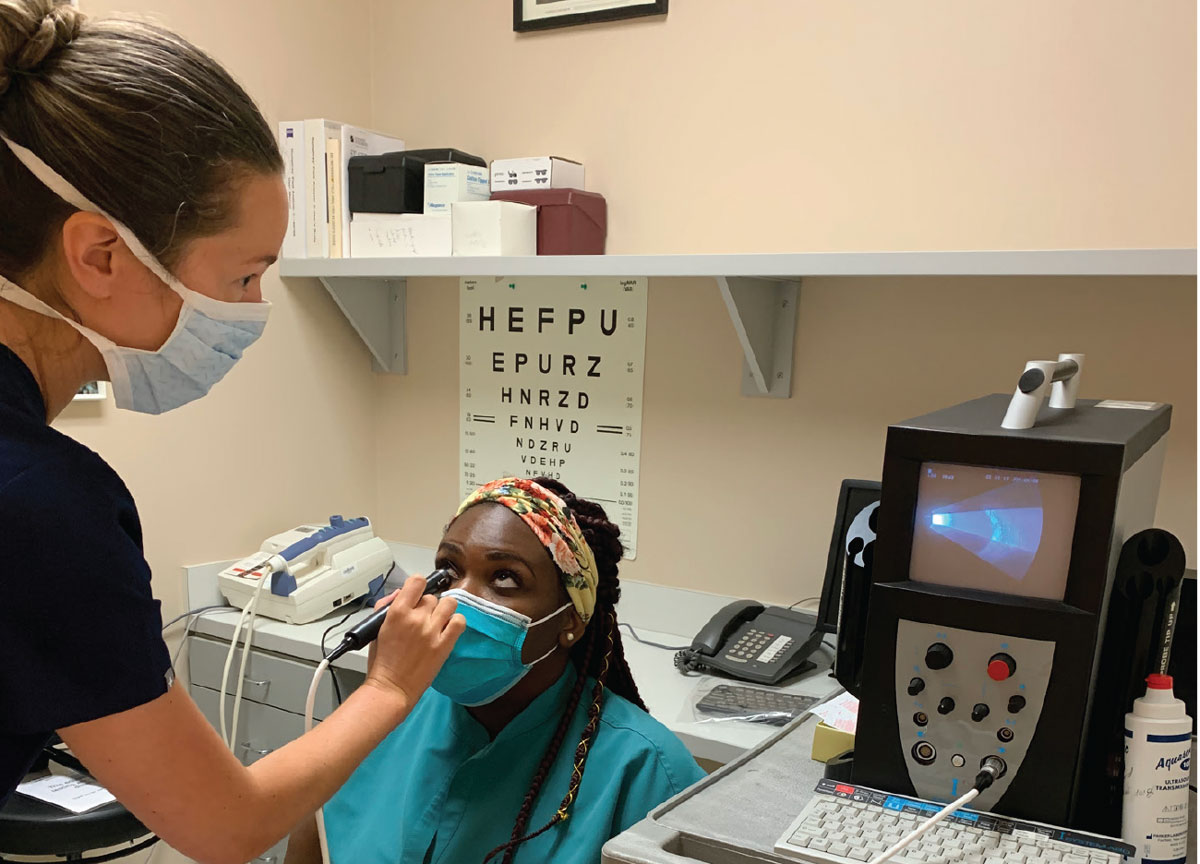
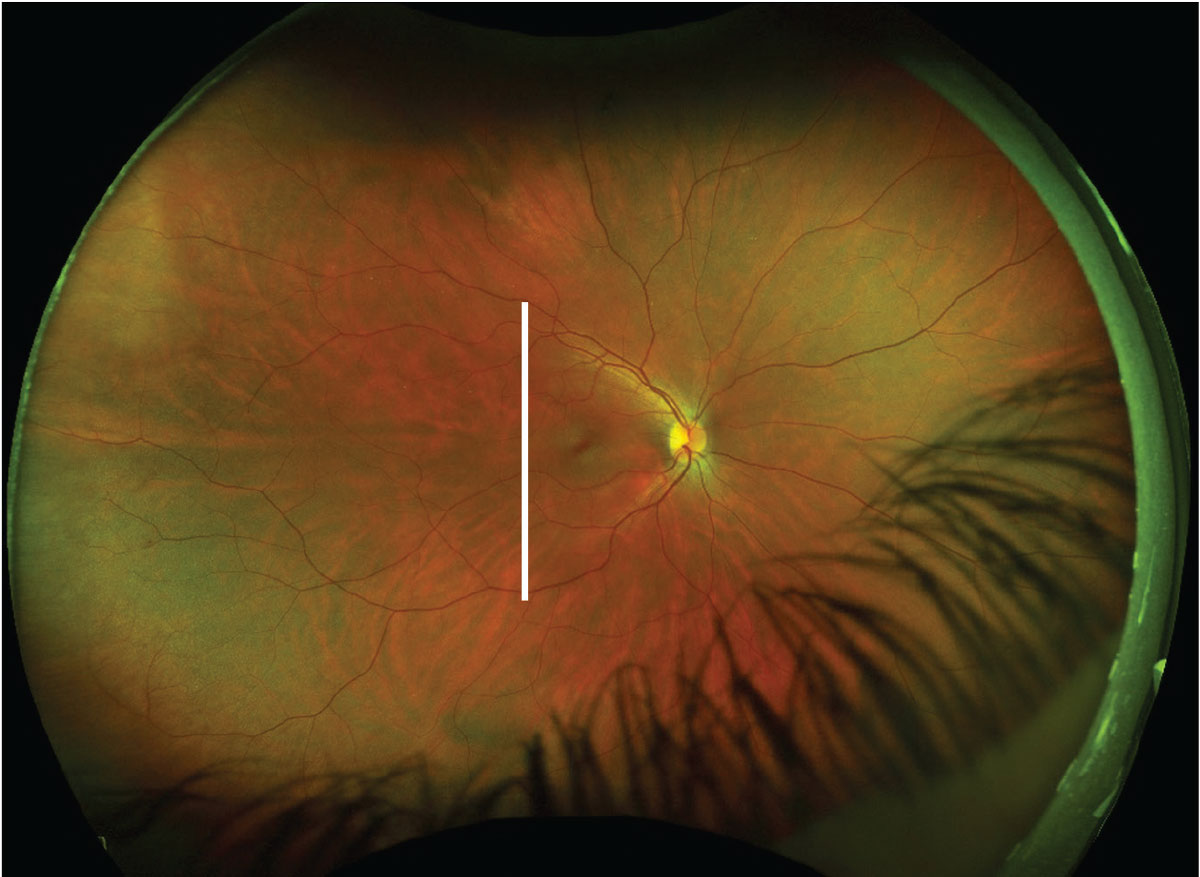
This fundus image has an ultrasound plane overlay for a T12 scan of the right eye (white line). Click image to enlarge. |
Echography (or ‘echo’), the basic principle of ultrasonography, is analogous to OCT—right down to the nomenclature of A- and B-scans.1,2,4 Instead of using optical interferometry and focused, collimated light sources, ultrasonography generates sound waves at frequencies much higher than the limit of human hearing through electrical stimulation of a thin crystal in the tip of an oscillating probe.1,2
These sound waves propagate through tissues and undergo partial reflection back to their starting point each time the wave passes through a material of different acoustic impedance.1,2 When the wavefront returns to the transducer located in the ultrasound probe, it is converted back into electrical energy, where it is amplified and converted to a positive sine wave, which is displayed as an image.1,2
The images produced by ultrasonography are not based on density of a material but rather on the variation of density detected when sound waves pass from one medium to another.1 When two materials are next to each other—water and air, for example—the reflectance of the sound waves at their interface is significant due to the large difference in density between water and air, producing a large acoustic echo.1,4
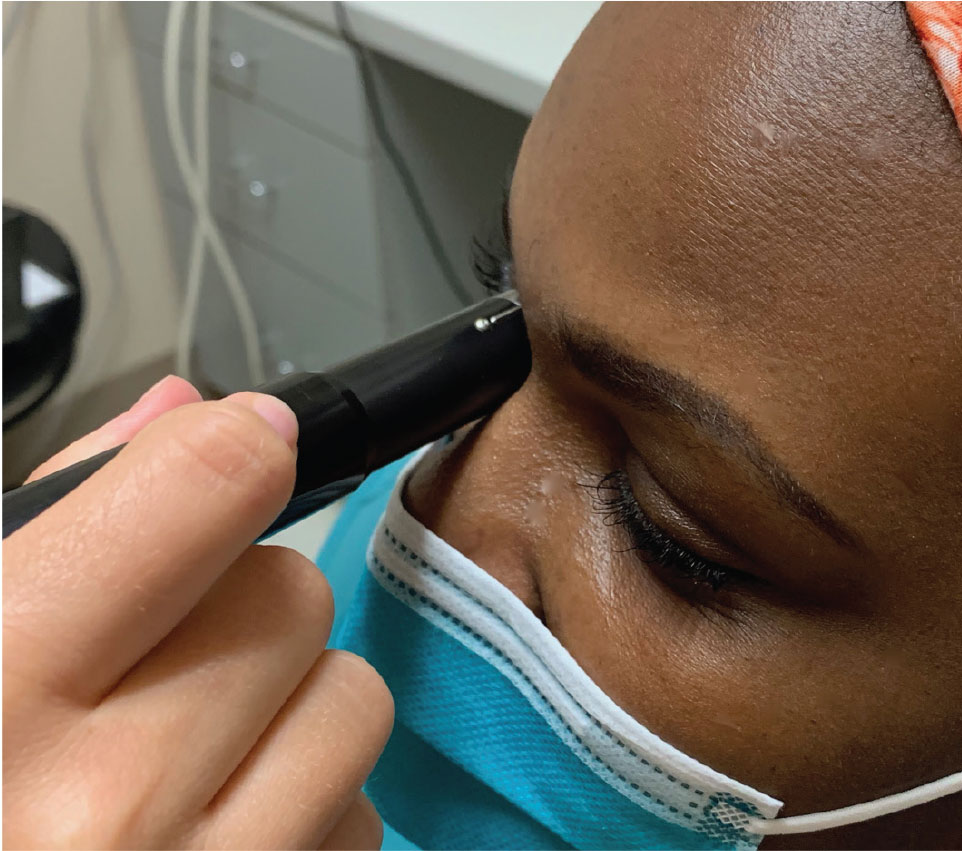 |
Here the clinician is capturing the transverse B-scan of 9 o’clock (T9). The probe is placed over the upper lid with the marker directed superiorly while the patient looks to the right. Click image to enlarge. |
Ultrasonography is often broken down into discussion of A-scans and B-scans. A-scan is most commonly used for corneal pachymetry and ocular biometry, with implications for intraocular lens calculation and myopia management.1,2,4,7 A-scan is a time-amplitude scan. The largest spikes on the graph are produced at the cornea, the front and back surfaces of the lens and the retina.1,4
Axial length measurement is an important metric in myopia management and one many clinicians would consider as standard of care.7 While the risk of vision-threatening complications of myopia, including myopic macular degeneration, retinal detachment, open-angle glaucoma and cataract, is often described in relation to refractive error, it is more accurately characterized by axial length.7
Axial length elongation precedes myopia development and is associated with myopic progression, which makes its measurement valuable information for determining candidacy for myopia control therapies and tracking treatment effectiveness.7 While most of today’s biometers are light or optical-based, they rely on the technology of A-scan biometers, which are still used for patients where media opacities, such as a dense cataract, exist and light-based technologies cannot be used.7
Ultrasound corneal pachymeters operate at significantly higher frequencies than most axial probes, between 20MHz and 50MHz, which provides the high resolution necessary to accurately determine corneal thickness.1,4 The chief drawback of ultrasound pachymetry is the concern of over-estimation of corneal thickness measurement if the probe is placed outside of the corneal center, or at any angle other than completely perpendicular to the corneal surface.1
For the most part, the use of diagnostic A-scan is limited to a small number of academic-based centers and ocular oncology practices.1,4 For patients with choroidal tumors, the addition of diagnostic A-scan aids in evaluation of tumor features, including internal acoustic features, and evaluation of the extent of extrascleral extension.8-10
B-scan complements A-scan as it provides a two-dimensional map of orbital and intraocular tissue.1,4 When we think of orbital ultrasonography, contact B-scan is typically the technique we have in mind.
Ultrasound has a wide range of clinical indications. For example, following examination of a patient with ocular discomfort or pain, clinicians can use ultrasonography to help confirm a diagnosis of scleritis, orbital myositis or dacryoadenitis.1,3
Clinicians can use ultrasonography to evaluate retrobulbar tissue, including the extraocular muscles, in a patient with exophthalmos and suspected soft tissue expansion secondary to Graves’ disease.1
 |
This fundus image includes an ultrasound plane overlay for a T9 scan of the right eye (white line). Click image to enlarge. |
The device can help differentiate between vitreous membranes and retinal detachment because of the differences in reflectivity and inherent variations in patterns of movement with eye motion.1,3 The vitreous has low reflectivity and tends to be much more mobile compared with the retina, which is highly reflective and undulating when detached.1 Overlaying an A-scan onto a B-scan can help to highlight the differences in internal reflectivity of the area of interest from surrounding tissue.1
Clinicians can use ultrasonography to evaluate eyes with vitreous opacity, including hemorrhage, inflammation and phthisis, for retinal integrity and to identify the presence of intraocular mass lesion and foreign body. Ultrasonography features have important diagnostic and prognostic significance for retinal and choroidal lesions such as retinal or choroidal hemangioma, choroidal nevi, melanoma, osteoma and sclerochoroidal calcification.1,3,8-10
How to Use
The goal of contact B-scan ultrasonography is to reconstruct the globe into a three-dimensional image using multiple two-dimensional B-scans. While there are many approaches and individual methods to the examination, the key is to ensure a methodical, repeatable approach to evaluating the entire posterior segment and globe.
As a kinetic test, the clinician is evaluating the patient in real-time, which allows visualization of vitreoretinal traction and helps to differentiate between vitreous, retinal and choroidal membranes due to inherent differences in movement of the tissue as the patient changes their gaze.1 By having a clear understanding of the exam technique and the spatial awareness that comes with it, clinicians can successfully identify subtle pathology.1
One of the most common methods for evaluation uses a series of five B-scans referring to clock hours. Four dynamic transverse scans and one static longitudinal scan are used to reconstruct the posterior segment and orbit.1
The advantage of using transverse and longitudinal scans compared with an axial scan is that the scans bypass the lens. Just as the lens refracts and reflects incoming light, it also reflects sound waves. By not aiming the probe through the center of the lens, clinicians can image orbital structures with the highest resolution and best image quality possible.1,12
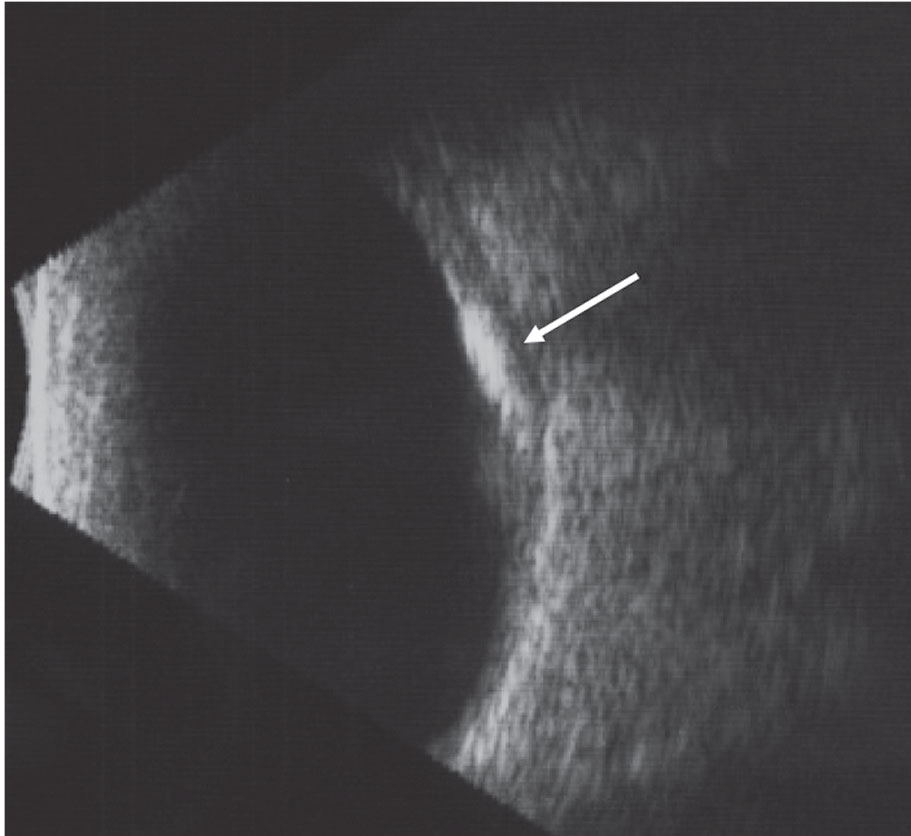 |
This B-scan image of choroidal osteoma highlights the high internal reflectivity of the lesion and the acoustic shadowing posterior to the lesion. Click image to enlarge. |
Typically, contact B-scan images are acquired through the patient’s eyelid; however, to avoid the slight attenuation of signal as the wavefront passes through the lid, the probe may be placed directly onto the conjunctiva following instillation of topical anesthesia.1,4 Rather than asking the patient to close their eyes, which can make it difficult for a patient to maintain fixation and for the clinician to know exactly where the probe is placed in relation to the limbus, the scan can be performed over the upper or lower eyelid, with the patient’s eyes open.1
It’s helpful to begin with the device’s gain at its maximum level to allow for evaluation of lesions producing a weak signal, such as posterior vitreous detachment or vitreous opacities. By lowering the gain, the details of more overt lesions, such as intraocular mass lesions, will be more apparent. Adjust the gain, either higher or lower, to maximize the quality of the image of the lesion.1
To orient yourself, think of the globe and orbit with clock hours superimposed: for the right eye, 12 o’clock refers to the superior globe and orbit, 3 o’clock to the nasal quadrant, 6 o’clock to the inferior quadrant and 9 o’clock to the temporal quadrant. To perform a transverse scan, the manufacturer’s marking on the probe should be placed perpendicular to the quadrant being imaged: nasally for evaluation of the superior (T12) and inferior (T6) quadrant and superiorly for nasal (T3) and temporal (T9) quadrants. For evaluation through the macula and optic nerve using a longitudinal scan (L9), direct the marker toward the center of the pupil. The marking denotes what is displayed at the top of the display screen.1
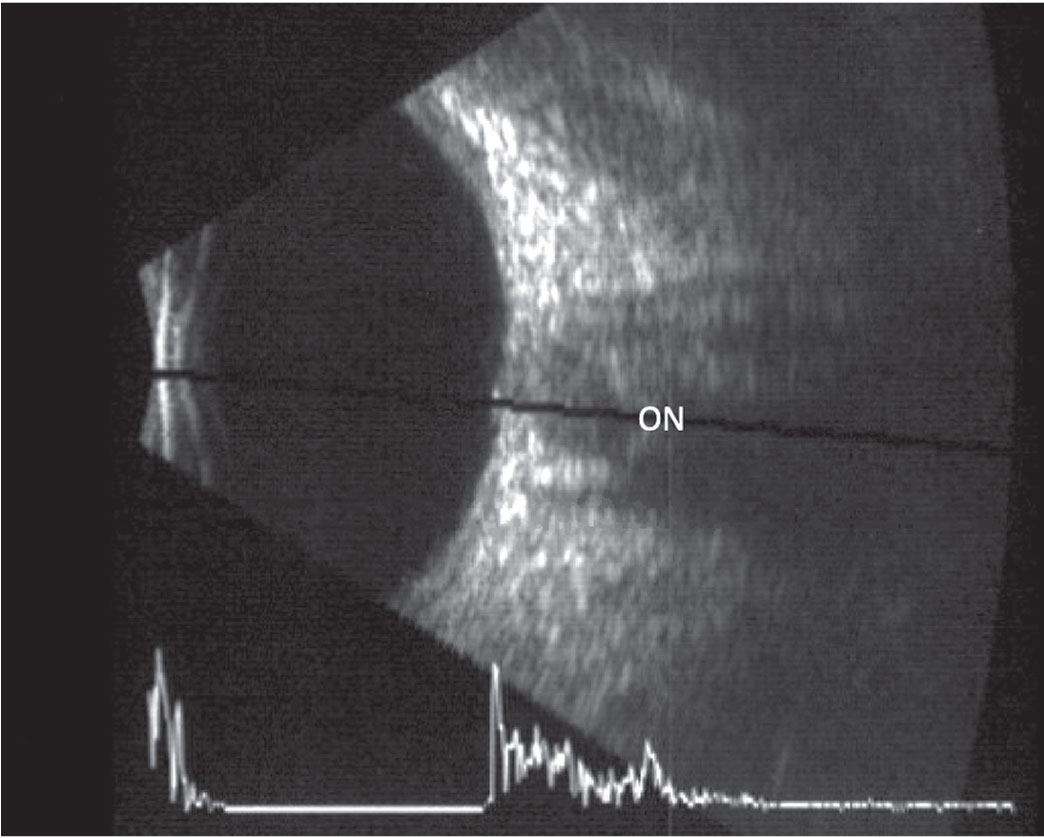 |
This B-scan image of a longitudinal scan includes an overlaid A-scan. The optic nerve is located in the center of the scan. Click image to enlarge. |
To evaluate the superior globe (T12, transverse superior), prepare the probe by applying a methylcellulose-based or oil-based coupling solution. Have the patient look up and then place the probe, marker nasally, on the inferior aspect of the conjunctiva near the limbus (over the lower eyelid). This will give you a cross-sectional image of the globe at approximately the level of the optic nerve head. Then, sweep the probe toward the inferior fornix for examination of the anterior globe.
This technique provides evaluation through many clock hours of the superior globe, as well as anterior and posterior to the equator, from superior nasal at the top of the image to superior temporal at the bottom of the image, with the area of interest (the 12 o’clock position) located at the center of the image.1
To evaluate the nasal aspect of the right eye (T3, transverse nasal), have the patient look to their left and place the probe over the top lid on the temporal aspect of the conjunctiva with the manufacturer’s mark directed superiorly. This captures an image straight across the globe. Again, sweep the probe towards the fornix to evaluate structures anterior to the equator. The top of the image corresponds to superior nasal and the bottom of the image corresponds to inferior nasal.1
After evaluation of the superior, inferior, nasal and temporal quadrants, the final scan of the five-scan approach, L9, is a longitudinal scan through the macula and optic disc performed with the mark directed towards the center of the pupil.
For evaluation of the right eye, the patient looks to their right with the probe placed on the upper lid over the nasal conjunctiva, with the marking on the probe directed temporally. Remember that the optic disc is approximately 5° higher than the fovea anatomically, and as the fovea will only be identifiable by ultrasonography if it is edematous, the optic nerve is a more reliable reference point.1
It can be challenging to understand what each image represents when piecing the two-dimensional B-scan images together to reconstruct the globe and orbit in three dimensions. Clinicians should first practice on eyes with clear media and no pathology to develop the spatial awareness of reconstructing the globe using ultrasonography.
Optic Disc Dilemmas
For patients with optic disc elevation on clinical examination, differentiation between papilledema and other causes of optic disc elevation, such as optic disc drusen and anomalous optic disc, is crucial to ensure appropriate and timely intervention when needed. It also avoids unnecessary, invasive and costly testing in healthy patients.12,13
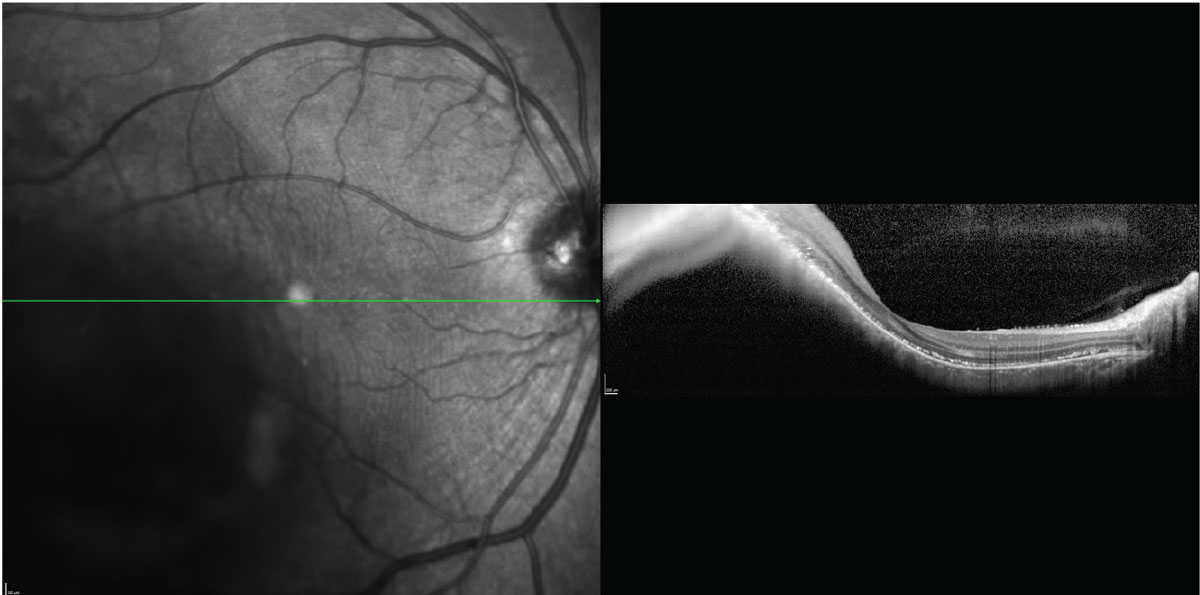 |
The inversion of the OCT B-scan image through a choroidal melanoma limits its utility in measuring lesion thickness. Click image to enlarge. |
Ultrasonography is the standard in the diagnosis of optic disc drusen, which are identified by the presence of hyperreflective material at the level of the optic nerve head when the gain is reduced.12 On ultrasonography, the calcific drusen represent a significant change in acoustic impedance from surrounding tissue, producing a significant hyperechoic signal.12,13
In patients with elevated intracranial pressure causing bilateral optic disc elevation, evaluation of retrobulbar structures can help guide the need, and timeliness, for further evaluation.13 Optic nerve sheath diameter varies with cerebral spinal fluid (CSF) pressure: as CSF pressure increases, optic nerve sheath diameter increases.14
Rapid and noninvasive evaluation of optic nerve sheath diameter using ultrasonography is highly sensitive for identification of elevated intracranial pressure.14 Measuring 3mm behind the optic nerve, an optic nerve sheath diameter of 5.9mm or greater is highly suspicious for elevated intracranial pressure.14
In addition, the presence of the 30° sign—a reduction of retrobulbar optic nerve sheath diameter on ultrasonography when the patient changes gaze from primary to 30° eccentric gaze—is highly sensitive (90%) in the diagnosis of elevated intracranial pressure in a cohort of patients evaluated for optic disc edema; lumbar puncture has a similar sensitivity.15 While the presence of the 30° sign is highly sensitive, due to its modest positive predictive value and low specificity, individuals with a positive result require further diagnostic testing.15
Because the image quality and interpretation often depend on the echographer, diagnostic sensitivities presented in the literature for specific conditions and diagnoses vary significantly. Diagnostic sensitivity is especially high in large trials performed in academic centers or ocular oncology practices that employ trained ultrasonographers. In clinical practice, clinicians can expect significantly lower diagnostic sensitivity that is highly dependent on training and experience.
Oncology Applications
There is no ophthalmic specialty more reliant on the art and science of ultrasonography than ocular oncology. The Collaborative Ocular Melanoma Study, a long-term, multicenter group of randomized, controlled clinical trials, established ultrasonography as a standard of care in evaluation of ocular melanoma and nevi.8 More recently, researchers have used ultrasonography to identify lesion-based risk factors for prognosis and survival.9,10
Clinical risk factors of choroidal nevi, which increase the likelihood of progression to choroidal melanoma, are encompassed in the most recent mnemonic: “To Find Small Ocular Melanoma Doing IMaging (TFSOM-DIM).”9 While OCT, fundus autofluorescence and fundus imaging parameters are used for identification of overlying subretinal fluid, lipofuscin or orange pigment and tumor diameter >5mm, ultrasonography is still a mainstay in the contemporary evaluation of choroidal lesions for the identification of thickness >2mm, lesion configuration (i.e., flat or dome-shaped) and hollow echogenicity of melanoma.9
For each 1mm increase in thickness of choroidal melanoma, as measured by ultrasonography, the risk of metastatic disease at 10 years increases by 5%.11 Therefore, early diagnosis and detection of choroidal melanoma is crucial for prognosis and survival.11
Enhanced-depth imaging OCT (EDI-OCT) is designed to improve the detail of choroidal lesions, including choroidal nevi and melanoma.9,11 While EDI-OCT provides a higher resolution image than ultrasonography and is commonly used as part of the choroidal nevus or melanoma evaluation, EDI-OCT thickness cannot be used in place of thickness measured by ultrasonography when discussing prognostic significance of lesion thickness as identified in the literature.11
Research shows small choroidal melanoma thickness was 55% less when measured by EDI-OCT compared with ultrasonography.11 This has significant clinical implications because the 2mm thickness ‘tipping point’ for which a clinician should be suspicious of small choroidal melanoma or the risk of progression to choroidal melanoma is based on ultrasonography thickness measures, not EDI-OCT thickness measures.8-10 The significant difference in these tumor thickness measurements may be due to the differences in resolution between the two devices, as ultrasonography may incorporate retinal or scleral tissue with imprecise identification of tumor margins.11
As tumor thickness increases, ultrasonography plays an even more critical role in lesion evaluation because EDI-OCT is unable to accurately measure thick choroidal melanoma due to image inversion.11
Take It Higher
Ultrasound biomicroscopy (UBM) is a high frequency B-scan with frequency up to 100MHz is analogous to what corneal pachymetry is to the A-scan.4,16 High frequency images provide increased resolution, but have an exponential increase in absorption, which limits evaluation to the anterior segment.4,16 UBM is most frequently used to evaluate iris and ciliary body cysts and tumors and to evaluate plateau iris syndrome.1,16 The transducer is submerged in a water-filled bubble tip which is placed directly in contact with the eye, following administration of topical anesthesia.16
Looking Ahead
Advancements in ultrasound technology aim to expand its therapeutic role beyond ablative procedures, including cyclodestructive procedures.4,6 Diagnostic ultrasonography uses very low energy to ensure no tissue alteration; however, by increasing the energy applied through an ultrasound probe, therapeutic effects can be reached.5,6
Ongoing research uses high frequency ultrasound to temporarily increase the permeability of ocular barriers to improve medication bioavailability; however, finding a balance between tissue alteration to improve topically applied medication penetration and tissue destruction is crucial.5,6
Challenges to employing ultrasonography are typically related to the clinician’s familiarity with the technique and comfort level with image interpretation. While highly-trained, highly-skilled echographers are true experts in the art of acquiring and interpreting images, an understanding of the basic technique of performing the scan and interpreting its results are still quite useful in clinical practice.
In a time of profound technological advancement in optometry and ocular imaging, orbital ultrasonography has often been relegated to a niche/ancillary test. With improved affordability of available ultrasonography systems, now is the time to embrace the many applications of ultrasonography to best serve your patients.
Dr. Steen is an attending optometrist and assistant professor of ocular pharmacology at Nova Southeastern University College of Optometry.
1. Singh AD, Hayden BC. Ophthalmic ultrasonography. Philadelphia: Saunders: 2012. 2. Dessi G, Lahuerta EF, Puce FB, et al. Role of B-scan ocular ultrasound as an adjuvant for the clinical assessment of eyeball diseases: a pictoral essay. J Ultrasound. 2015;18:265-77. 3. Scott IU, Smiddy WE, Feuer, et al. The impact of echography on evaluation and management of posterior segment disorders. Am J Ophthalmol. 2004;137(1):24-9. 4. Silverman RH. Focused ultrasound in ophthalmology. Clin Ophthalmol. 2016;10:1865-75. 5. Lamy R, Chan E, Lee OT, et al. 880 kHz ultrasound treatment for drug delivery to the vitreous humor. Am J Trans Res. 2018;10(10):3162-70. 6. Aptel F, Lafon C. Therapeutic applications of ultrasound in ophthalmology. Int J of Hyperthermia. 2012;28(4):405-18. 7. Haarman AEG, Enthoven CA, Tideman JWL, et al. The complications of myopia: a review and meta-analysis. Invest Ophthalmol Vis Sci. 2020;61(4):49. 8. Collaborative Ocular Melanoma Study Group, Boldt HC, Byrne SF, et al. Baseline echographic characteristics of tumors in eyes of patients enrolled in the Collaborative Ocular Melanoma Study: COMS report no. 29. Ophthalmology. 2008;115(8):1930-97. 9. Shields CL, Dalvin LA, Ancona-Lezama D, et al. Choroidal nevus imaging features in 3806 cases and risk factors for transformation into melanoma in 2355 cases. The 2020 Taylor R. Smith and Victor T. Curtin Lecture. Retina. 2019;39(10):1840-51. 10. Shields CL, Dalvin LA, Yu MD, et al. Choroidal nevus transformation into melanoma per millimeter increment in thickness using multimodal imaging in 2355 cases: the Wendell L. Hughes lecture. Retina. 2019;39(10):1852-60. 11. Shields CL, Kaliki S, Rojanaporn D, et al. Enhanced depth imaging optical coherence tomography of small choroidal melanoma: comparison with choroidal nevus. Arch Ophthalmol. 2012;130(7):850-56. 12. Rajagopal R, Mitchell E, Sylvester C, et al. Detection of optic disc drusen in children using ultrasound through the lens and avoiding the lens-point of care ultrasound technique of evaluation revisited. J Clin Med. 2019;8(9):1449. 13. Carter SB, Pistilli M, Livingston KG, et al. The role of ultrasonography in distinguishing papilledema from pseudopapilledema. Eye (Lond). 2014;28(12):1425-30. 14. Ohle R, McIsaac SM, Woo MY, et al. Sonography of the optic nerve sheath diameter for detection of raised intracranial pressure compared to computed tomography: a systematic review and meta-analysis. J Ultrasound Med. 2015;34(7):1285-94. 15. Kyung SR, Wall P, Hayden B, et al. The accuracy of the 30 degree test in detecting increased intracranial pressure when compared to CSF opening pressure on lumbar puncture. Invest Ophthalmol Vis Sci. 2013;54(15):2314. 16. Wang D, Pekmezci M, Basham RP, et al. Comparison of different modes in optical coherence tomography and ultrasound biomicroscopy in anterior chamber angle assessment. J Glaucoma. 2009;18(6):472-78. |