Her systemic meds include hydrochlorothiazide, potassium, Lunesta (eszopiclone, Sunovion Pharmaceuticals) and Lyrica (pregabalin, Pfizer), and she reported no known allergies to medications. She had started a slow taper of the Lyrica as her postherpetic neuralgia (no cranial nerve or ocular involvement) began to wane.
 |
|
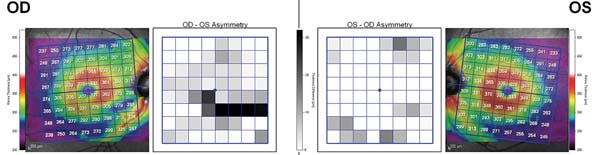
New OCT software uses the patient's own eyes as the baseline. For example, in these scans of the macula (in a different patient), the inferotemporal arcuate area of the right eye is asymmetric compared to the fellow IT region of the left eye, raising a red flag.
|
Diagnostic Data
On initial presentation, best-corrected acuity was 20/20 OD and OS through myopic astigmatic and presbyopic correction. Pupils were equal, round and reactive to light and accommodation with no afferent defect. Confrontation fields were full OU, as were extraocular motilities in all positions of gaze.
Slit lamp exam of her anterior segments was remarkable only for mild arcus OU. Intraocular pressures measured 22mm Hg OD and 18mm Hg OS at 10:30 a.m. Central corneal thicknesses measured 574 microns OD and 551 microns OS.
Upon dilation, her crystalline lenses showed mild incipient nuclear sclerosis, consistent with her refractive findings and best visual acuity. Partial posterior vitreous separations were present OU. I judged her cup-to-disc ratios as 0.45 x 0.6 OD and 0.45 x 0.65 OS. Her optic discs were slightly small and partially tilted, OS > OD. These findings were confirmed on retinal tomography; Moorfields Regression Analysis flagged superior temporal and inferior temporal sectors of both neuroretinal rims as suspicious.
Macular evaluations were normal with fine retinal pigment epithelium granulation and no drusen. Her vascular examination was remarkable for mild arteriolorsclerotic retinopathy OU. Her peripheral retinal evaluations were unremarkable.
Visual fields and gonioscopy were scheduled for a follow-up visit in one month. When the patient returned for follow up, her IOP measured 20mm Hg OD and 18mm Hg OS at 9:15 a.m. Gonioscopy demonstrated grade 4 open angles OU, with minimal trabecular pigmentation.
Flicker-defined form threshold visual fields demonstrated scattered areas of paracentral depressions (OS > OD), but no definitive early glaucomatous field defects. Reliability indices were remarkably good.
OCT testing demonstrated a slightly reduced retinal nerve fiber layer (RNFL) of the inferior temporal sector (OS > OD), consistent with the earlier Moorfields Regression Analysis findings. An 8mm x 8mm grid scan of the maculas demonstrated good symmetry between the hemifields of each eye, as well as good inter-eye symmetry.
Diagnosis
Based on these findings, I thought the patient was at risk for developing glaucoma, although there were as yet no concrete findings of frank glaucomatous damage. While her optic nerves were somewhat asymmetric, her OCT macular grids were symmetric. In cases such as these, precise determination of optic nerve health can be difficult—especially with her small and slightly tilted optic nerves.
Though we have wonderful instrumentation available to us today to image the optic nerves, the neuroretinal rims and the perioptic RNFL, in cases where optic discs are tilted, the imaging can sometimes confound us. For example, many healthy, moderately tilted optic nerves may image on OCT as “abnormal.” But, keep in mind that the eye-catching red, yellow and green on OCT printouts are simply statistical guidelines for us to use—they aren’t infallible indicators of the presence or absence of disease. An RNFL sector that falls into the red section of any OCT scanner simply means that sector is outside normal limits statistically; it doesn’t mean pathology is present.
Recently, investigators have been looking at the retinal nerve fiber layer not only in the perioptic area (where most OCT scanners perform their circle scan), but also in the macular region.1,2 Consider: More than 50% of all ganglion cells originate in the macula, and because glaucoma preferentially damages ganglion cells, perhaps early changes can be seen in the macular region.
Recently, Sanjay Asrani, MD, at Duke University Eye Center has helped develop software for the Heidelberg Spectralis that looks specifically at the macular regions.3 (OCT instruments from Zeiss and Haag-Streit have also added macular analysis software, although these focus specifically on the ganglion cell layer.)
This new software analyzes the central 20 degrees of the retina, with that area divided into an 8mm x 8mm grid of three-degree sectors. Each sector has a calculated thickness, and most importantly, each sector is compared to its comparable sector in the opposite hemifield of the same eye, as well as the same hemifield of the fellow eye.
 |
|
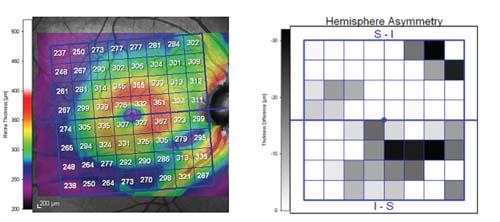
Another red flag from the macula: The inferior temporal region is very asymmetric compared to the superior temporal aspect of the same eye.
|
Likewise, in the images above, the inferior temporal region is very asymmetric compared to the superior temporal aspect of the same eye.
So, in this representative example, the IT region of the right eye raises two red flags: one when compared to the comparable region of the fellow eye and one when compared to the other hemisphere of the same eye.
However, in our 66-year-old female patient described earlier, her macular scans were symmetric between the eyes as well as in the same eye hemisphere comparison. Even though her optic nerves and RNFLs do demonstrate some asymmetry, her macular scans were symmetric.
While this isolated finding cannot be construed as proof positive that our patient does not have glaucoma, it did tell us information about the possibility of glaucoma by looking somewhere other than at the (already asymmetric) optic nerves.
So, for now, we’ll continue to monitor her without medical intervention, although we’ll revisit that decision if her clinical picture changes.
1. Tan O, Chopra V, Lu AT, et al. Detection of macular ganglion cell loss in glaucoma by Fourier-domain optical coherence tomography. Ophthalmology. 2009 Dec;116(12):2305-14.
2. Sung KR, Wollstein G, Kim NR, et al. Macular assessment using optical coherence tomography for glaucoma diagnosis. Br J Ophthalmol. 2012 Dec;96(12):1452-5.
3. Asrani S, Rosdahl JA, Allingham RR. Novel software strategy for glaucoma diagnosis. Asymmetry analysis of retinal thickness. Arch Ophthalmol. 2011 Sep;129(9):1205-11.