Today, while the exact etiology of glaucoma remains a mystery, the clinical efficacy of reducing IOP is not subject to debate. Several large-scale studies have confirmed the importance of lowering pressure in glaucoma patients. Additionally, aggressive pressure-lowering therapies appear to protect some symptom-free ocular hypertensive patients from developing the disease.
|
|
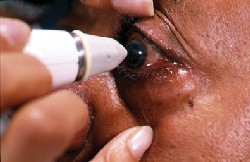
| IOP readings can be thrown off by differences in central corneal thickness (CCT).Courtesy: National Eye Institute, National Institutes of Health |
The first challenge in this balancing act is deciding which patients to treat and which merely to monitor. Having decided to treat, the clinician must next determine a target pressure. After the target IOP is achieved and maintained, follow-up is necessary to ensure disease progression does not occur. If it does, a new target pressure must be introduced. Here, we discuss the target pressure process.
Lowering IOP
Recent data have underscored the efficacy of lowering IOP in ocular hypertensive and glaucoma patients.
In 2002, the results of the long-awaited Ocular Hypertension Treatment Study (OHTS) were released.1 One of the aims of this study was to determine if lowering IOP would prevent or delay the onset of primary open angle glaucoma (POAG) in hypertensive patients who presented with no detectable optic nerve or visual field damage. Between 1994 and 1996, 1,636 patients were randomized; half received treatment to lower pressure by 20%, the other half underwent close observation only. The study showed that reaching a treatment goal of a 20% pressure reduction lowered the percentage of patients who developed POAG by more than 50%from 9.5% in the observation group to 4.4% in the treatment group at 60 months of follow-up.
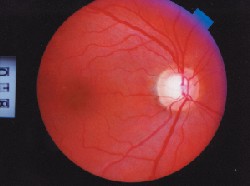 |
| When evaluating risk factors for glaucoma, pay attention to the optic nerve. Notching of the neuroretinal rim, as in this patient, is 87% specific for glaucoma. |
Early reduction of IOP appears to be beneficial as well. The Early Manifest Glaucoma Trial (EMGT) investigated the effect of IOP reduction on the progression of early, newly detected POAG.3 This trial compared a group of patients that received therapy to lower IOP with a group that received no treatment whatsoever. The average IOP reduction was 25%. The treated group experienced significant protection from progression to POAG, with 45% showing progression, compared with 62% in the untreated group. Treatment also improved median time to progression: 66 months for the treatment group compared to 48 months for the untreated group. Overall, this study concluded that every 1mm Hg drop in IOP reduces the risk of progression by approximately 10%.
Studies like these have received a great deal of attention and fanfare, but they should not be misinterpreted as advocating that every single glaucoma or ocular hypertensive patient should undergo the most aggressive pressure-lowering tactics available. No doubt we should aim for low pressures, but only as long as complications are avoided. Beta-blockers and prostaglandins, the two most popular medical therapies, both can lead to potentially serious side effects. Beta-blockers increase the risk of asthma, obstructive airway disease, depression and low blood pressure. Prostaglandins increase the risk of iritis, cystoid macular edema, and of activating herpes stromal keratitis. Moreover, procedures such as laser trabeculoplasty and surgical trabeculectomy present a myriad of potential complications.
Unfortunately, there is no agreed upon formula for calculating just how much each patients IOP should be reduced. Every patients therapy must be tailored to his or her specific needs and profile.
To Treat or Not to Treat?
Once a patient becomes a glaucoma or ocular hypertensive suspect, it is important to take more than one IOP measurement. To get an overall idea of the patients diurnal curve, measure IOP at three or four different points during the daypreferably one assessment in the morning, afternoon and night. The highest reading should be considered the patients clinically relevant pressure. In most patients, pressure is highest about an hour prior to waking in the morning.4
Also bear in mind that IOP readings can be thrown off by differences in central corneal thickness (CCT). This was another significant finding of the OHTS study. Thicker corneas cause IOP readings to be higher than pressures actually are.
Conversely, thinner corneas result in readings that are lower than actual pressures. Researchers have yet to determine what the average CCT is, as thickness seems to differ among populations. But normal CCT appears to fall somewhere between 535m and 545m.
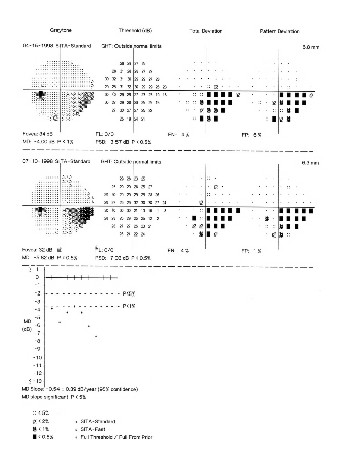 |
| This printout from the Humphrey Glaucoma Progression Analysis software shows a stable patient converting to progression of visual field loss. The software shows that the patient is stable over a period of time and then the patients condition converts as progression is detected. |
There are a number of different conversion charts to choose from, but in our opinion, even though the relationship is non-linear, the best rule of thumb is that every 10 micron difference above or below 555m translates into a 0.5mm Hg discrepancy between the measured and true IOP when using a Goldmann tonometer. Measure-ments that fall nearer to the normal range will have less of an impact on measured IOP than the very thick or very thin outlier corneas.
Even factoring differences in measured IOP caused by CCTs, a thin cornea by itself appears to be a strong independent risk factor for developing disease, according to the OHTS study. The study found that the risk of patients with thin corneas developing glaucoma was about 3.5 times more than could be explained by skewed pressure readings alone. No one is quite sure why a thin cornea is an independent risk factor for glaucoma, but researchers speculate that eyes with thin corneas may be more susceptible to damage from elevated IOP. An eye with a thin cornea may have weaker lamina cribrosa, which may result in diminished connective tissue support for the optic nerve when it comes under assault from high IOP.
Slit lamp biomicroscopy, gonioscopy and, above all, ophthalmoscopy through a dilated pupil should be performed. During the stereoscopic evaluation of the optic nerve, pay close attention to cup depth, whether the cup walls are sloping, whether neuroretinal rim tissues are pink and well perfused, and whether the disk is pink, yellowish or pale. Low-risk vertical cup-to-disk ratio is considered to be less than or equal to 0.3, moderate risk is 0.3 to 0.5, high risk is 0.5 or greater. However, sometimes the age-old notion of cup-to-disc ratio can be unreliable. Relative disc size and cup position are important as well.
Though nothing can completely replace a slit-lamp enabled evaluation of the optic nerve and retinal nerve fiber layer, several new imaging technologies can be helpful in diagnosing nerve and RNFL damage, especially in the early disease stages. The Heidelberg Retinal Tomograph II (HRT II), Optical Coherence Tomography, and the GDx VCC Nerve Fiber Analyzer are three devices clinicians are finding useful for observing nerve architecture and for plotting progression.
In terms of visual field screening, the Swedish Interactive Thresholding Algorithm (SITA) software program is the gold standard. Other significant advancements in detecting early glaucoma via perimetry include Frequency Doubling Technology (FDT) and Short Wavelength Automated Perimetry (SWAP).
In the absence of optic nerve head neuropathy, many ocular hypertensive patients do not require treatment since, according to OHTS, only about 10% go on to develop glaucomatous changes within five years. Still, this can be a challenging call for any eye care practitioner. Other factors to consider in deciding whether to treat hypertensive patients are advanced age (over 50), African-American or Hispanic descent, and a family history of glaucoma.
Determining family history may take some digging on your part, but it is worth the extra time and effort. For every eight glaucoma patients in a practice, there is probably one living relative with undiagnosed POAG. Remember to ask the patient if the affected family member experienced actual vision loss from what was at that time called glaucoma. Many such patients in the 1970s and 1980s were merely ocular hypertensive but were treated anyway.
A small amount of optic nerve head damage is acceptable if the disease is not progressing, though it takes several years of follow-up to determine whether a patient is stable or progressing. In borderline cases, delay treatment only if meticulous follow-up is possible and likely.
Target Pressure
The range of potential IOP reduction with medical therapy is usually between 25% and 40%. Reductions of 50% are possible, but usually not without very aggressive medical therapy and adjunctive surgery. In general, the rule is to reserve the most aggressive treatment for those patients with the most advanced and severe disease. You might be satisfied with a target of 25% reduction for an ocular hypertensive patient with an IOP of 21mm Hg; but a patient with 34mm Hg and extensive field visual field loss might be a more suitable candidate for a 35% or 40% reduction target.
Past damage serves as a predictor for future damage. In other words, if a patient experienced optic nerve head damage with an IOP of 25mm Hg, then that damage will likely continue unless the pressure is lowered. If the patient did not experience damage over a long period of time with a 25mm Hg pressure, then a stable optic nerve head is more likely.
A convenient rule of thumb is to set a minimum percentage target by the baseline IOP measurement. If the initial IOP reading is 30mm Hg, then attempt to reduce the IOP by a minimum of 30%, which would produce an IOP of about 20mm Hg. If the initial IOP reading is 20mm Hg, then attempt to reduce the IOP by at least 20%, which would produce an IOP of about 16mm Hg. Keep in mind this is a minimum target. It may be a good idea to add an extra 5% on this figure, just to be safe. This rule of thumb is a good place to start before taking other factors into consideration.
The patients age and general health should be considered. Patients with compromised cardiovascular and/or pulmonary systems are at greater risk for adverse drug reactions. Also, asthma, congestive heart failure and diabetes are diseases that can be exacerbated by medical therapy. If the patient is older and has existing medical conditions, a target pressure reduction of 25% might be more appropriate than an aggressive therapy strategy. Consider, also, that if a patient is exhibiting early signs and risk factors while only in their 30s, the onus of protecting their nerves for possibly another 70 years might compel one to seriously consider preemptive therapy.
Overall, we consider pressures in the 16-17mm Hg to be a reasonable goal for most patients, and 18mm Hg acceptable for many others. While it may be true that more glaucoma patients would benefit from pressures in the 12-14mm Hg range, the complications that many of these patients would experience while being brought to such low pressures would constitute an unequal trade-off.
There is no avoiding the unfortunate fact that setting a target IOP is not an exact science. Part of the problem is that large-scale studies have no established common protocol for lowering IOP. Some target all patients for 30% reduction, some only 20%. Some perform surgery on every patient, some refrain from surgery altogether. Future studies may shed more light on this issue. But until then, we have to set our target pressures based on the individual needs of each patient on a case-by-case basis.
After a target pressure is established, the next step is to perform a uniocular trial, also known as a monocular trial. The efficacy of uniocular trials has been questioned by some recent studies but, at this point, the bulk of the literature still supports their relevance.
Treat only one eye with your first-line medication. Then, at a subsequent follow-up office visit at the same time of day, compare the pressure of the treated eye with the untreated eye. If the therapy is going well, the pressure of the untreated eye will remain elevated, and the pressure of the treated eye will decrease to your target pressure.
If the target pressure is not met in the treated eye, your drug regimen probably needs to be re-evaluated. This process can be time consuming, because some medications take up to four or five weeks to reach their maximum efficacy, but it is worth knowing that the therapy is or is not working, and that pressure changes are not the result of some other uncontrolled factor.
Detecting Progression
Once target pressure is reached and you feel the disease is well controlled, the patient should return for follow-up visits once every three or four months. Visual field tests should be preformed at least once a year, or more frequently if you deem it necessary. A dilated stereoscopic evaluation of the optic nerve should occur at least once a year as well.
In patients with moderate to advanced disease, visual fields results will be an important tool to determine whether pathology is progressing. Subtle changes in the optic nerve head are difficult to determine using stereoscopic methods once a certain level of damage is reached.
However, there is such a high level of variation in the average patients visual field results that it is often difficult to tell the difference between true progression and normal patient fluctuation. Some studies indicate that up to seven or eight visual field tests are necessary for the accurate diagnosis of true glaucoma progression. Unfortunately, very few doctors have the time to perform eight visual fields on the same patient, and even fewer patients want to undergo them. Moreover, we do not believe any insurance company will cover eight visual field tests on the same patient.
The bottom line is that we need as much assistance as possible in the evaluation of perimetry results. In this vein, it is imperative to hone our visual field skills to the keenest possible edge and to take full advantage of the latest tools and software aimed at enhancing our understanding of visual field results.
The three most important readings of a visual field test from a Humphrey automated perimeter are the glaucoma hemifield test, the pattern deviation probability plots as compared to the total deviation probability plots, and the pattern deviation probability. The assessment of these three values will yield the most comprehensive understanding of the patients optic nerve head.
There are currently four thresholding algorithms available for the Humphrey Visual Field Analyzer II, which is a preeminent device in the field today. There is Standard Full Threshold, Fastpac, SITA-Standard, and SITA-Fast.
Standard Full Threshold is the least current of the four. The newer strategies are just as efficient and much quicker to perform. If you are still using Standard Full Threshold, you are probably a little behind the curve and should consider switching to one of the other three.
Fastpac is the next step up from Standard Full Threshold, and is about 40% faster to perform. However, there is some uncertainty as to whether Fastpac is as accurate as the SITA strategies.
The SITA tests are the most rapid and accurate available at this time. SITA-Standard is twice as fast as Standard Full Threshold and SITA-Fast is about twice as fast as SITA-Standard. It only takes three or four minutes for most patients to complete the SITA-Fast test. It is patient-friendly and accurate. To maximize your visual field results, we recommend using either one of these SITA tests.
As mentioned previously, another helpful tool is Short Wavelength Automated Perimetry (SWAP), which employs a blue target on a bright yellow background. Studies have shown SWAP to be more sensitive in detecting functional loss than white-on-white perimetry. Researchers speculate this is because blue- and yellow-sensitive ganglion cells are damaged first in early glaucoma. The Statpac statistical software is necessary to interpret these results. SWAP is most effective at detecting early, mild-to-moderate disease.
Drawbacks of SWAP include some problems with the normative database, which may interfere with its accuracy. Also, the test takes a relatively long time to complete, and is difficult to perform on patients with media opacities. Many clinicians are looking forward to a new SITA-SWAP product due to be released soon by Carl Zeiss/Meditec. It is hoped these glitches will be remedied in the new version.
Also made by Carl Zeiss/Meditec, Glaucoma Progression Analysis (GPA) is a software program to be used in the Humphrey Field Analyzer. This software statistically analyses all points for progression, prospectively or retrospectively. It is extremely useful in detecting visual field progression.
We have found Frequency Doubling Technology (FDT) to be a worthwhile addition to any practice serious about long term follow-up of hypertensive patients. This technology exploits the fact that retinal ganglion cell mechanisms in the magnocellular (M-cell) pathway are among the first cells damaged in the disease process. By isolating and evaluating these cells, FDT technology is able to detect early visual field loss. Full threshold FDT screening takes about four minutes, and Supra-threshold screening takes about 45 seconds. The latest in FDT technology is the Humphrey Matrix, which is said to increase the technologys efficacy in long-term therapeutic follow-up.
If nerve damage is detected after target pressure is met, you must set a lower target pressure, and surgery becomes a more likely option. On the other hand, if after several years no damage is detected, there is potential for reducing the medical regimen in certain cases. This should be done with great care and patience. It is wise to proceed by first performing a reverse uniocular trial before discontinuing medication in both eyes. If the patient is taking more than one drug, discontinue one medication at a time.
Though we are still a long way from producing a flow chart that will delineate the exact protocols for managing glaucoma and ocular hypertensive patients, glaucoma treatment has made great strides in the past few years, and we hope that trend continues. It is also encouraging to note that decades of pressure-lowering therapies employed on hundreds of thousands of patients were not undertaken in vain, and that we are still on the right track.
Dr. Cole is in private practice in Bridgeton, N.J.,
and is also director of the Irving Bennett Center at Pennsylvania College of Optometry, Philadelphia. In addition, Dr. Cole is chief clinical editor of Review of Optometry.
Dr. Lewis is president of Pennsylvania College of Optometry and the case reports coordinator for Review of Optometry.
- Kass MA, Heuer DK, Higginbotham EJ, et al. The Ocular Hypertension Treatment Study (OHTS). A randomized trial determines that topical ocular hypotensive medication delays or prevents the onset of primary open-angle glaucoma. Arch Ophthalmol 2002;120:701-713.
- AGIS Investigations. The Advanced Glaucoma Intervention Study (AGIS):7 The relationship between control of intraocular pressure and visual field deterioration. Am J Ophthalmol 2000;130:4:429-440.
- Heijl A, Leske MC, Bengtsson B, et al. The Early Manifest Glaucoma Trial Group: Reduction of intraocular pressure and glaucoma progression: Results from the Early Manifest Glaucoma Trial. Arch Ophthalmol 2002; 120:1268-1279.
- Asrani S, Zeimer R, Wilensky J, et al. Large diurnal fluctuations in intraocular pressure are an independent risk factor in patients with glaucoma. J Glaucoma 2000;9:134-142.