To manage glaucoma, OCT is a must-have technology and one of the biggest hurdles practitioners face when adding care of this disease to their practices. The devices provide sophisticated detail on anatomical status and disease risk, but the sheer volume and complexity of the data can be daunting, as there are features and reports galore that can easily overwhelm us. Having numerous technology platforms to choose from only complicates matters further. Each OCT device performs the core components needed for glaucoma care admirably well, but they can differ in scanning capabilities and data output. Which distinctions between instruments matter clinically, and which don’t?
 |
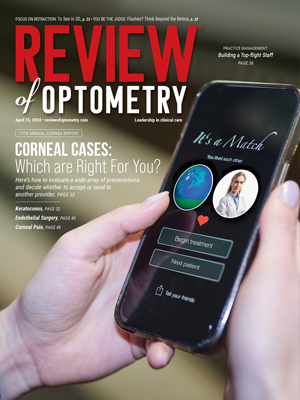
| Fig. 1. Fundus images of the patient from the four manufacturers, taken at the 2019 Academy of Optometry meeting in Orlando. From top left clockwise are Zeiss Clarus, Optovue iFusion, Heidelberg Spectralis and Topcon Maestro2. Click image to enlarge. |
Last fall, Review of Optometry invited a patient from our practice and me to the 2019 American Academy of Optometry meeting to survey four spectral-domain OCT (SD-OCT) manufacturers—Heidelberg, Optovue, Topcon and Zeiss—together in one location. Due to the close proximity of our office, the venue was perfect for a comparative demonstration. This patient accompanied us into the exhibit hall to be tested on each instrument with all of the glaucoma modules available: optic nerve head (ONH), retinal nerve fiber layer (RNFL), macula and OCT angiography (OCT-A). We also obtained fundus photos from each company using separate retinal cameras or on-board fundus imaging within the OCT (Figure 1).
Standardizing the patient removed one key variable from the task of comparing technology platforms, as company literature will of course use patients unique to each manufacturer. Here’s what we found.
 |
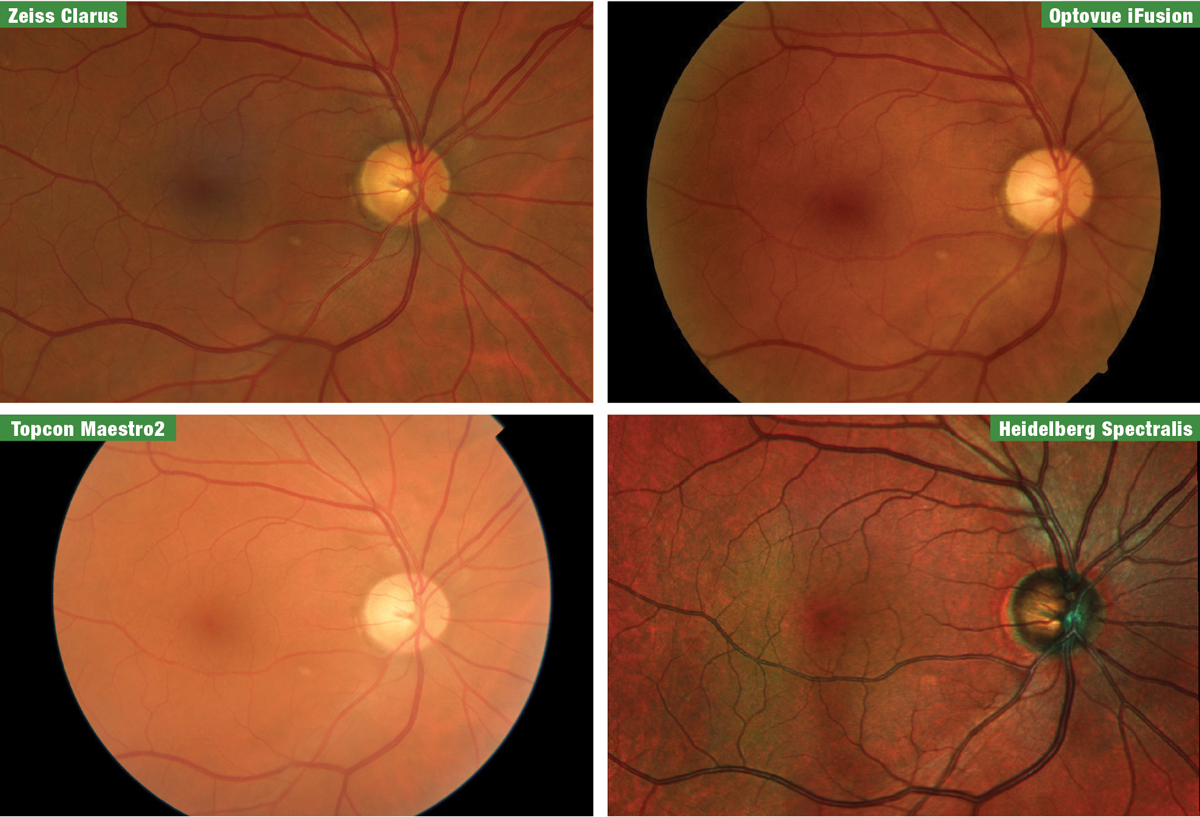
| Fig. 2. The Spectralis’s multicolor imaging mode demonstrates the S/T defect in our glaucoma patient. It can sometimes be difficult to appreciate NFL defects in fundus photos, especially for early-stage patients such as this one, but the above example highlights it exceptionally well. Click image to enlarge. |
Scan Acquisitions
Our patient was a 65-year-old white male recently diagnosed in our clinic with pre-perimetric low-tension glaucoma OD, with no repeatable defects yet on either his 24-2 or 10-2 testing. He reported his father had glaucoma and had to use medications for years to maintain his sight. He is active and healthy, with no comorbidities or medication usage and an average normal resting blood pressure of 113/75mm Hg. His intraocular pressure (IOP) ranges from 15mm Hg to 19mm Hg, and he had a slightly thinner cornea of 515µm. He has larger than average vertical cup-to-disc ratios of 0.65/0.60 OD/OS with a noticeably thinner superior temporal rim OD and RNFL wedge defect visible on fundus photography and confirmed with our in-house OCT.
 |
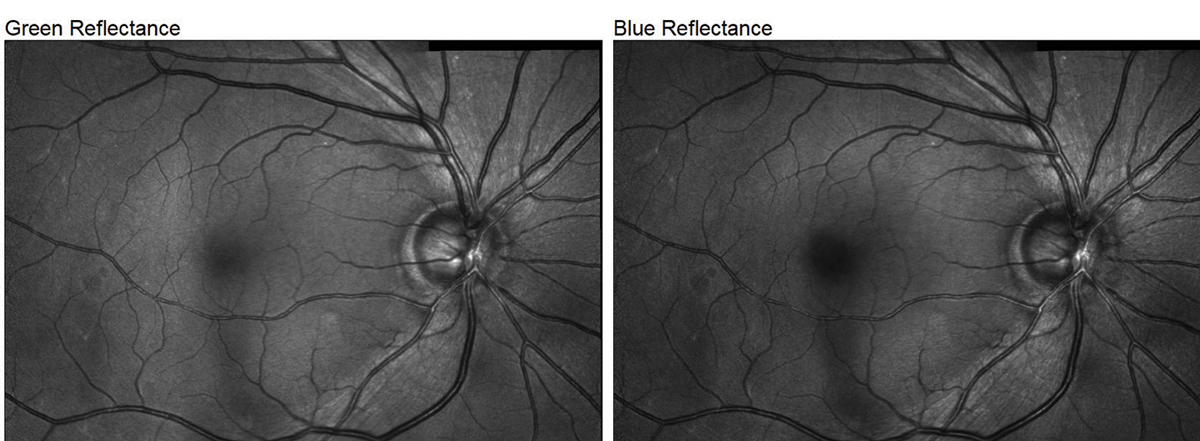
| Fig. 3. OCT-A scans OD/OS from the Spectralis showing mild superotemporal capillary dropout OD. Click image to enlarge. |
Aside from the most commonly used RNFL analyses to aid in the detection and progression of glaucoma, we are fortunate to have optic disc and macular thickness (more specifically, retinal ganglion cell) analyses as well. For the clinician new to OCT and glaucoma, historically, close attention was always given to the RNFL average and inferior/temporal and superior/temporal (S/T) RNFL thicknesses. These were, respectively, the most sensitive and reproducible data points in regards to glaucomatous nerve fiber layer damage.1 More recently, research is showing that macular ganglion cell loss may be just as sensitive as RNFL loss in diagnosing pre-perimetric glaucoma and may be especially useful in highly myopic eyes where traditional RNFL scans suffer.2
The introduction of OCT-A has also given us another method of analyzing structural loss in glaucoma, which looks promising as another key indicator in diagnosing glaucoma. The four manufacturers we tested now have the capability of providing OCT-A as well (Topcon is working on clearance from the FDA for OCT-A capability on its swept-source OCT Triton, but it is unknown at this time if it will be included on the Maestro).
Scenes from the Show FloorDuring the Academy 2019 meeting in Orlando, I recruited Ed Searl— a recently diagnosed glaucoma patient who also happens to be the optician at my practice—to join me in the exhibit hall and be scanned by all the OCT devices available. New to the disease (I diagnosed him about six weeks prior to this event), he was still adapting to the knowledge of the possible course of therapy ahead of him. Still, he gamely undertook several sessions of photography and OCT scanning as we made the rounds that day. Here he is putting the devices through their paces.
|

Given the findings of our show floor test—in which all four manufacturers had excellent agreement in their analyses with no statistically significant difference in detecting glaucomatous loss, your unique needs in your practice should determine which platform you select.2 In short, I found all four instruments equally valid tools for evaluating our test patient. Nevertheless, they do have some unique ways of acquiring and presenting data, which I’ll review below. The opinions are entirely my own, and in fact you may look at the very same scans and arrive at different conclusions.
Heidelberg Spectralis
The images produced by the Heidelberg Spectralis are of outstanding quality. The ability to package in multiple modes of imaging including Blue Peak (fundus autofluorescence; FAF), multicolor high-contrast fundus imaging, anterior and posterior OCT and angiography into one platform is extremely convenient for the disease-focused practitioner. With regards to fundus imaging, of all the instruments we tested, I think the multicolor imaging module demonstrated the s/t defect in our glaucoma patient the best (Figure 2).
The OCT-A images also showed some mild superotemporal dropout consistent with our clinical findings and expectations (Figure 3)
One caveat about the angiography module I noticed during our demonstration—the image capture of the angiography scan has multiple sizes. For our patient’s right eye, the scan taken included the entire papillomacular bundle, with a horizontal scan width of 8.3mm. The sheer size and detail of the scan required an image acquisition time of minutes, not seconds. We opted for a smaller scan size for the left eye to minimize our patient’s discomfort. The smaller scan still gives a thorough evaluation of the peripapillary angioplex with a much shorter acquisition time.
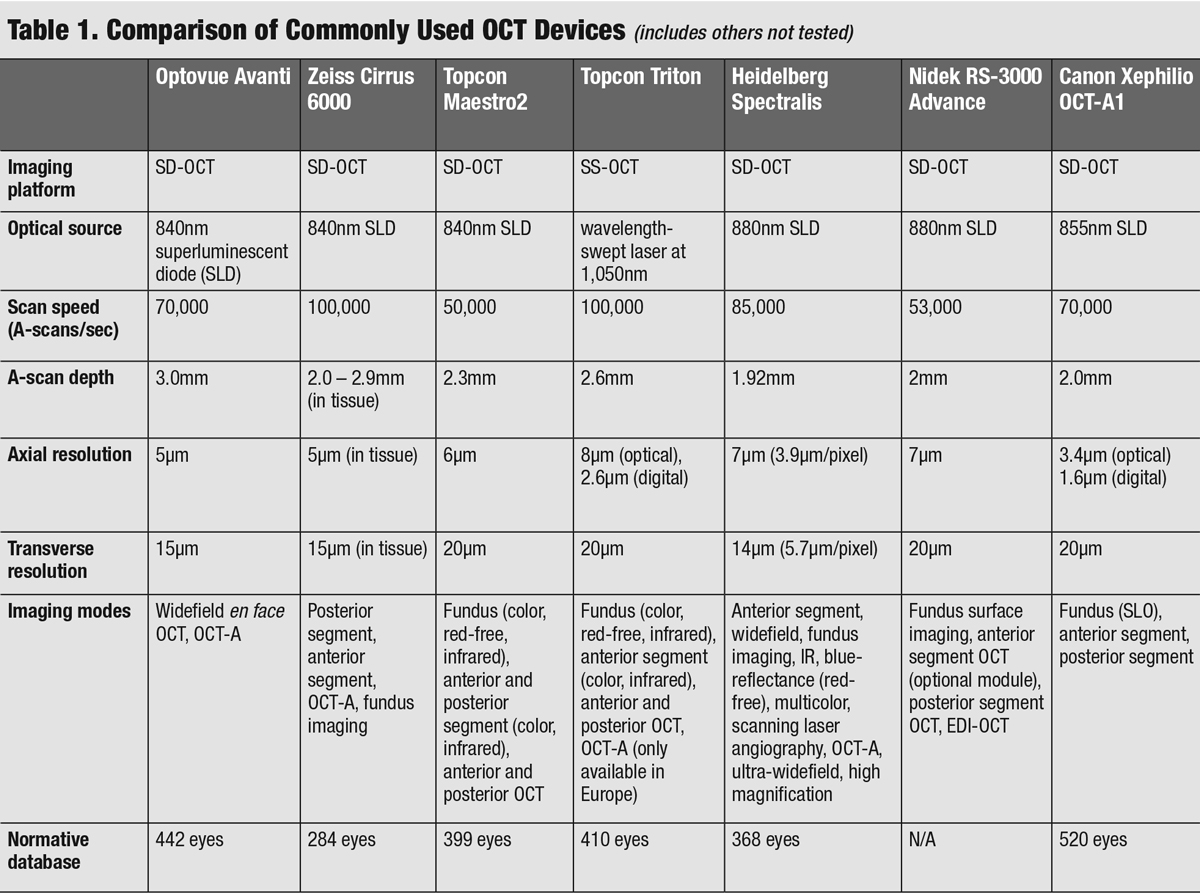 |
| Click table to enlarge. |
Even ignoring the OCT-A module, it is my personal opinion that this would be the most difficult instrument of the four tested to delegate to your technicians. That being said, the Spectralis has such a fantastic array of configurations and high level of detail that make the steeper learning curve easily justifiable. Of all the instruments we tested, it was the only one to offer a FAF module. Though we don’t use FAF in our clinic for glaucoma monitoring, we use it regularly to monitor AMD, differentiate optic disc drusen and screen for drug-induced maculopathies.
The configuration during our demonstration of the instrument and separate PC unit did make for a larger footprint, which should be considered in a smaller clinic where space is at a premium.
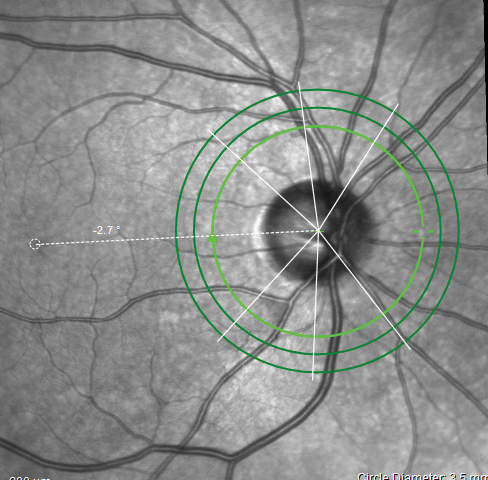 |
| Fig. 4. The ONH/RNFL scan indicating the Anatomic Positioning System on the Spectralis. Click image to enlarge. |
The quality of the OCT images from the Spectralis are fantastic, and the reports are plentiful (Figures 4 and 5). The Hood report and anatomic positioning system (APS) can be purchased with the Glaucoma Module Premium Edition (GMPE). The APS feature maps the anatomic position of the center of Bruch’s membrane opening and the center of the fovea to establish an angle of reference for future scan comparisons as well as a consistent horizontal delineation between the superior and inferior structures for comparative analyses. The Hood report rearranges some of the data on the typical temporal, superior, nasal, inferior, temporal (TSNIT) curve, so that the curve starts on the nasal region and the temporal region thickness, which is more likely to be compromised in glaucoma than nasal RNFL, is located centrally (Figure 6). It also overlays a visual field simulation plot for both 24-degree and 10-degree chords.
Interestingly, the clear thinning and RNFL defect found S/T with our patient was not flagged as borderline or outside normal limits on the S/T RNFL map sector report, but it was found to be borderline on the minimum rim width report.
Optovue Avanti
When using the Optovue Avanti with Angiovue software, in a matter of just a few minutes we had captured ONH, RNFL, macular ganglion scans, as well as some beautiful angiography images. The ease of use was simple enough. The RNFL and ONH report are similar to the other manufacturers’ OCT instruments, with a typical TSNIT plot, an RNFL scan broken into eight segments, a line scan showing the contour of the disc as well as average thicknesses of the RNFL and ONH parameters and their corresponding relation to the age-matched normal indices. The RNFL and ONH scan on our patient confirmed our suspicions and agreed nicely with our clinical findings showing a thickness in the superotemporal region found in <1% of the normative database.
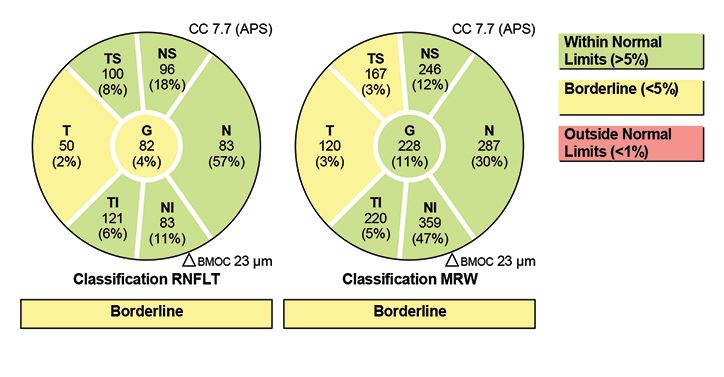 |
| Fig. 5. The Garway-Heath sectors from the Hood report, as determined by the Spectralis. Click image to enlarge. |
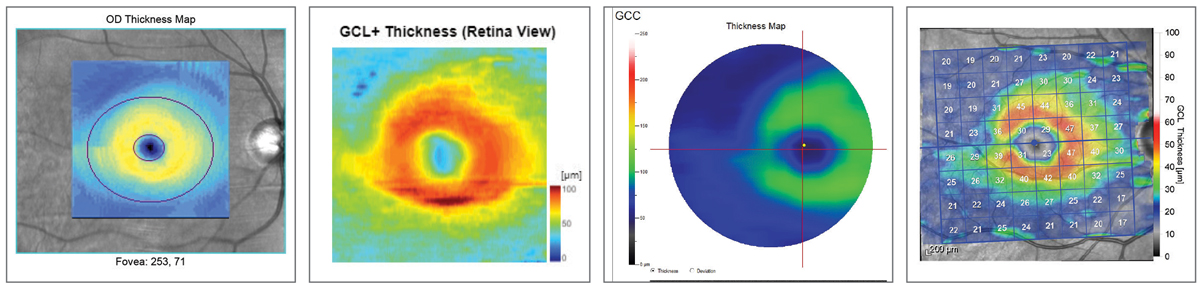
The ganglion cell complex (GCC) scan and report from Optovue is unique in comparison with all the other manufacturers. A cursory glance will give the impression the scan is off center from the macula, which is intentional. The scan is moved temporally, as this provides a higher concentration of ganglion cells to include in their global loss volume metric for early detection. A large review of SD-OCT also found that the nasal macular ganglion cell thickness to be less reliable than the superior and inferior temporal thicknesses.2
A report offered by Optovue includes the RNFL, ONH and macular GCC, encompassing all the parameters the typical practitioner could want (Figure 7). However, I do prefer having a more bird’s-eye view of the ONH map image, as it can be difficult to subjectively appreciate the RNFL defect in the included map.
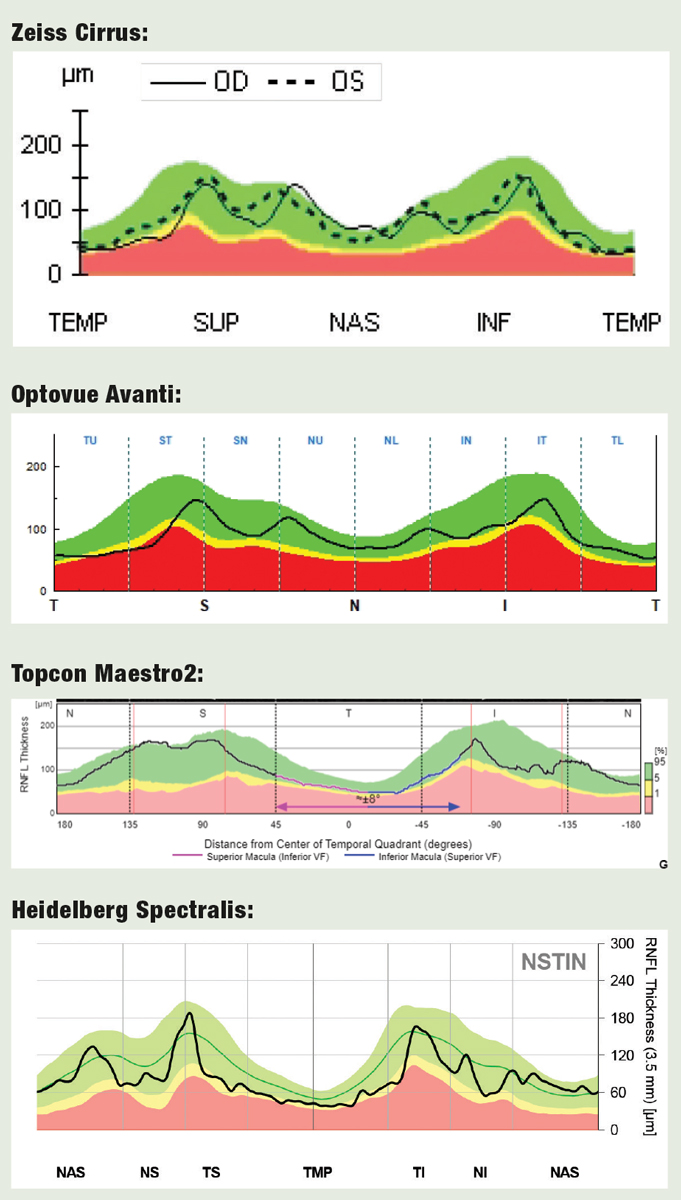 |
| Fig. 6. TSNIT vs. Hood for RNFL Analysis OCT devices use either conventional graphs of RNFL thickness in the TSNIT sequence, or the alternative approach championed by Donald Hood, MD, which places the temporal segment (more vulnerable in glaucoma) in the center of the graph. Here’s how the four devices rendered this data. Click image to enlarge. |
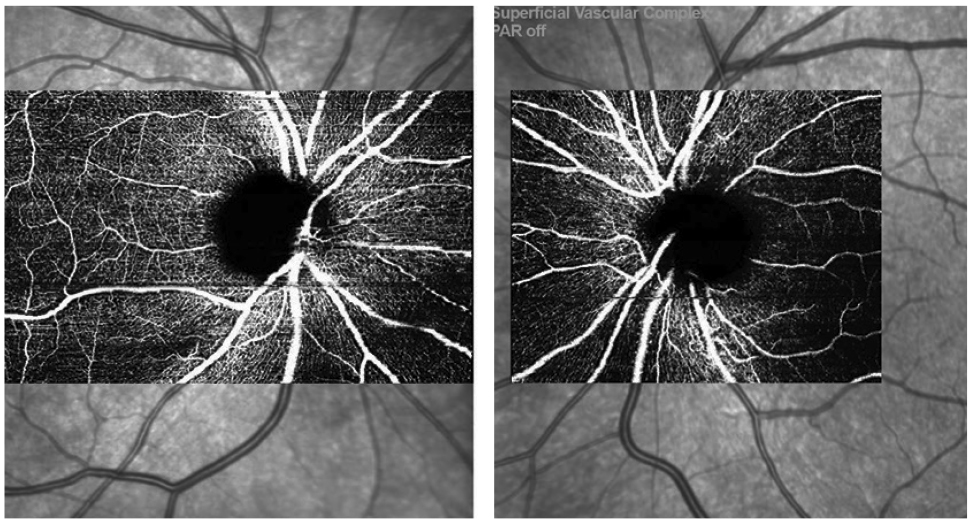
The OCT-A images provided by the Angiovue software were stunning, and in my opinion, the most detailed of all the instruments we tested (Figure 8). For our patient, the radial peripapillary capillary vessel density image shows capillary dropout corresponding to the RNFL defect superior temporal OD. Though we only performed angiography scanning of the ONH, there are benefits to angiography scanning of the macula in both glaucoma and various macular diseases.
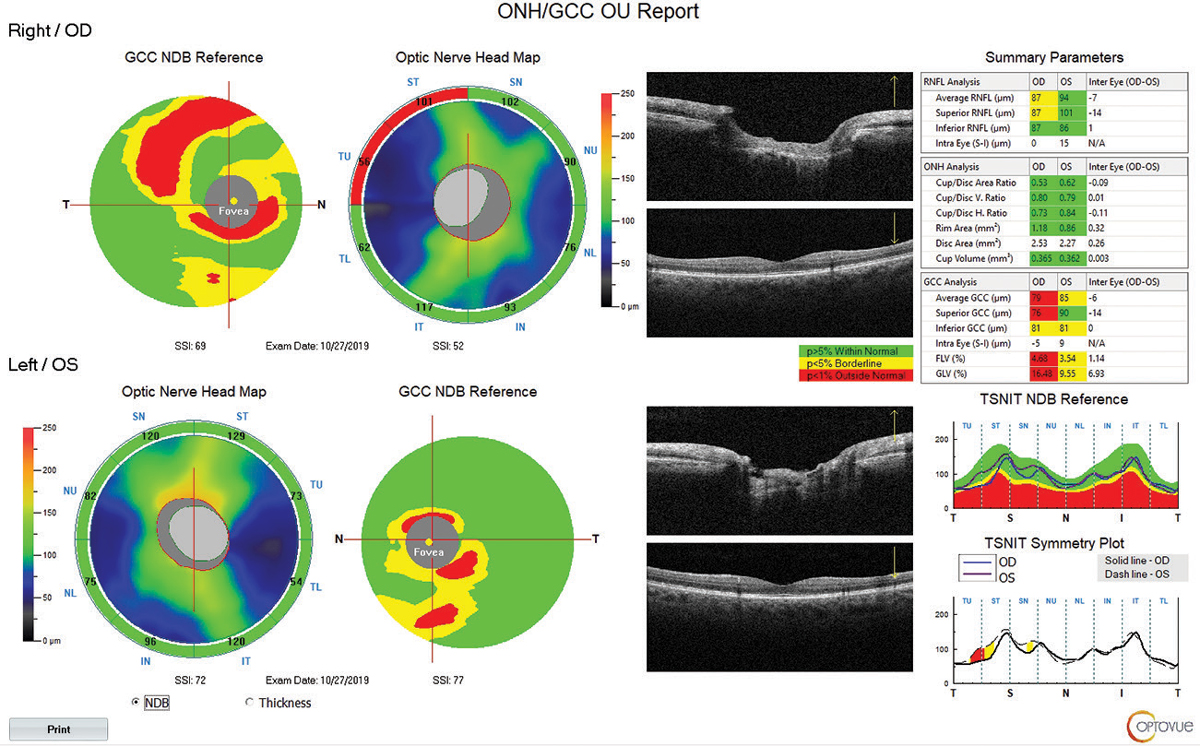 |
| Fig. 7. This report from the Optovue Avanti includes numerous parameters that can help assess a glaucoma patient. One nice addition: an actual live OCT scan of the macula is visible, in addition to the contour map, to help the clinician recognize correspondence to anatomical structures. Click image to enlarge. |
The footprint of the instrument is reasonable, and the Avanti offers the addition of anterior segment maps and corneal OCT scans that round out an excellent package. Optovue also offers multiple NetView packages to allow the practitioner to view and manipulate the images from either their workstation, tablet or smartphone. Flow throughout the clinic is just as important as the data you receive. As reimbursements for OCT have decreased over the past decade, efficiency in analyzing the scans and making decisions come at a high premium, so it is considerate of Optovue to make their software as individualistic as possible by offering multiple options with NetView.
Topcon Maestro2
Topcon could not have made OCT capturing any easier by introducing the Maestro2, a near fully automated instrument combining fundus photography, anterior OCT, posterior OCT and possibly in the future (pending FDA clearance) OCT-A as well. Due to the automation of the Maestro2, it was by far the fastest instrument we tested, as the speed of the acquisition surprised both me and our patient. However, if you have an SD-OCT in your office now, you’ll understand that the actual scanning time is negligible. It’s the alignment, focusing and image plane selection that takes so much technician time. To have an automated instrument in a busy practice would be valuable, but I would wonder about reliability in patients who have fixation loss, such as a patient with advanced macular degeneration with geographic atrophy. Would they be able to fixate where necessary? In such cases, manual fixation will need to be used.
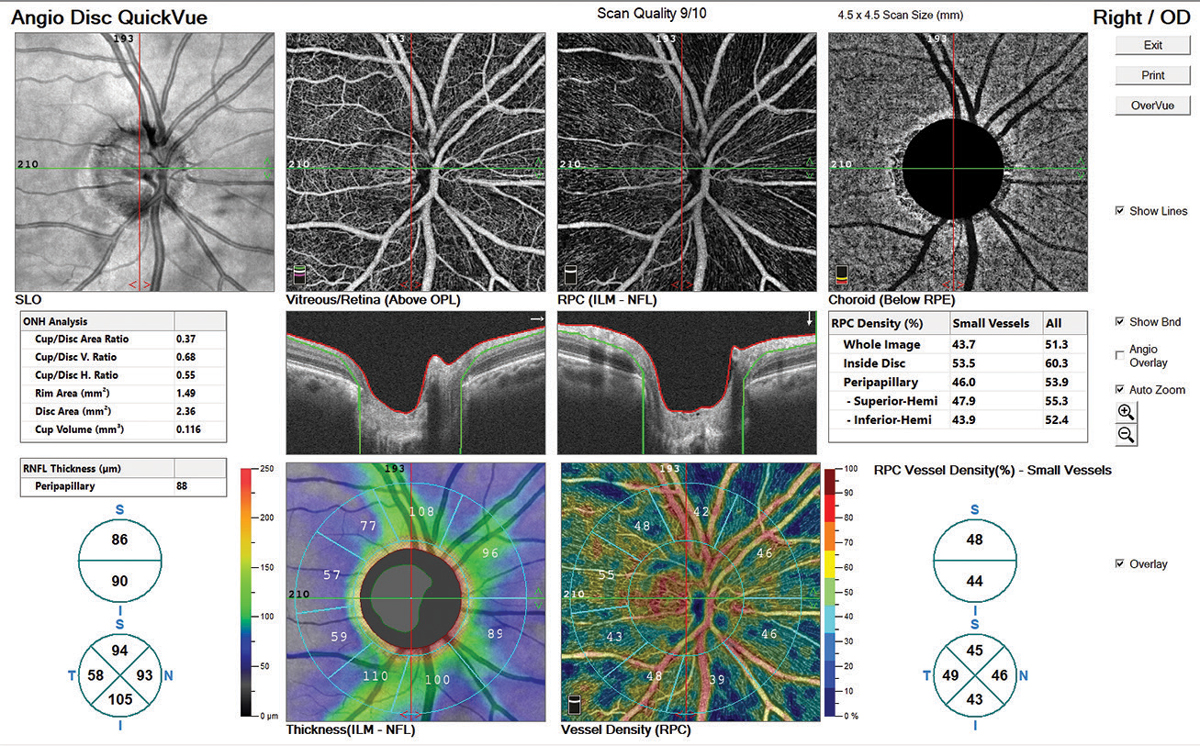 |
| Fig. 8. The AngioVue software rendered the vascular network in rich detail. Note the capillary dropout in the vessel density map, which corresponds to the RNFL dropout. While the clinician would arrive at the same awareness of nerve fiber loss without OCT-A, it aids confirmation. Click image to enlarge. |
Another nice feature: the rotatable control display makes the unit flexible to work in nearly any clinical setting and lets the tech and patient sit side by side if desired.
Including true color fundus photography with a nearly automated OCT in the same platform is enticing to the clinician who is looking to conserve space and save time. I would imagine that if I were in a corporate location with little space available to dedicate to imaging and had inconsistent staff or assistants with less imaging experience, the Maestro2 could be the perfect option.
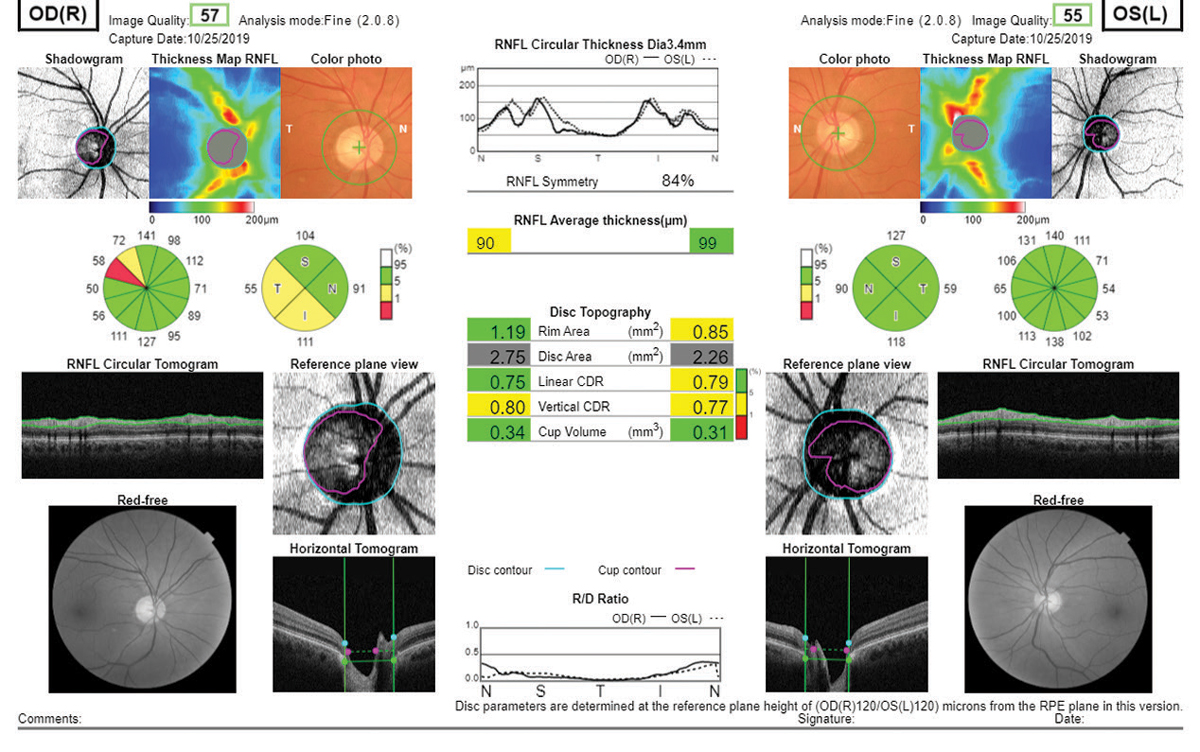 |
| Fig. 9. Essentially every piece of diagnostic data a clinician might need is present in this Topcon Maestro2 report, including true color and red-free fundus photography. Click image to enlarge. |
Topcon’s OCT platform offers a plethora of reports, but I especially like the one included here due to the abundance of data and inclusion of the color and red-free photography (Figure 9). The RNFL analysis is broken into a typical 12 o’clock and four quadrant setup like the Cirrus platform. The disc topography analysis offers age-matched normal comparisons as well. Topcon, like Heidelberg, also offers the Hood report for clinicians who prefer the shifted circumpapillary RNFL and simulated threshold map. Topcon’s Hood report does differ slightly from Heidelberg’s as a larger area of the retina is scanned, and the threshold overlay that is included on the Maestro differs from the Spectralis.
Unless the exclusion of angiography at present is a dealbreaker, the Maestro2 should be on the short list for the practitioner considering adding OCT in their office.
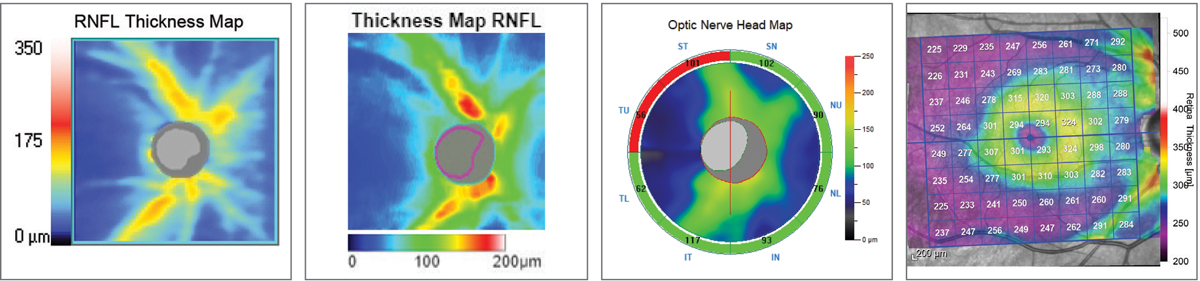 |
| Fig. 10. RNFL thickness map comparison. Left to right: Zeiss Cirrus 6000, Topcon Maestro2, Optovue Avanti, Heidelberg Spectralis. The colors represent deviation from each device’s normative database. The Topcon and Zeiss images highlight the RNFL wedge defect by the blue streaks superotemporally. All four instruments will ultimately detect the RNFL defect, but it comes down to personal preference in how you use the data and visuals to get there. Click image to enlarge. |
Zeiss Cirrus 6000
We’ve been using the Zeiss Cirrus 4000 in our office for almost eight years, so we are quite familiar with this platform. Nonetheless, I was still impressed with the upgrades Zeiss has added to its OCT family.
The Cirrus 6000 is still a remarkably easy platform to use and to train your technicians to operate, and certainly images and processes much faster than our current model. It boasts one of the smallest footprints yet to date. The layout of the instrument is similar to previous versions, with the technician sitting to the right of the patient. The speed of the instrument approaches that of the swept-source OCT units in the research facilities, with the company reporting speeds of nearly 100,000 scans/second.
I was pleased to see that the reports have changed little from our older-model OCT. This makes comparing data in the future when upgrading instruments seamless to the clinician and avoids any mental arithmetic when trying to compare apples to oranges.
 |
| Fig. 11. Ganglion cell layer comparison. Left to right: Zeiss Cirrus 6000, Topcon Maestro2, Optovue Avanti, Heidelberg Spectralis. Note how all four instruments render the superior/inferior asymmetry. Click image to enlarge. |
Similar to Topcon’s report layout, the Zeiss RNFL, ONH and ganglion cell report both break up the RNFL into an average thickness parameter, quadrants and clock hours (Figures 11 and 12). The divisions are then compared with the normative database also, with green representing 95% of normals, yellow <5% and red <1%. ONH analysis with normal comparison is also included.
Thoughts on RNFL Thickness MeasuresThere was good correspondance among the four devices in RNFL thickness measurements in the affected eye: 82µm for Spectralis and Cirrus, 87µm for Avanti and 90µm for Maestro2. When comparing to age-matched normals, all but the Cirrus flagged it as below 5%. This highlights the importance of not making a decision on the red/yellow/green deviation measures alone. The RNFL thickness map on the Cirrus demonstrated the wedge defect with unambiguous clarity even though it reads as ‘green’ on deviation assessment. |
I actually prefer Zeiss’s simulated RNFL thickness map for RNFL defect visualization over the others. I fully admit this may be a habituation bias, but if you look closely at the similar images provided by the four manufacturers, it’s my opinion that Zeiss offers a great image for the clinician looking to detect—not necessary quantify—RNFL defects (Figure 10). While the accuracy and repeatability of objective analysis is highly important, much of our day-to-day decision-making centers around the question, “Is this normal or not normal?” Often I’ll have a patient with a blonde fundus, which complicates RNFL analysis on photographs and biomicroscopy, but the Cirrus platform demonstrates the visible RNFL dropout in these cases quite well.
Notice the visible dark blue slit on the Zeiss image S/T OD. This area can be difficult to appreciate on some fundus photography but is highlighted easily here. I find this a useful way to confirm or double check imaging results and funduscopic suspicions.
We have been using SD-OCT in our practice since 2011, so we have data going back nearly nine years. This has been extremely helpful in our clinic. The secondary but invaluable uses in illuminating macular pathology, angle anatomy and scleral lens fine tuning are wonderful, but they take a back seat to the primary function of diagnosing and managing primary open-angle glaucoma in our office.
Though our OCT is becoming dated, it holds thousands of scans that provide so much data that it would be hard to swallow a loss of the historical care by switching to another platform. When we do eventually upgrade our instrument, I anticipate we will stay with the Zeiss family due to their backwards compatibility. If you are using OCT primarily for other conditions besides glaucoma, I believe you are much more justified in switching platforms if this is your consideration. It must be repeated, however, that the data you have from one manufacturer is not transferrable to another. There is no continuity of care in glaucoma when switching platforms, so moving from one manufacturer to another will confound your progressive decision-making with your glaucoma patients.
Zeiss offers a separate picture archiving and communication system software called Forum. Our office has used this daily since adding our Cirrus platform. It must be considered, however, that this is a separate server-based imaging management software that must be purchased in addition to the instrument.
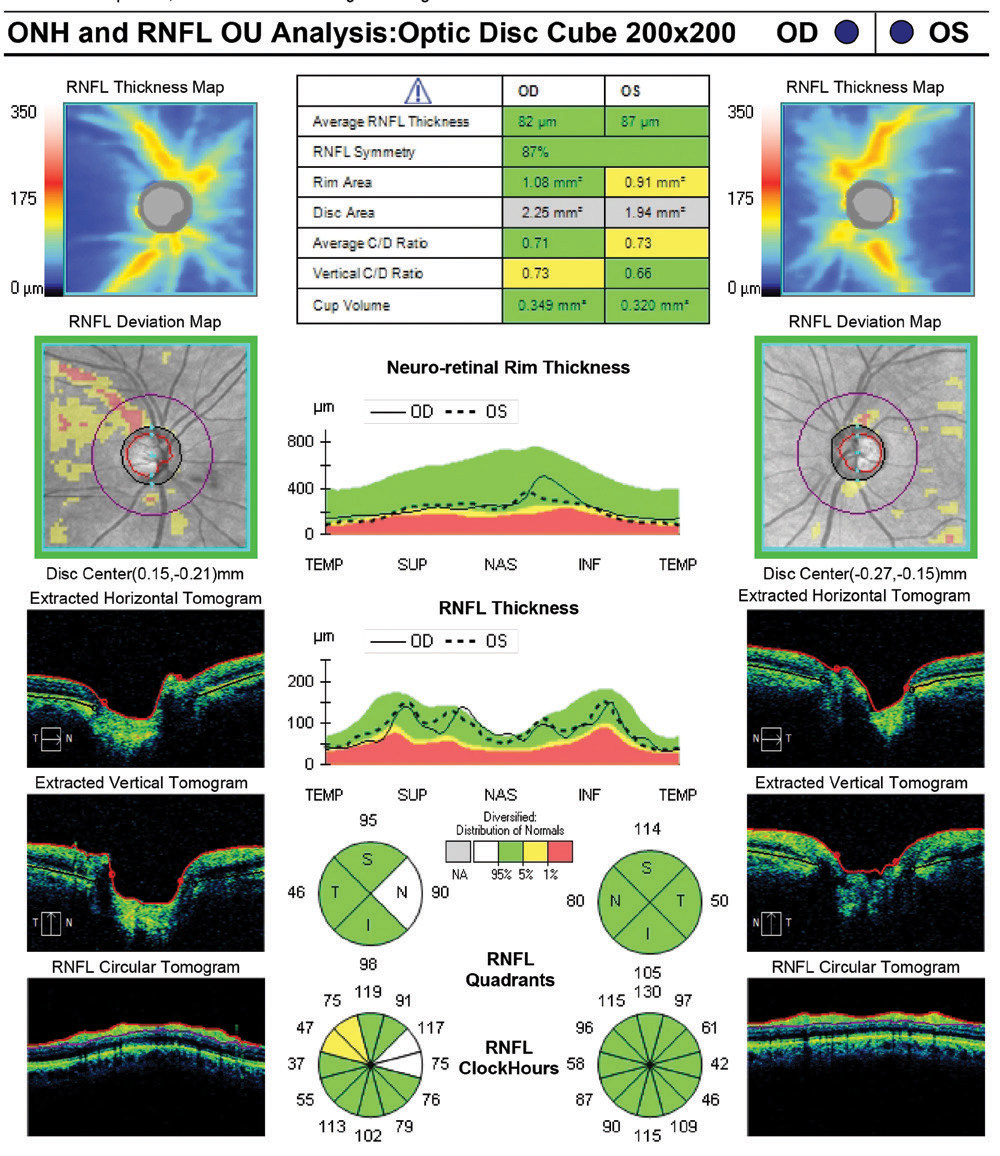 |
| Fig. 12. This summary report from the Zeiss Cirrus 6000 retains the simplicity and familiarity of the company’s long history in OCT applications for glaucoma. This report also flags the ONH disc area (gray line in the table) as outside normal parameters, which suggests a need for caution as this may be an anatomically larger disc. Click image to enlarge. |
Final Thoughts
Our little show floor expedition helped me to see just how far OCT technology has evolved, especially in glaucoma care, and to better understand the similarities and differences among the platforms. But clearly we only scratched the surface in this comparison.
For instance, we were largely unable to consider serial analysis of glaucoma patients to assess markers of disease progression, which is an absolutely critical element of care, since we only performed one scan on one day at each site. The beauty of today’s SD-OCT tech is that you receive a repeatable and objective measurement of the optic disc and RNFL to help you isolate the suspects from the normals. The power these devices hold is the ability to repeat the measurements over time and further delineate the progressors from those with normal anatomical variation.
Progression analysis software and the integration of structure/function data were two important aspects of OCT we simply couldn’t address in a single visit. Anyone interested in adding OCT or upgrading to a new device should do their due diligence with all the devices out there. We only tested one model from each of the big four manufacturers with most of the bells and whistles, but there are numerous models and configurations with each manufacturer—not to mention the two others we weren’t able to try, Nidek and Canon, both of which offer high-performance OCT devices with custom glaucoma analytics, too.
It would also be wise to consider the longevity of the platform, repairability and warranty options offered by the manufacturers, as repairs can be costly. Though we’ve never had any direct issue with the PC driver of our Cirrus, I would imagine that the Spectralis and Optovue do have an advantage of having a separate and easily replaceable PC. Of course, the downside to a modular OCT system without an integrated PC is a much larger footprint, which could be a challenge in a smaller office. For those purchasing for the first time, I’d highly recommend doing a demonstration with all the manufacturers you are considering.
OCT has established itself as a technological pillar in eyecare, so if you’re considering your first purchase, choose what fits your practice the best, as you will likely have continuity in the future with any of the manufacturers tested.
Dr. Schott owns and operates Kindred Optics at Maitland Vision in Maitland, FL. He is currently a member of the American Optometric Association and the Central Florida Optometric Society.
| 1. Park SB, Sung KR, Kang SY, et al. Comparison of glaucoma diagnostic capabilities of Cirrus HD and Stratus optical coherence tomography. Arch Ophthalmol. 2009;127(12):1603–9. 2. Kansal V, Armstrong JJ, Pintwala R, Hutnik C. Optical coherence tomography for glaucoma diagnosis: An evidence based meta-analysis. PLoS One. 2018;13(1):e0190621. |