Annual Diagnostic Skills and Techniques IssueFollow the links below to read other articles from our update on diagnostic skills and techniques: |
In the clinical setting, visual electrodiagnostic testing objectively detects characteristic visual function changes of a given disease—leading to timely diagnosis. It can also help clinicians assess disease severity, evaluate therapeutic effects and adjust the treatment plan accordingly. This primer helps you understand the technology behind and clinical applications of electrodiagnostic tests and what they can do to boost your patient care.
The Fundamentals
Visual electrodiagnostic testing encompasses the electroretinogram (ERG), visual evoked potential (VEP) and electro-oculogram (EOG) tests, which allow localization of functional deficits of the retina, optic nerve and post-chiasmatic components along the primary visual pathway. Specifically, full-field ERG (ffERG) represents a mass response of the entire retina for the rod and cone systems; multifocal ERG (mfERG) provides topographic mapping of the central retina function for the cone system; and pattern ERG (pERG) and ffERG photopic negative response evaluate ganglion cell function. VEP assesses functional integrity of the primary visual pathway at the cortical level, while EOG test results reflect retinal pigment epithelium (RPE) function.
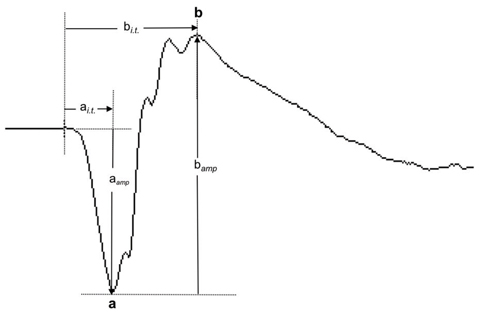 |
| Fig. 1. This normal ffERG dark-adapted 3.0 response shows the a-wave and b-wave components and the measurement of their response amplitudes (aamp and bamp) and implicit times (ai.t. and bi.t.). Click image to enlarge. |
A quick review of what these tests do and how they are performed can help you better understand their clinical utility:
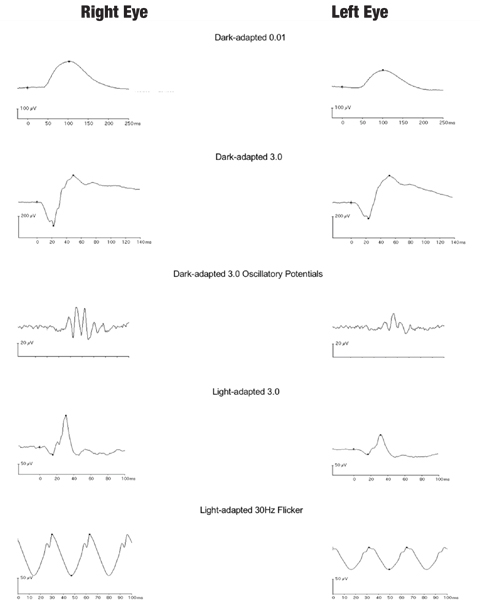
ffERG. This is a mass retinal response elicited by stimulating dilated eyes with flashes of light from a Ganzfeld stimulator, routinely recorded with corneal electrodes. Clinicians can evaluate the cone and rod systems respectively and delineate photoreceptor and bipolar cell contributions. Patients are tested under dark-adaptation using dim and bright single flash stimuli for scotopic responses (dark-adapted 0.01, 3.0 and 10 responses) and under light-adaptation using bright single flash and 30Hz flicker stimuli for photopic responses (light-adapted 3.0 and 30Hz flicker responses).
The responses are evaluated based on the morphology as well as the measurable parameters of waveform components. For example, the a-wave component of the ffERG dark-adapted 3.0 response is the first negative deflection, followed by the positive b-wave component (Figure 1). Both amplitude and implicit time are the parameters used to measure the ERG responses. The amplitude of the a-wave is measured from the baseline to the trough of the a-wave, whereas the b-wave is measured from the trough of the a-wave to the peak of the b-wave. Implicit time refers to the time needed for the response to reach maximum amplitude from stimulus onset. Photoreceptor function is reflected by the a-wave, and the b-wave reflects bipolar cell and Müller cell functions.1 The oscillatory potentials (OPs) consist of low-amplitude and oscillating (high frequency) wavelets superimposed on the ascending phase of the b-wave. OPs reflect inner retinal currents involving neurons such as the amacrine cells.2
The photopic negative response (PhNR) is a slow negative component after the b-wave of the cone-driven ffERG, which has been shown to originate primarily from ganglion cell activities.3
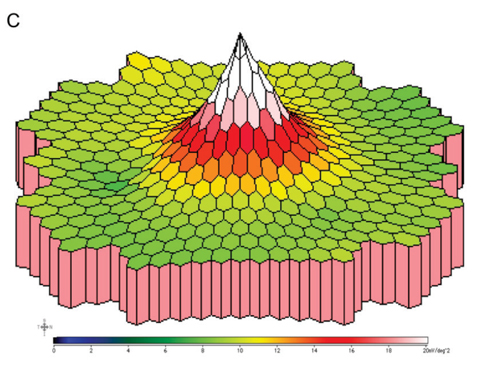
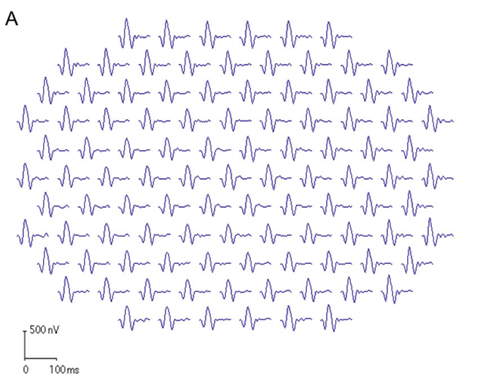 | Fig. 2. These first-order mfERG responses (field view) show (A) a normal trace array with 103 elements (left eye), (B) the P1 component of an individual trace and (C) the three-dimensional P1 response density plot. |
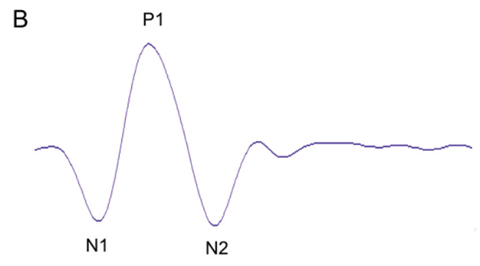 |  |
mfERG. This test provides topographic mapping of the central retina function for the cone system with a diameter of 40° to 50°.4,5 It simultaneously acquires ERG signals from a large number of discrete retinal locations, which allows detection of focal changes in retinal function. The signals are recorded with a corneal electrode on a dilated eye. Commonly used stimuli are 103 hexagonal elements, with the luminance of each hexagon independently modulated according to a pseudorandom m-sequence.
mfERG trace waveforms represent local responses extracted by correlating the recorded continuous ERG signal with the stimulus sequence. The first-order kernel trace reflects the retinal response to the flash. Each trace consists of an initial negative response (N1), a positive response (P1) and a second negative response (N2). The mfERG waveforms mainly reflect photoreceptor and bipolar cell activities. Amplitude and implicit time of the P1 component are most commonly used for analysis. Overall signal strength per unit area of retina is displayed on the three-dimensional plot (Figure 2).
Anatomy Review: The Primary Visual PathwayWithin the retina, the photoreceptors transduce light into neural signals, and the visual information is transmitted to bipolar cells and then to ganglion cells.1 An additional cell layer, the RPE underlying the retina is essential in supporting photoreceptor function. The duplex retina is uniquely structured with the rod and cone systems, respectively. While the rod system specializes under scotopic or dim light conditions with high sensitivity but low temporal resolution, the cone system specializes for photopic or bright light vision, color detection and fine spatial resolution. Subsequently, retinal ganglion cell axons become myelinated upon exiting through the lamina cribrosa region, and the majority project to the lateral geniculate nucleus (LGN). The axons of LGN neurons then travel along the optic radiations and carry the information to the visual cortex. 1. Masland RH. The neuronal organization of the retina. Neuron. 2012;76(2):266-80. |
pERG. This is used primarily for functional evaluation of ganglion cells in the central retina.6 It originates from the inner retinal layers, enabling an assessment of ganglion cell function. A DTL corneal electrode (Diagnosys) is used for the recording of an undilated eye’s response to checkerboard pattern stimuli with spatial and temporal contrast modulation.
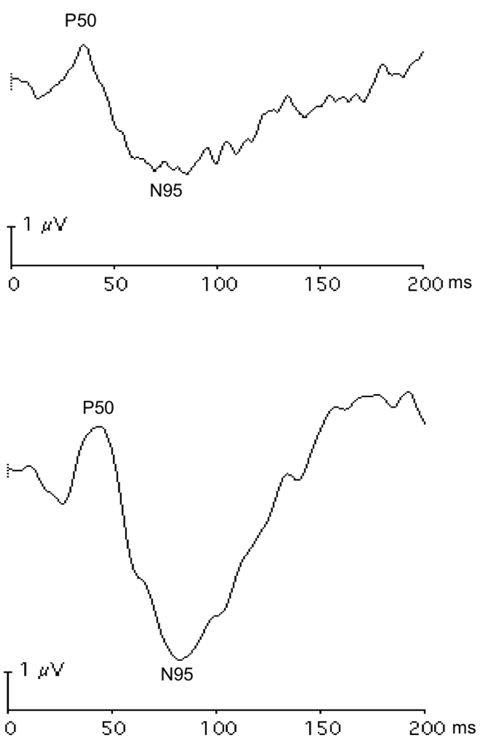
Checkerboard reversal patterns with low reversal rates (e.g., four reversals per second) elicit transient responses characterized by a negative-going (N35) component, a positive-going (P50) component and a subsequent negative-going (N95) component (Figure 3). The P50 component is partially driven by the ganglion cells, but also has origins distal to the ganglion cells. The N95 component reflects ganglion cell activities. Steady-state pERG responses are elicited by checkerboard patterns of high reversal rates (e.g., 16 reversals per second).
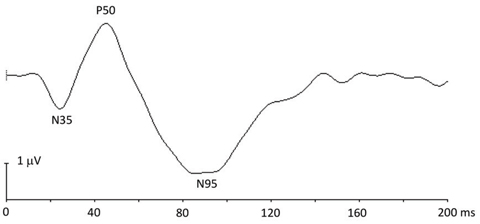 |
| Fig. 3. This pERG response shows the N35, P50 and N95 components. |
VEP. This is an electrophysiological signal recorded at the occipital lobe in response to checkerboard pattern (for pattern VEP) or flash visual stimulation (for flash VEP) presented in the central field of an undilated patient. It evaluates the integrity of the primary visual pathway serving the central visual field.7 The active electrode is placed on the occipital scalp over the visual cortex. The midline occipital electrode can be used to assess prechiasmal function, whereas at least two additional lateral electrodes are recommended for assessing chiasmal and postchiasmal function.
Pattern-reversal VEP (pVEP) uses black and white checks reversed at a rate of two per second. Pattern onset/offset VEP uses alternating checkerboard (200ms) and diffuse gray (400ms) background as stimuli. pVEP is most commonly used due to its smaller variability across typical subjects compared with other types of VEP. The waveform components of pVEP include an initial negative peak (N75), a large positive peak (P100) and a second negative peak (N135) (Figure 4).
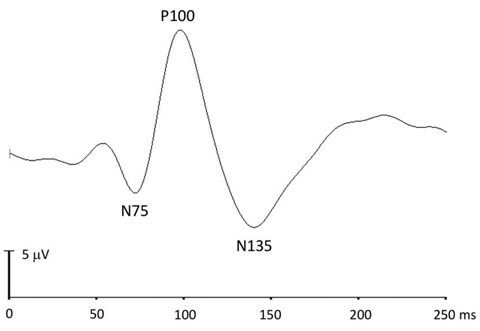 |
| Fig. 4. This pattern-reversal VEP response shows the N75, P100 and N135 components. |
EOG. This evaluates RPE function under dark and light phases.8 EOG uses defined eye movements to monitor the standing potential of the eye. Responses decrease with dark adaptation, reaching a minimal value at around 10 to 15 minutes. Responses then increase with light adaptation, reaching a maximal value at around seven to 12 minutes after light onset. Reduced Arden ratio—the light peak/dark trough ratio—indicates RPE dysfunction, given that the light rise process is regulated by Bestrophin-1 (encoded by BEST1 gene), a protein predominantly expressed in RPE cells.9
Clinical Applications
Visual electrodiagnostic testing can play a pivotal role in the management of many retinal/retinochoroidal and optic nerve diseases caused by maldevelopment, hereditary, toxic, metabolic, retinal vascular, degenerative, inflammatory and immune-related etiologies (Table 1).
Table 1. Clinical Applications of Electrodiagnostic Testing in Retinal/Retinochoroidal and Optic Nerve Diseases | |
| Examples | |
| Retinal/retinochoroidal diseases | |
| Hereditary |
|
| Inflammatroy and immune-related |
|
| Toxic |
|
| Nutritional deficiency |
|
| Vascular |
|
| Optic neuropathies |
|
Hereditary retinal diseases. These are often genetically heterogeneous, and the majority are caused by gene mutations that primarily affect outer retinal function. Thus, ffERG and mfERG abnormalities are among the main criteria for the diagnosis of many hereditary retinal diseases and for refining functional phenotypes.
Hereditary retinal diseases, such as retinitis pigmentosa and cone-rod dystrophy, could cause generalized deficits across the retina; those such as Stargardt disease could predominantly affect the macular area (Figure 5).10,11 Particularly, patients with typical retinitis pigmentosa present with loss of rods followed by loss of cones, while patients with typical cone-rod dystrophy show loss of cones first followed by loss of rods. Therefore, assessment of both the rod and cone systems and topographic mapping of local dysfunction for the central retina are crucial for disease diagnosis.
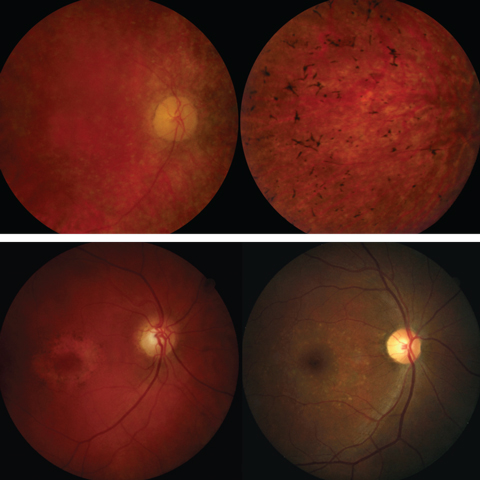 |
| Fig. 5. The top panel shows fundus photos of retinitis pigmentosa. The bottom panel shows fundus images of cone-rod dystrophy (left) and Stargardt disease (right). Click images to enlarge. |
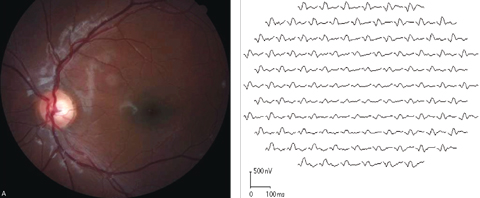 |
| Fig. 6. Marked diffuse mfERG response attenuation was detected in both eyes of a 13-year-old Stargardt disease patient. This fundus image and corresponding mfERG show the results from the left eye. Click images to enlarge. |
ERG testing is especially valuable in determining the functional status of the retina in those with less prominent funduscopic abnormalities (Figure 6). Furthermore, careful monitoring is essential to determine whether the disease is stationary or progressive for both diagnostic and prognostic purposes.
Autoimmune retinopathy (AIR). This group of inflammatory-mediated retinopathies is characterized by vision loss, photoreceptor dysfunction and the presence of circulating autoimmune antiretinal antibodies. The spectrum of these retinopathies includes paraneoplastic AIR such as cancer-associated retinopathy (CAR) and melanoma-associated retinopathy (MAR), and retinopathies in the absence of malignancy—presumed non-paraneoplastic autoimmune retinopathies that have similar clinical and immunological features.
ERG is sensitive in detecting the retinal abnormalities, often showing significantly reduced responses early in the disease course, even when funduscopic appearance is normal.12 Western blot and immunohistochemistry assays are also used to detect antiretinal antibodies in the diagnosis of AIR.12
CAR is commonly associated with lung cancer, but has also been reported in patients with breast, gynecologic, colon and other cancers.13,14 In CAR, studies suggest that autoantibodies specific to tumor antigens cross-react with certain proteins (e.g., recoverin and α-enolase) existing in retinal cells and induce apoptotic cell death.15,16
In the early stages, severe electrophysiological response attenuation with rapid progression despite relatively less affected funduscopic manifestation is contributing evidence to the AIR diagnosis. Carcinoma always needs to be ruled out with careful medical workup. Considering retinal function abnormalities may precede the diagnosis of systematic cancer, ffERG and mfERG tests are pivotal in managing these cases.
MAR is a paraneoplastic retinopathy in patients with a positive history of malignant melanoma. It is more common in men than in women and commonly presents after the melanoma is diagnosed, often at the advanced stages of the disease.17,18 ERG is quite sensitive in detecting retinal abnormalities associated with MAR.19 Classic MAR patients show ffERG abnormality with reduced b-wave amplitude due to circulating antibodies reacting with bipolar cells.20,21
Plaquenil toxicity. Many systemic medications cause toxic retinopathy, one of which is Plaquenil (hydroxychloroquine, Sanofi-Aventis).22-24 Widely used for treating conditions such as systemic lupus erythematosus and rheumatoid arthritis, Plaquenil is toxic to the retina and can cause photoreceptor losses and RPE disruptions.25
According to the current American Academy of Ophthalmology recommendations on screening for hydroxychloroquine toxicity, mfERG can provide objective corroboration for visual field testing.26 Several remarkable features of mfERG testing are worth noting for their role in Plaquenil toxicity screening. First, mfERG detects dysfunction of the outer retina where the toxic damage occurs. Second, its sensitivity can be further enhanced by using ring ratio analysis to detect a localized parafoveal pattern of damage. Finally, it is excellent in detecting preexisting maculopathy to establish a baseline and identify those at higher risk for toxicity.
 |
| Fig. 7. Interocular comparison of ffERG responses of a patient with unilateral retinal siderosis shows marked amplitude reduction for both the scotopic and photopic responses in the left eye with an iron-containing intraocular foreign body. Click image to enlarge. |
Toxic retinopathy resulting from intraocular foreign body. Retinal photoreceptors and RPE cells are especially susceptible to the released iron from metallic intraocular foreign body, as accumulation of intracellular iron in RPE and Müller cells results in retinal siderosis.27 ERG provides quantitative and objective assessment of retinal dysfunction of the rod and cone systems to guide surgical management (Figure 7).
Optic nerve hypoplasia (ONH). This congenital anomaly is characterized by an underdeveloped optic nerve in one or both eyes. ONH is among the three leading causes of blindness in children in the United States, and its prevalence has increased over the past several decades.28,29
The pathogenesis of ONH is not fully understood, although young maternal age, primigravida and preterm birth are among the suggested risk factors.30 pERG is useful to assess functional deficits associated with ONH, as a reduced N95 component in pERG has been found in patients with ONH (Figure 8).31
 |
| Fig. 8. These pattern ERG responses of the right (A) and left (B) eyes in a patient with bilateral asymmetric optic nerve hypoplasia show lower amplitude of the N95 component in the right eye with more severe optic nerve deficit. Click image to enlarge. |
Primary open-angle glaucoma (POAG). Electrophysiological tests such as pERG could objectively assess dysfunction of ganglion cells. Because of this distinctive feature, these tests may one day have a significant impact on the clinical management of glaucoma patients. Particularly, a recent study found pERG can provide early detection of ganglion cell dysfunction when visual field defects are minimal in early glaucoma.32 Moreover, PhNR is capable of detecting a reversible aspect of glaucomatous dysfunction after IOP reduction.33
Retinal and optic nerve deficits in central nervous system disorders: multiple sclerosis (MS). In patients with MS or MS-associated optic neuritis, optic nerve axonal abnormalities are commonly reflected by prolongation of the pVEP P100 associated with demyelination, and also by attenuation of the P100 in a subset of MS patients.34 In recent years, studies have reported abnormalities of non-myelinated axons and retinal neurons.35 Furthermore, neuronal abnormalities not only involve ganglion cells, but can also predominantly occur in the inner and outer nuclear layers in a subset of patients.36 Therefore, pVEP and mfERG can be valuable in detecting axonal and neuronal impairments.
The pathological disease processes affecting the primary visual pathway are reflected in their electrophysiological characteristics. Electrodiagnostics are effective in objectively evaluating visual function along hierarchical stages of the primary visual pathway, and the battery of tests must be interpreted in its totality. In conjunction with other clinical findings, these tests enable clinicians to diagnose many ocular diseases, monitor for disease progression and serve as a functional marker when assessing therapeutic efficacy.
Dr. Bi is an associate professor at Nova Southeastern University College of Optometry.
1. Robson JG, Frishman LJ. The rod-driven a-wave of the dark-adapted mammalian electroretinogram. Prog Retin Eye Res. 2014;39:1-22. |