When the world counted down the remaining seconds of 2019 and welcomed in what was supposed to be “the year of vision,” we had no way of knowing we were in for a shocking turn of events instead. Just 10 weeks into 2020, COVID-19 had become the focus of the world and had upended life as we knew it.
The steady income ODs typically enjoy took a roller coaster ride when much of the economy shut down during the lockdown earlier this year, and has yet to fully recover. The result: 2020 painted a very different financial picture for optometry than years past, as told by our annual income survey.
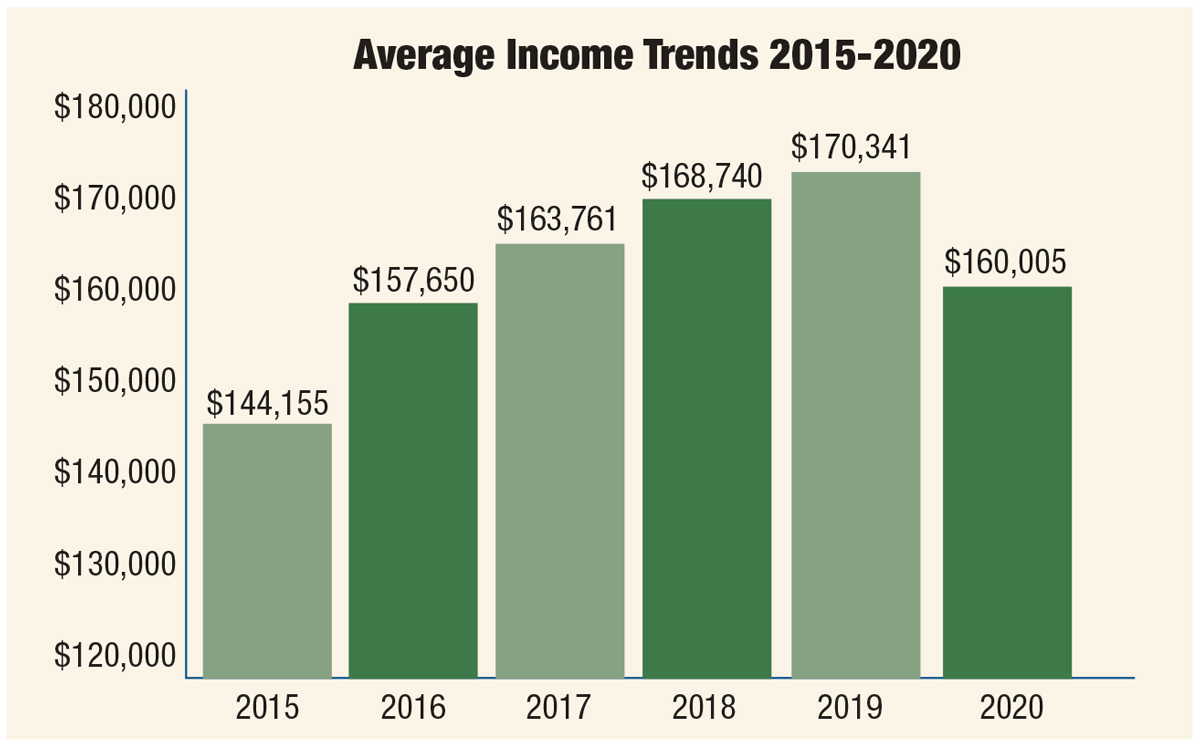
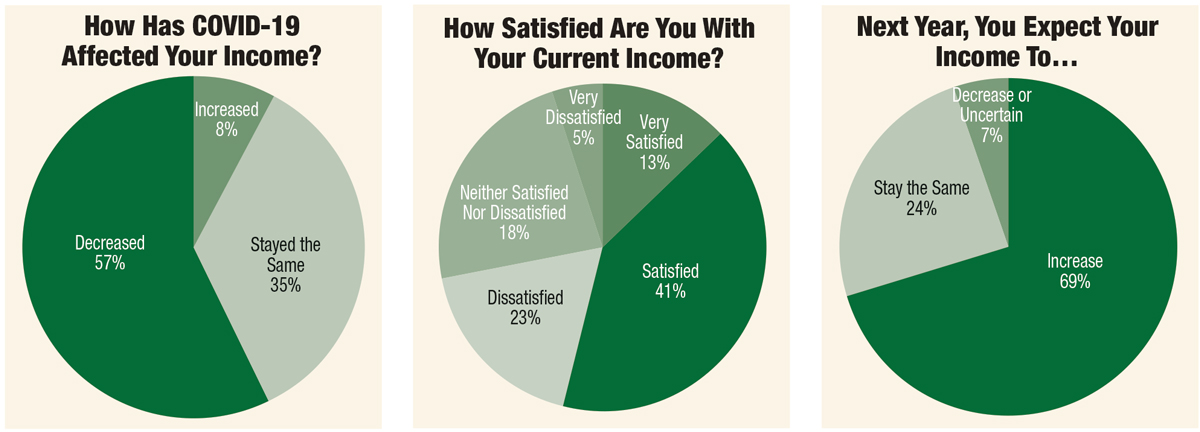
This year, 600 respondents shared their financial stories with us. Unfortunately, average annual income experienced a sharp drop to $160,005, down 6% from 2019. While optometric income has been increasing at slower rates over the last few years in our survey, this is the first time it’s dipped into the negatives, landing roughly in the middle of 2016’s and 2017’s numbers. Further, that 6% drop is an average that can mask the more acute factors that affected some segments of the audience. The majority of respondents (57%) reported that their income decreased, but 35% didn’t experience a financial change, and 8% even saw an increase in their earnings. For it all to net out at a 6% decline means some ODs really felt the pinch this year.
 |
| Click image to enlarge. |
Those working part-time fared especially poorly. Part-timers made an average of $88,791 in 2020, a whopping 30% less than last year. Among full-time workers, 2020 income was 3% less than 2019 at $170,655.
When asked to explain the financial shortfall, many ODs named the shutdown in the spring/summer as the biggest influence behind their pay cut. Decreased patient volume/exam fee revenue, decreased product sales and increased expenses for PPE, disinfection and other safety measures followed, in order of importance. According to the survey, the cost of staff training/rehiring had the smallest impact on income.
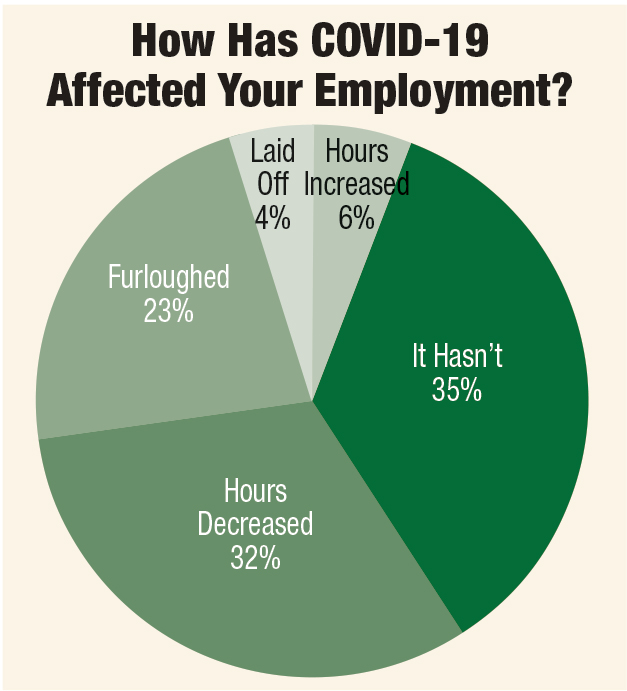
Further, almost 60% of respondents said COVID-19 negatively affected their employment, with 27% being furloughed or laid off and 32% facing reduced hours. Only 35% were not affected job-wise, and 6% actually claimed increased hours.
Editor’s note: As always, be mindful that while we ask the same survey questions, the responses we compare from year to year come from different individuals, making trend analysis tricky, especially among a smaller cohort. The results offer a representative look at the profession but aren’t considered statistically rigorous.
 |
| Click image to enlarge. |
Practice Doesn’t Always Pay Off
This year’s survey cohort showed that more years of experience don’t necessarily equate to a larger paycheck, much to more seasoned ODs’ dismay.
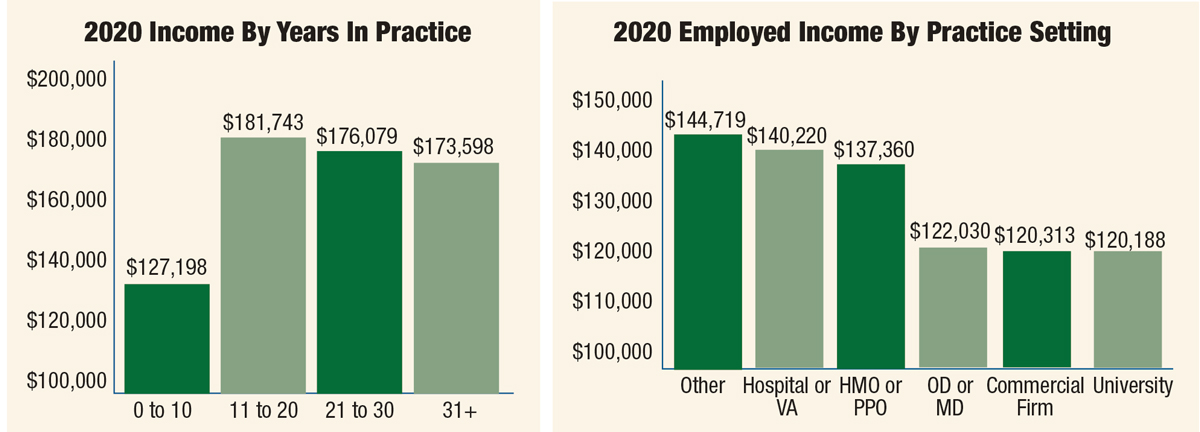
Entry-level respondents (i.e., those with up to 10 years of experience) earned an average of $127,198, a 12% drop from the average income beginners made in 2019.
The average income leap from the first experience bracket to the next one—11 to 20 years—skyrocketed 43% to $181,743, representing a 7% increase from 2019. These ODs have settled into their career nicely, earning the highest income compared with their counterparts who have more or fewer years of experience.
Financial progress began to stall in the subsequent experience brackets, starting with those with 21 to 30 years of experience. These clinicians earned an average of $176,079, 3% less than those with 11 to 20 years of experience. This also represents a slight decrease from the average income this experience group reported in 2019.
Perhaps the hardest blow was felt by the most veteran ODs. This year’s participants who have been practicing for more than 30 years earned an average of $173,598, a 17% decline from the average income this bracket reported in 2019; it’s also 1% lower than their colleagues with 10 fewer years of experience.
 |
| Click image to enlarge. |
Benefits of Being the Boss
Working for yourself continues to pay off for survey respondents—literally. While the majority of participants (58%) are employed, those who are self-employed stole the show again in 2020, earning an average of $204,347, a 61% increase from those who are employed ($127,197 on average). While this is a significant monetary gap, it narrowed slightly over the last year due in part to both groups seeing a decrease in their average incomes from 2019, with employees making 4% less and self-employed workers making 7% less.
Of those who are employed, 46% work for another OD or an MD, 18% for a commercial firm, 10% for a hospital or VA, 9% for an HMO/PPO and 6% for a university. Eleven percent chose the “other” option. While these percentages were similar to years prior, average annual incomes reported were not; all but one category faced a decline.
University employment was the least lucrative, with professors earning an average of $120,188 in 2020. This category fell a few ranks, and these ODs made 7% less compared with last year’s results.
Employment through a commercial firm moved down two rankings (14% less than last year at $120,313) and working for an OD or MD (4% less at $122,030) moved up one to comprise two of the more lower-paying gigs. HMO or PPO employees were bumped from the highest-ranking category to earn $137,360 on average—down 15% compared with 2019. Those employed by a hospital or VA held onto the second highest-paying category for the second year in a row but made 7% less than last year at $140,220.
Switching it up from 2019, when employees who chose the “other” option were the least profitable, this group earned the highest income this year at $144,719, up 24%.
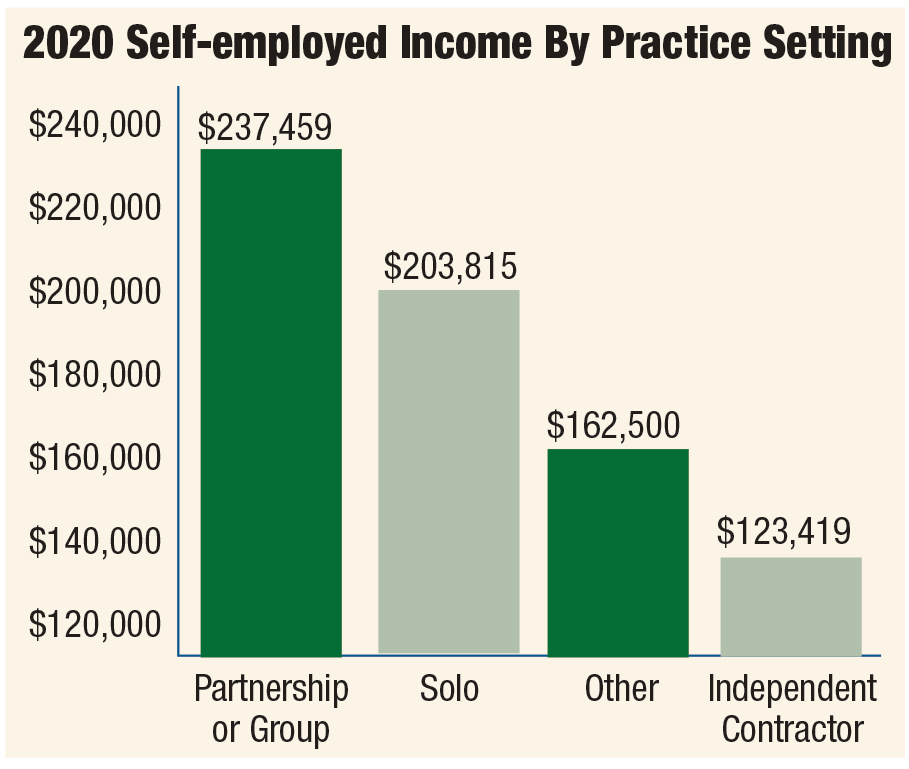
On the other hand, looking at those who are self-employed, 53% practice on their own, 33% are members of partnerships or groups and 13% are independent contractors. Less than 1% chose the “other” option. These percentages were comparable to last year’s; however, similarly to employed ODs, all but one self-employed category experienced a decrease in average annual income.
As it has been the past few years, working as an independent contractor was the least profitable option and only paid an average of $123,419 in 2020, down 10% from last year.
Continuing to rise above the rest but bringing in 14% less than 2019, were self-employed ODs who work in partnerships or groups; they earned an average of $237,459 in 2020.
 |
| Click image to enlarge. |
Location, Location, Location
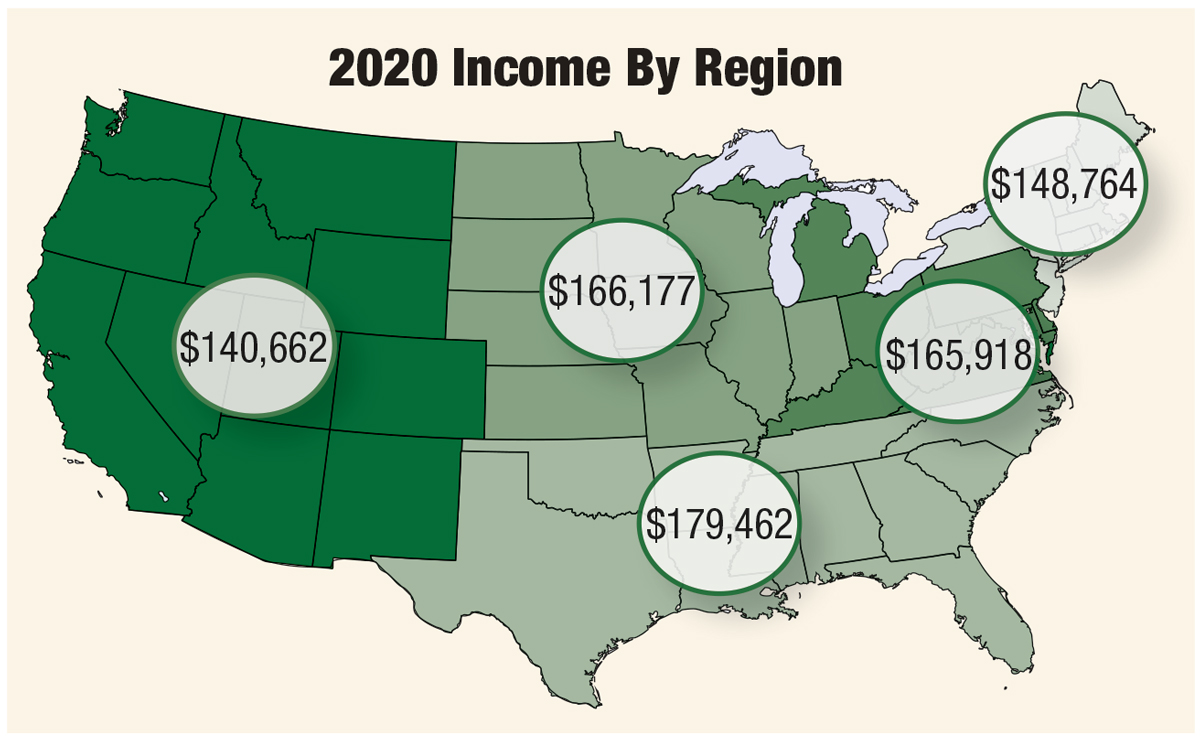
While the decision to pack up and move takes time and thought, it might be a little easier to make if you knew you could be earning 28% more elsewhere. This year’s survey saw each region of the continental United States shift in its ranking and all but one experience a decline in average annual income claimed by its OD residents.
Practitioners in the West were the least well-compensated this year, moving down a ranking and only making an average of $140,662. This represents a 16% decrease in the average income reported in this region in 2019.
Moving up from the least profitable region in 2019 but still making 7% less this year, the Northeast made 6% more than the West at $148,764. Earning 12% more than the Northeast, the Mid-Atlantic/Lower Great Lakes region was bumped from the most profitable region to practice in 2019 and made 11% less than last year’s counterparts at $165,918. Neck-and-neck with this region was the Midwest, which moved up one ranking but made a little over 1% less than 2019, at $166,177.
The South reclaimed its title as this year’s most profitable place to practice optometry, with ODs there earning an average income of $179,462, 3% more than respondents from this part of the country claimed in 2019 and 8% more than those practicing in the Midwest reported in 2020.
 |
| Click image to enlarge. |
Gender Income Equality Faces Long Road Ahead
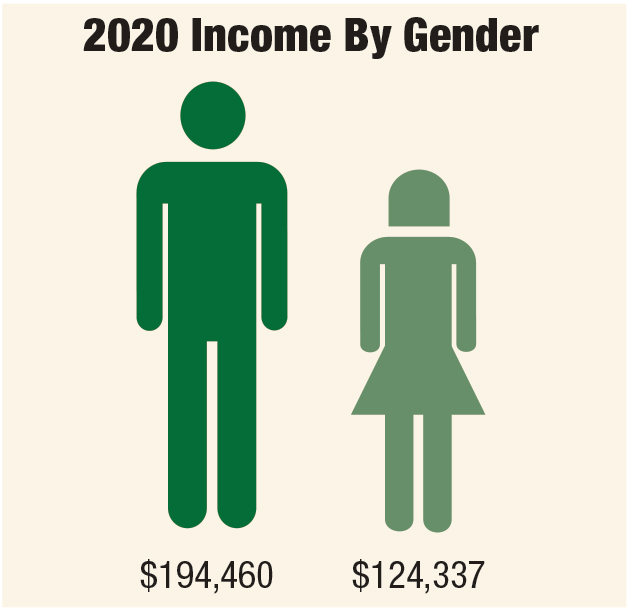
As we’ve consistently seen, the gender wage gap plays a prominent role in optometry, and, unfortunately, it doesn’t seem to be closing any time soon. Rather, the opposite was true for ODs in 2020. While the gender gap had been narrowing in recent years, in 2019 it widened by 10% to a 47% disparity between male and female ODs. The past 12 months saw the divide between genders open up even more; it now sits at 56% This is the highest it’s been over the last five years.
This year, men out-earned women on average $194,460 to $124,337. Further distancing the groups, men only made 2% less than their counterparts did in 2019, while women made 8% less.
The less one’s experience, the less the disparity, 2019’s survey found. This also holds true for 2020’s results, except when it comes to beginners. Males with zero to 10 years in the field earned $168,643 on average—56% more than their female counterparts who were also just starting out; these women made an average of $108,216. The men in this cohort actually earned 5% more in 2020 than in 2019; for women, year-over-year earnings were 18% less, widening the 2020 income gap by 35% over the last year.
The smallest income disparity (although not small in its own right) belonged to men and women with 11 to 20 years of experience. Men earned an average of $216,078, 45% more than the women in this group ($148,946). This disparity is down 2% from last year’s, with men making 6% more and women making 7% more compared with 2019.
The income gap between men and women with 21 to 30 years of experience under their belts was the same as that between beginners. Men earned an average of $211,588, 56% more than women with the same level of experience, who reported an average income of $135,727. While this gap is widening, it may continue doing so at a slower rate, as male and female ODs in this group experienced an increase in average income this year—4% and less than 1%, respectively.
Like last year, the largest income disparity between men and women at each experience level existed among those with the most experience in 2020. At an average income of $184,353—18% less than last year—men who have been practicing for more than 30 years earned 89% more than female veterans, who sat at $97,413 on average, 26% less than 2019. This represents another substantial step backwards for this category, with the gap continuing to widen in large increments.
 |
| Click image to enlarge. |
Glass Half Full
Despite the toll this year took on average annual income, the majority of respondents seemed to remain positive, as 54% reported feeling satisfied or very satisfied with their income (down from 67% last year). Many respondents had their annual take-home to thank for their comfortable lifestyle and work-life balance. Others named their income as the reason they’re able to provide for their family while still planning for the future. The rewarding nature of the job took priority to a lot of respondents.
On the flip-side, many ODs who expressed dissatisfaction toward their income named COVID-19 as the culprit, with one respondent saying, “Owning my business during this time is a huge struggle, and with the deceased income, it is borderline nightmarish.” These respondents seemed to share the mindset that they feel undervalued and think their pay is not commensurate with their experience or responsibilities. They named increased cost of business and reduced vision plan reimbursement as potential reasons. Others believe there should be more opportunities for upward mobility and pay raises.
Still, many are just happy to have a job during this period of extreme and overwhelming uncertainty. “I feel fortunate to be able to earn a good income and retain my practice during a time when so many small business owners in other industries were forced to close permanently,” said one survey respondent.
The majority of respondents had higher hopes for the year to come, with 69% expecting their income to increase (up from 53% last year). Some expressed uncertainty about the future due to factors such as the presidency and pandemic. These ODs said their answer depends on the state of the economy, the prospect of a COVID-19 vaccine and whether they will face another shutdown and more rounds of layoffs.
Many echoed a similar sentiment to the one this OD sums up: “This virus will not disappear. It will keep mutating. The general public has already been taught to be afraid of being out and in a social setting. The ‘free’ public world we had will not be back. People will still be afraid to a certain extent, and this will lead to a slower economy for most businesses, especially small ones.”
 |
| Click image to enlarge. |
Adapt and Overcome
As is always the case, some ODs did better than others in 2020, keeping in mind certain factors, such as experience level, employment status, location and gender. All, however, felt the effects of the COVID-19 pandemic, even if only temporarily, in the widening gender wage gap and negative annual income rate.
Respondents didn’t let this year’s financial outcome get the best of them, though. Many have plans to offer more specialty services in the coming year, such as dry eye treatment, myopia control, specialty contact lenses and vision therapy. Others are looking to drop certain vision plans, buy new equipment and take advantage of telemedicine. Still more hope for increased hours and patient volume and said the course of the pandemic will shape their plans to increase income and develop new sources of revenue.
The trials and tribulations of 2020 will soon be a memory, and the lessons learned will hopefully allow ODs to approach 2021 better prepared for anything life may throw at them.